San Francisco Real Estate Market Update | September 2024

San Francisco Real Estate September 2024 Report cover with a dusk skyline and COMPASS branding.

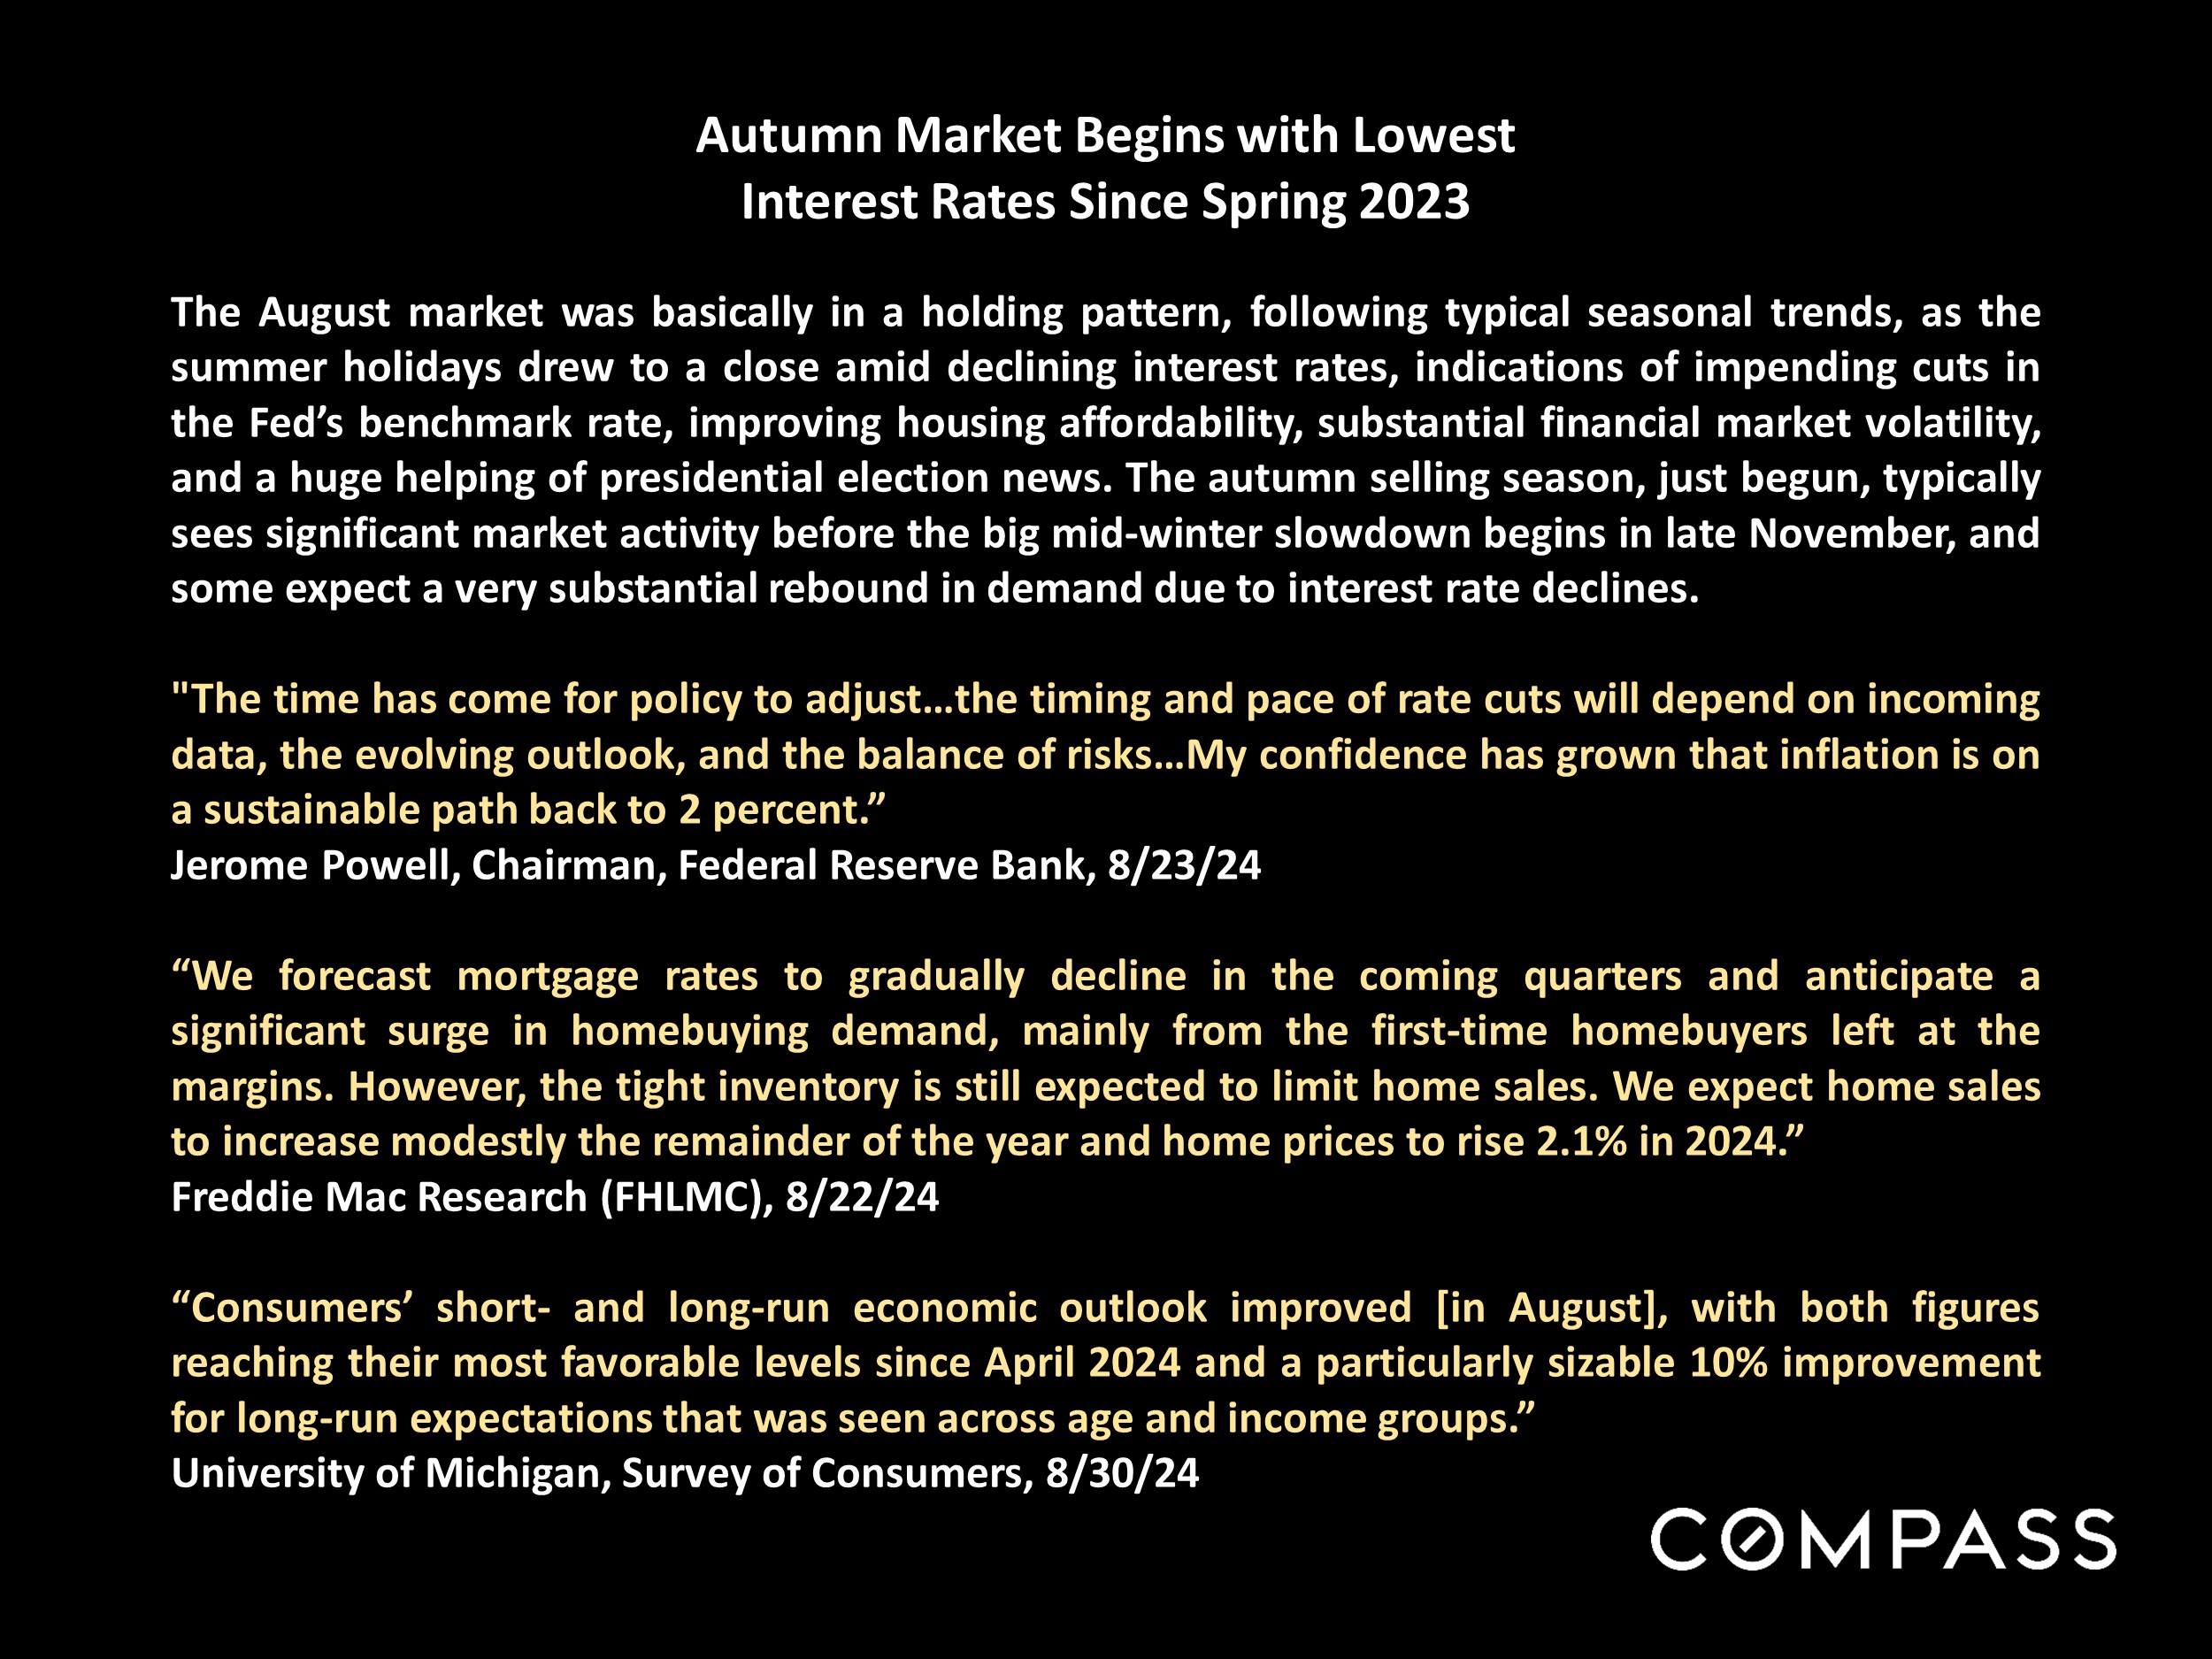
Market conditions infographic discussing interest rates, homebuying demand, housing inventory, and consumer outlook.

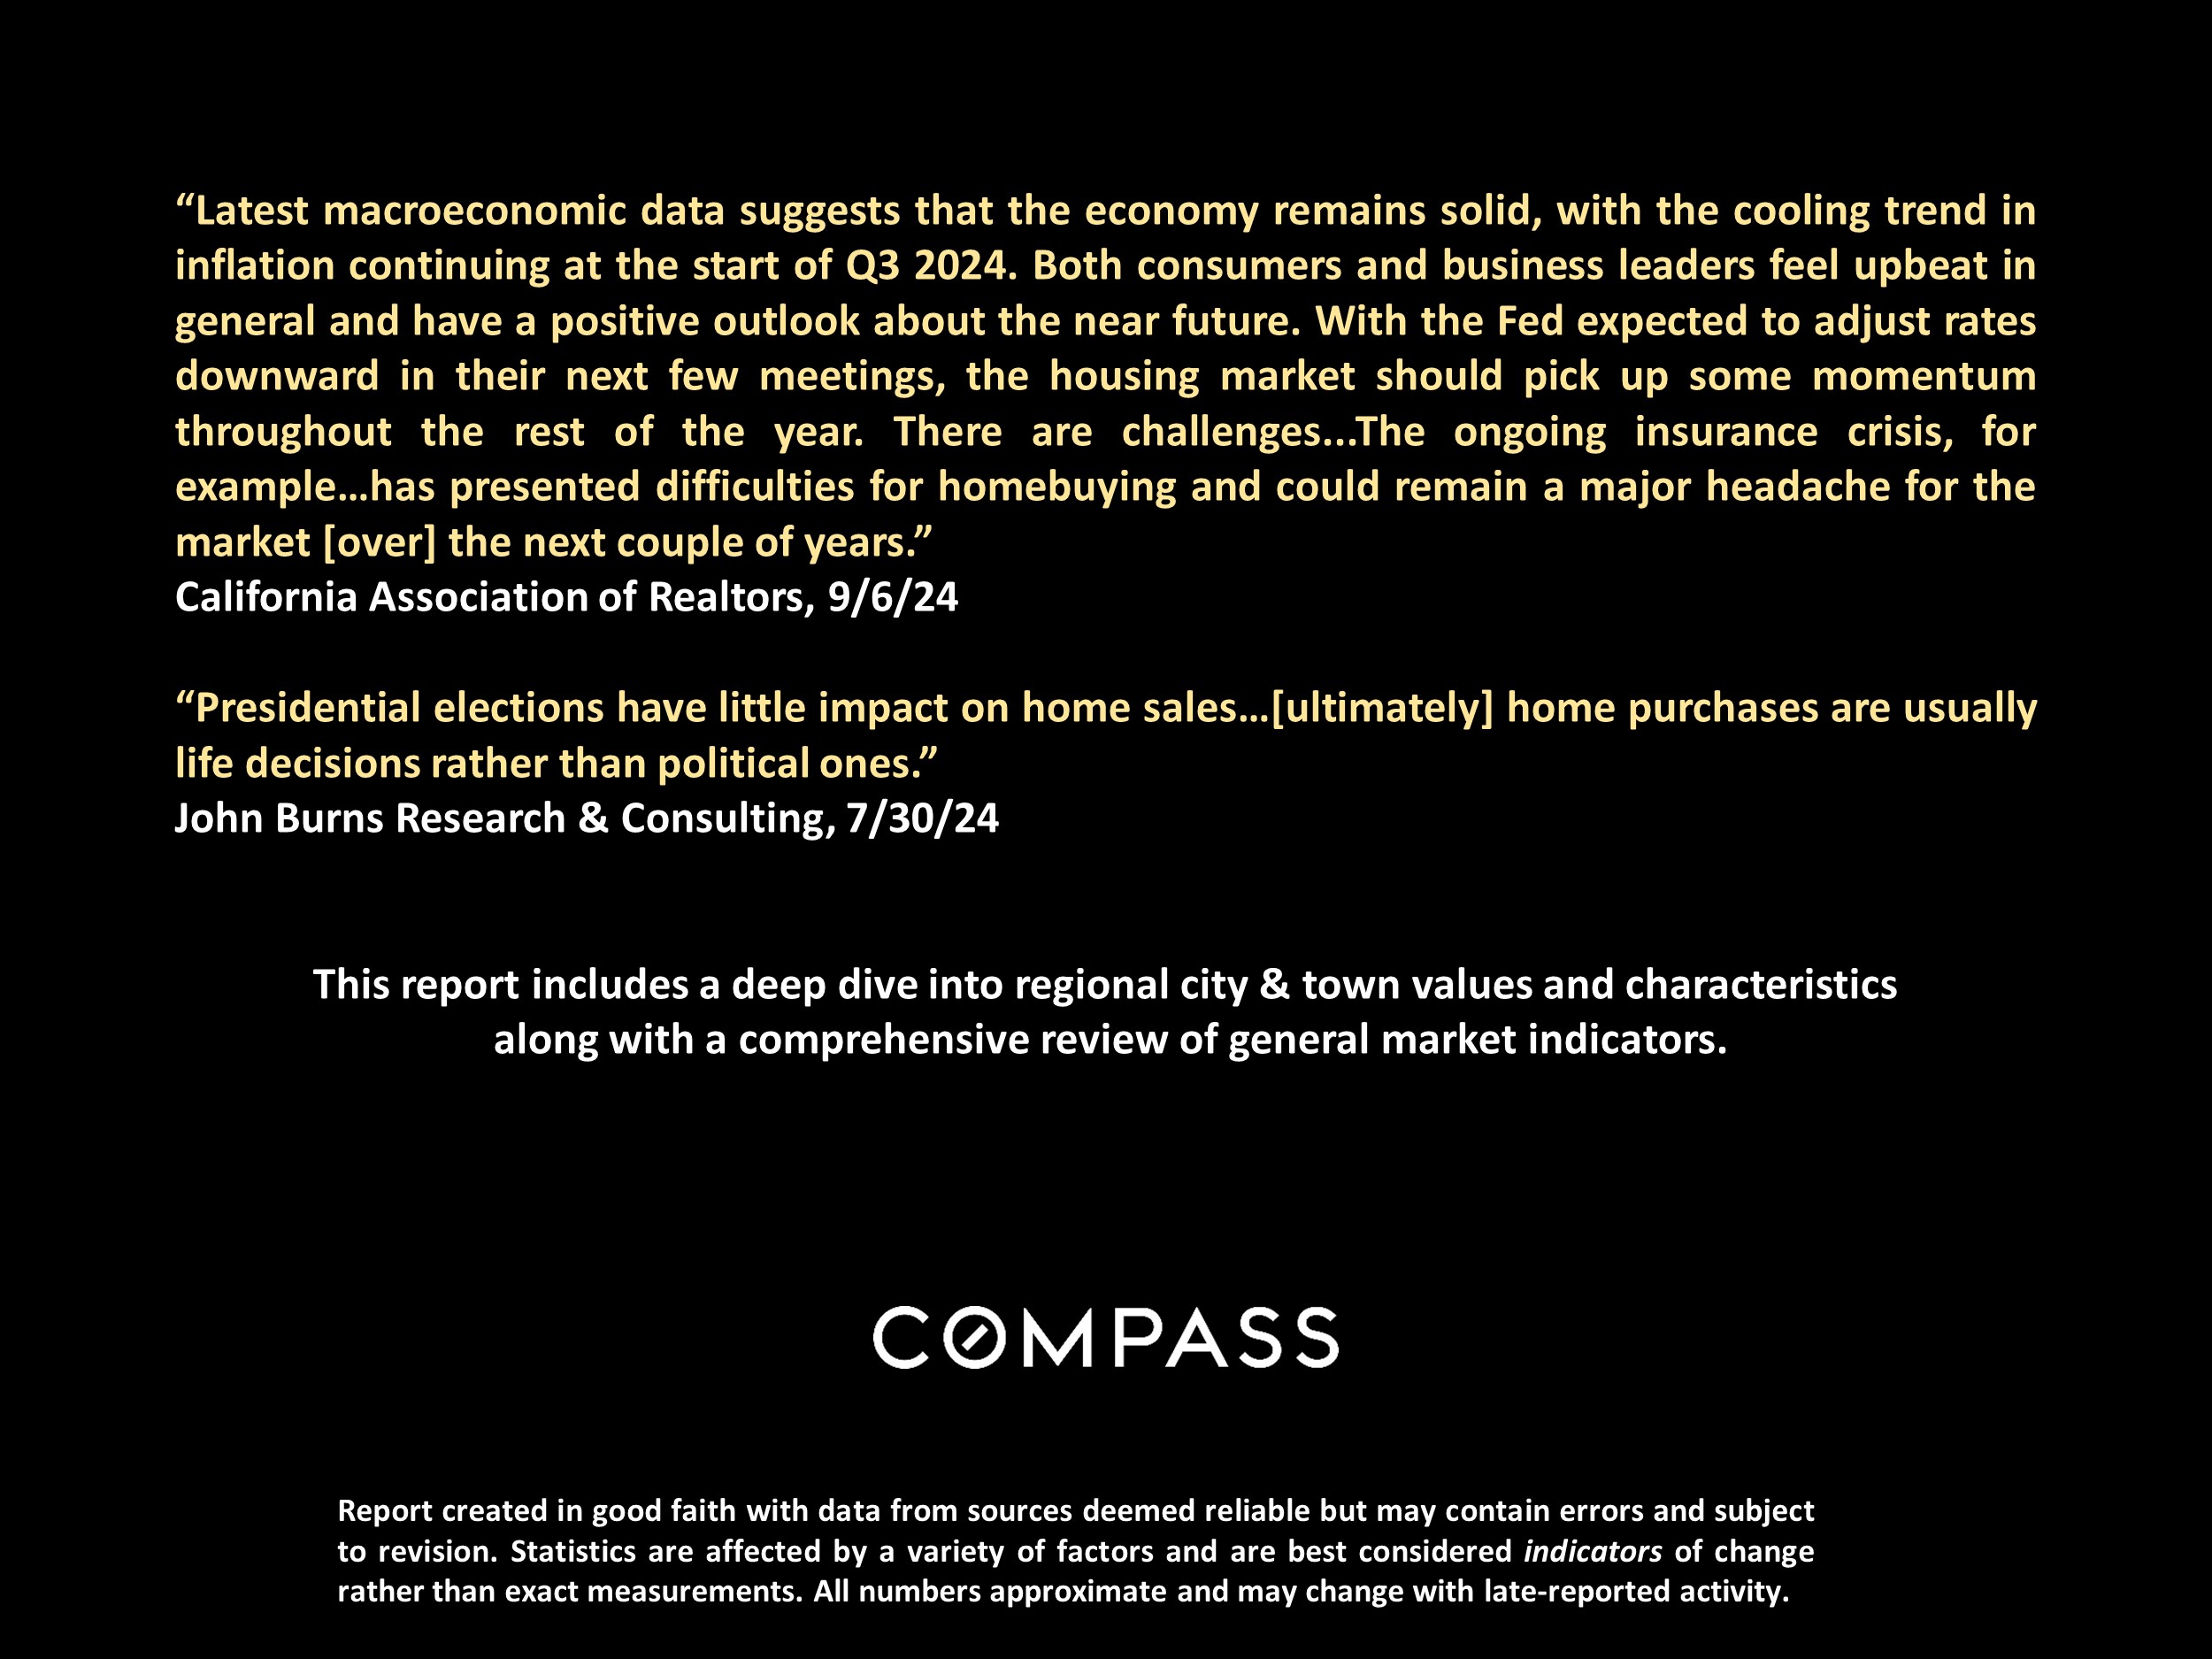
September 2024 San Francisco market report introduction with economic outlook, Compass wordmark, and data disclaimer.

Chart of weekly 30-year mortgage rates from January 2023 to September 2024, peaking near 7.8% in October 2023.

San Francisco 2024 home sales by price segment, shown in a color-coded pie chart with counts and property-type statistics.

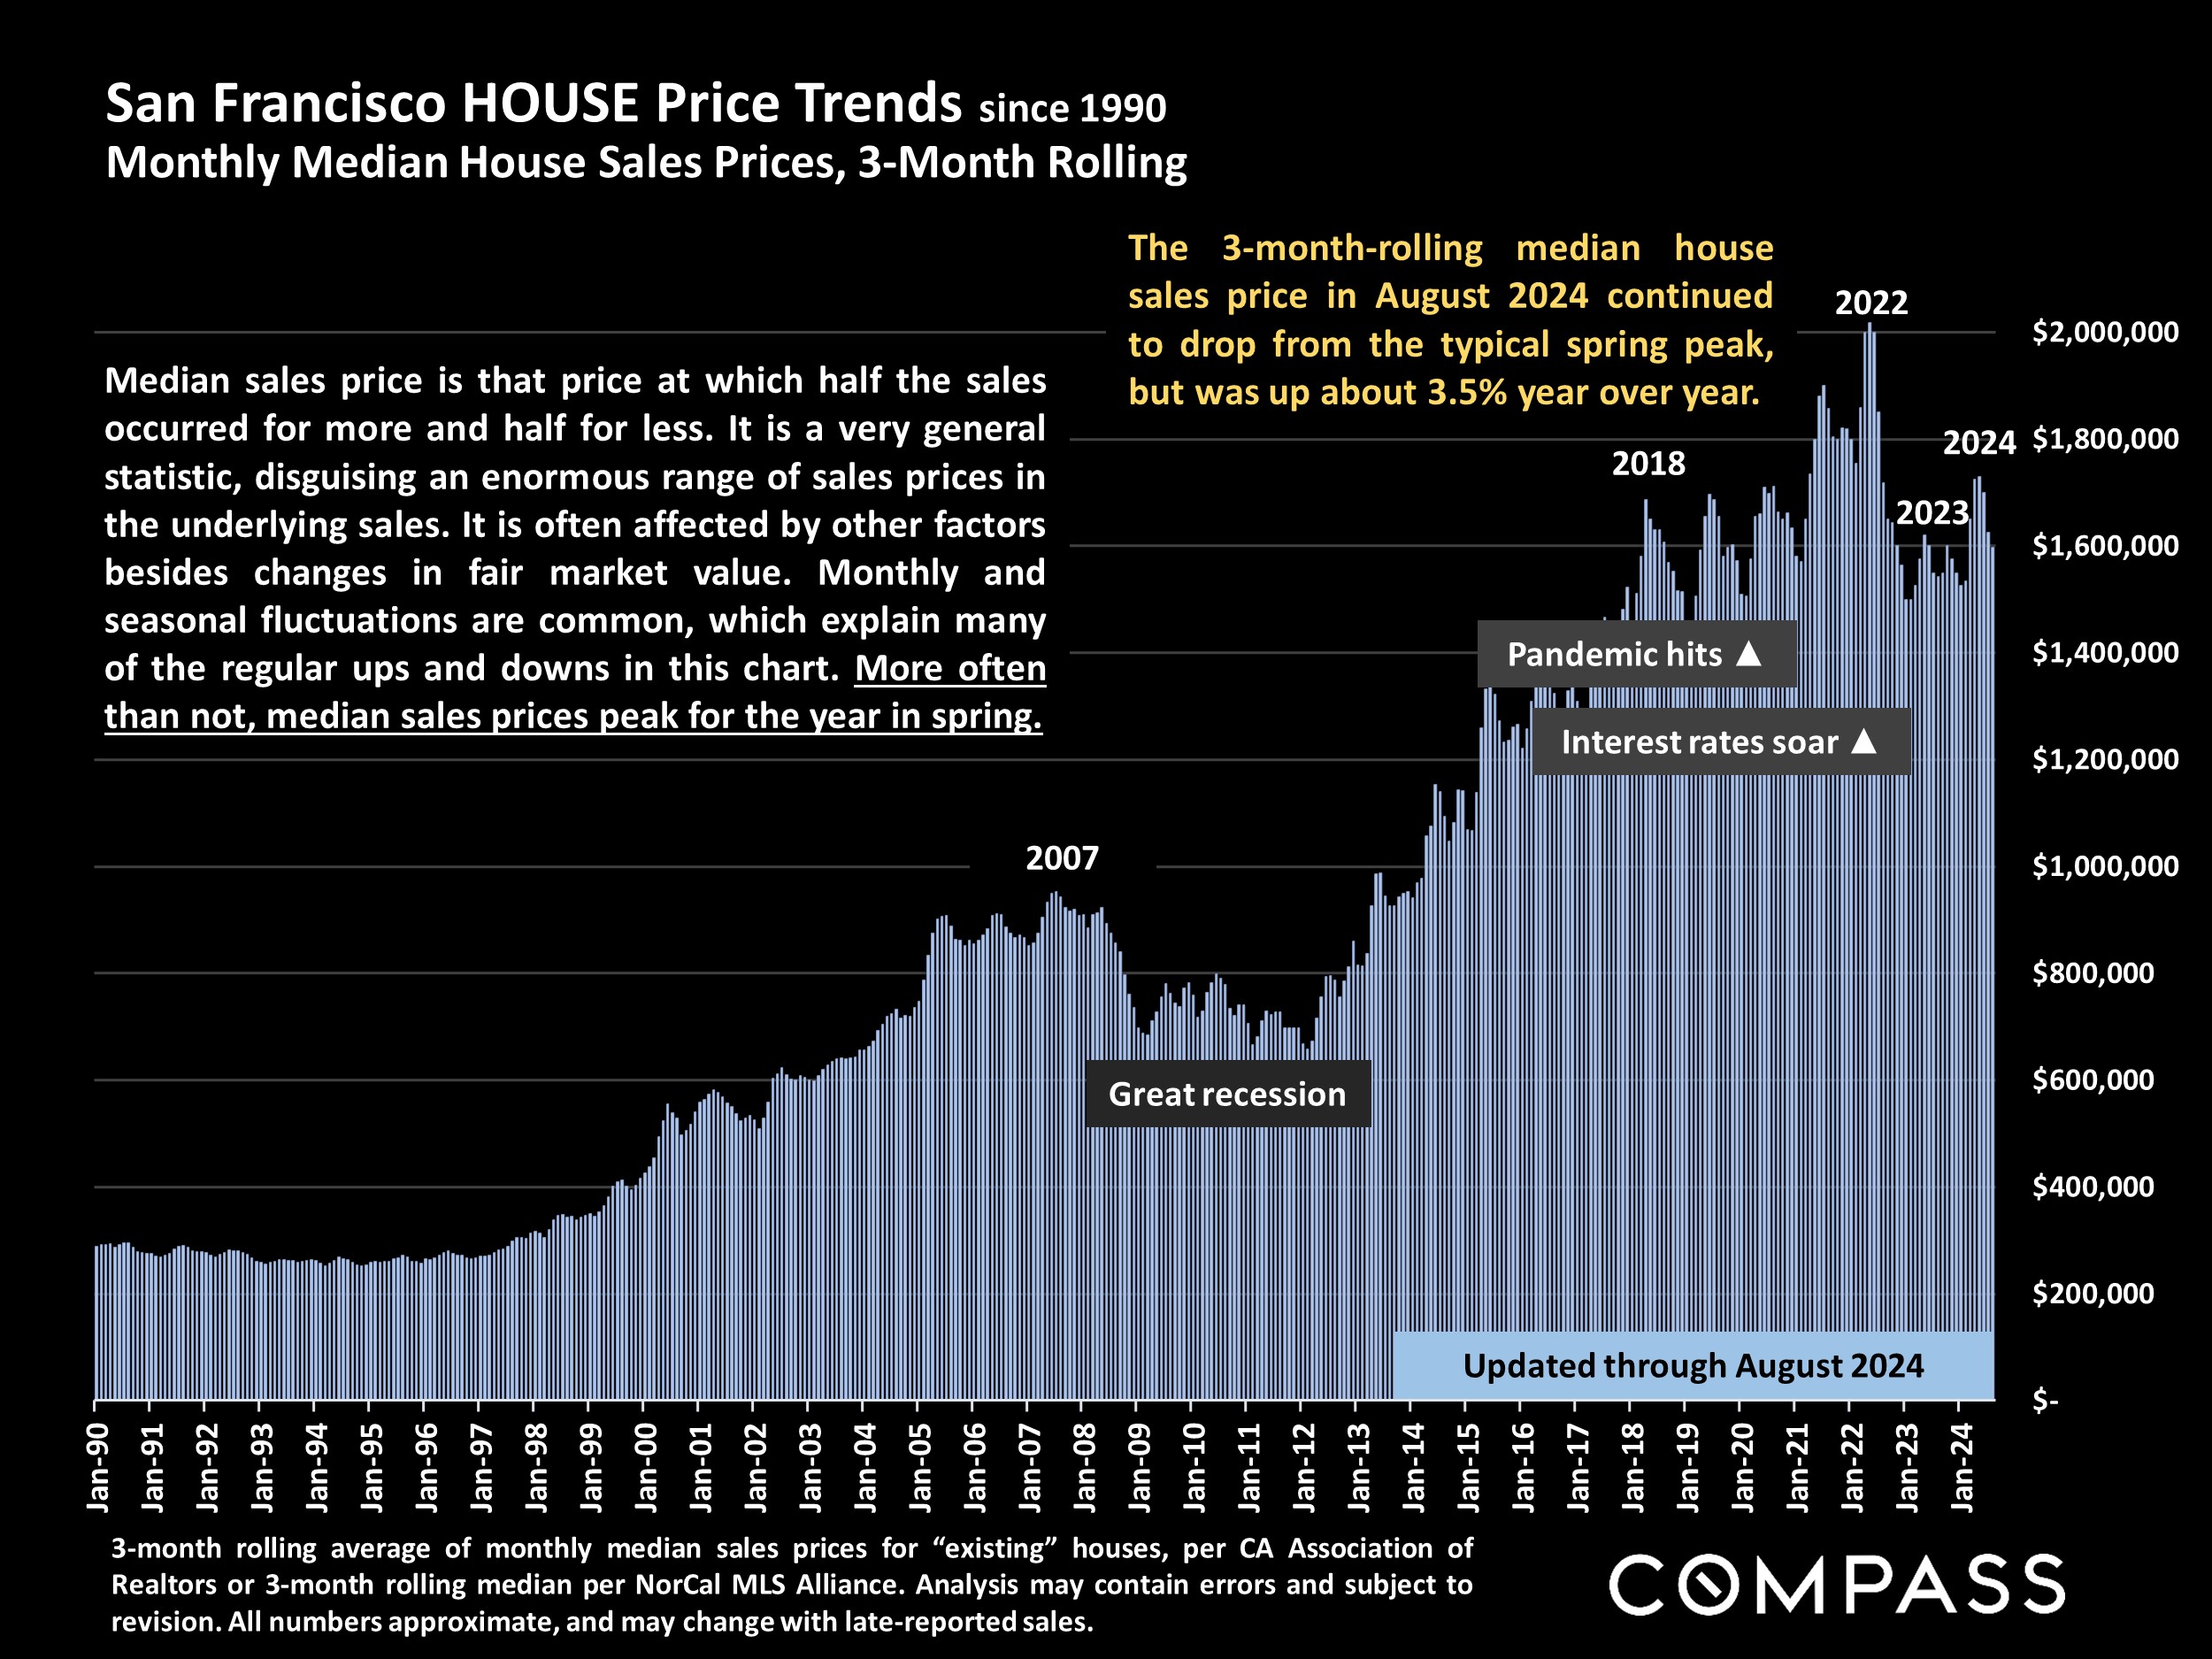
Bar chart of San Francisco median house prices, 1990–August 2024, peaking near $2 million in 2022.

San Francisco condo price trend chart, showing three-month median sales prices from 2005 through August 2024.

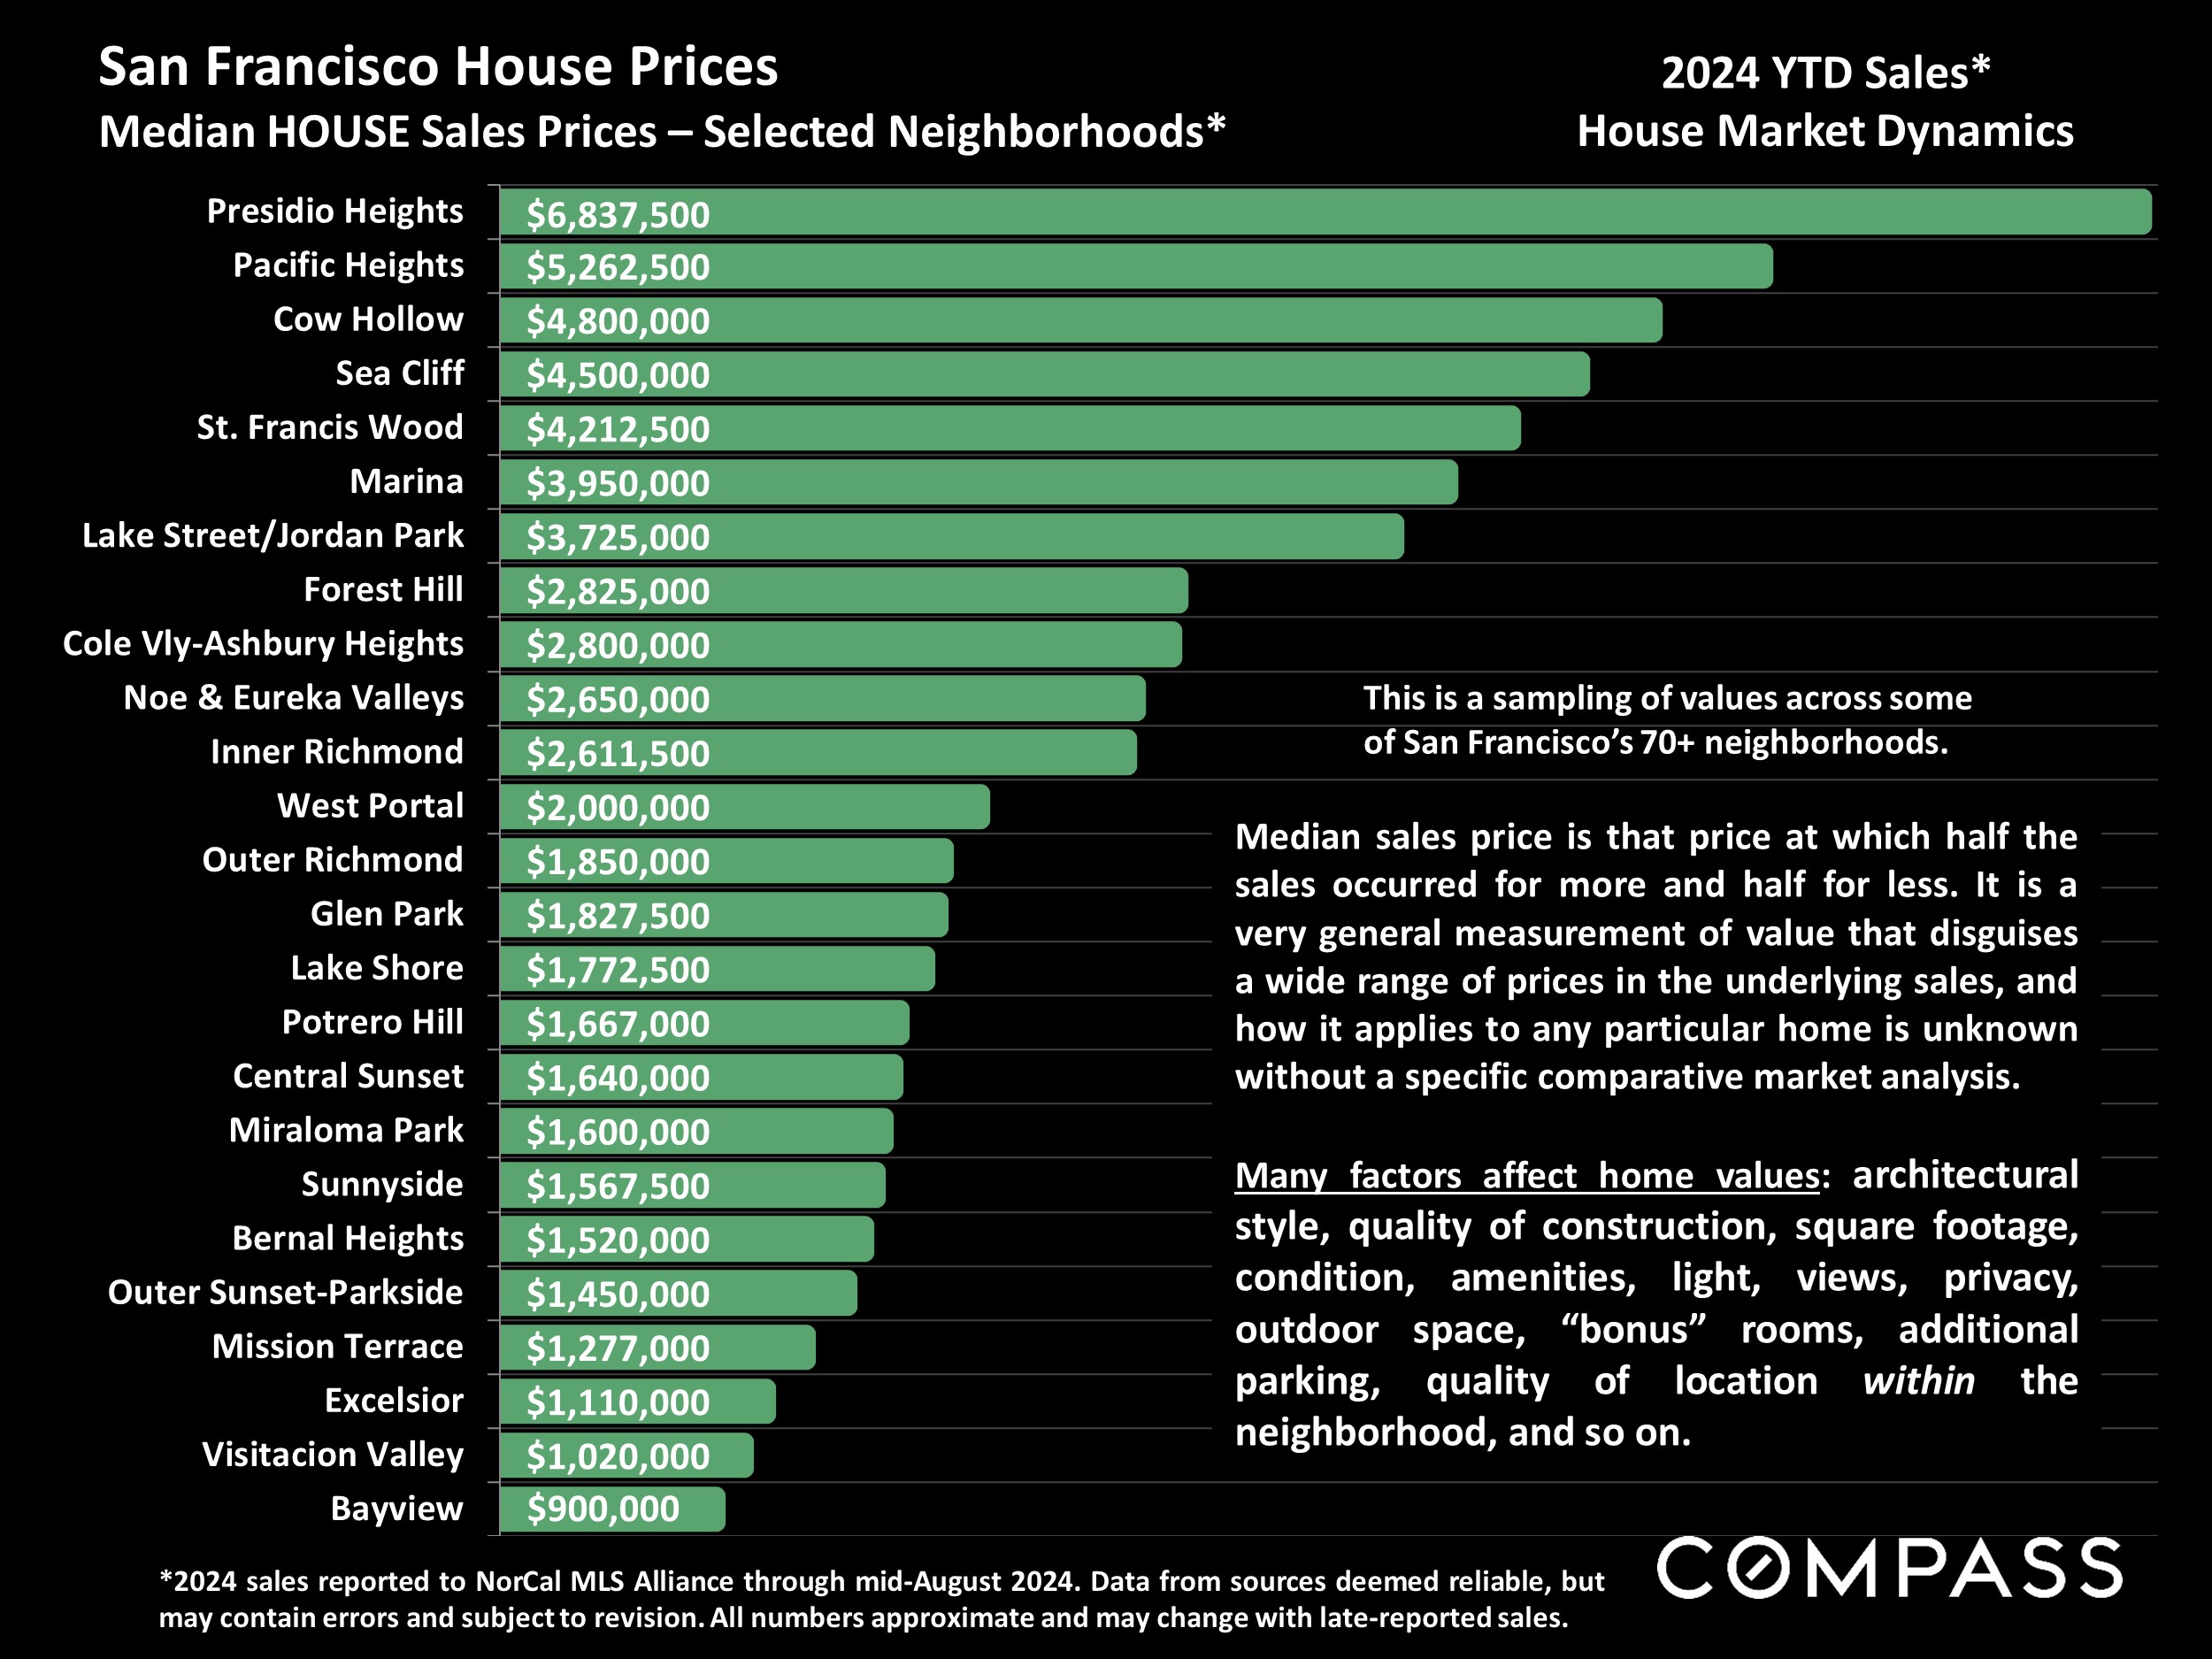
Chart of median San Francisco house prices by neighborhood, led by Presidio Heights at $6,837,500 and ending with Bayview at $900,000.

Bar chart of San Francisco condo prices by neighborhood, led by Cow Hollow at $1.84 million; Compass branding appears below.

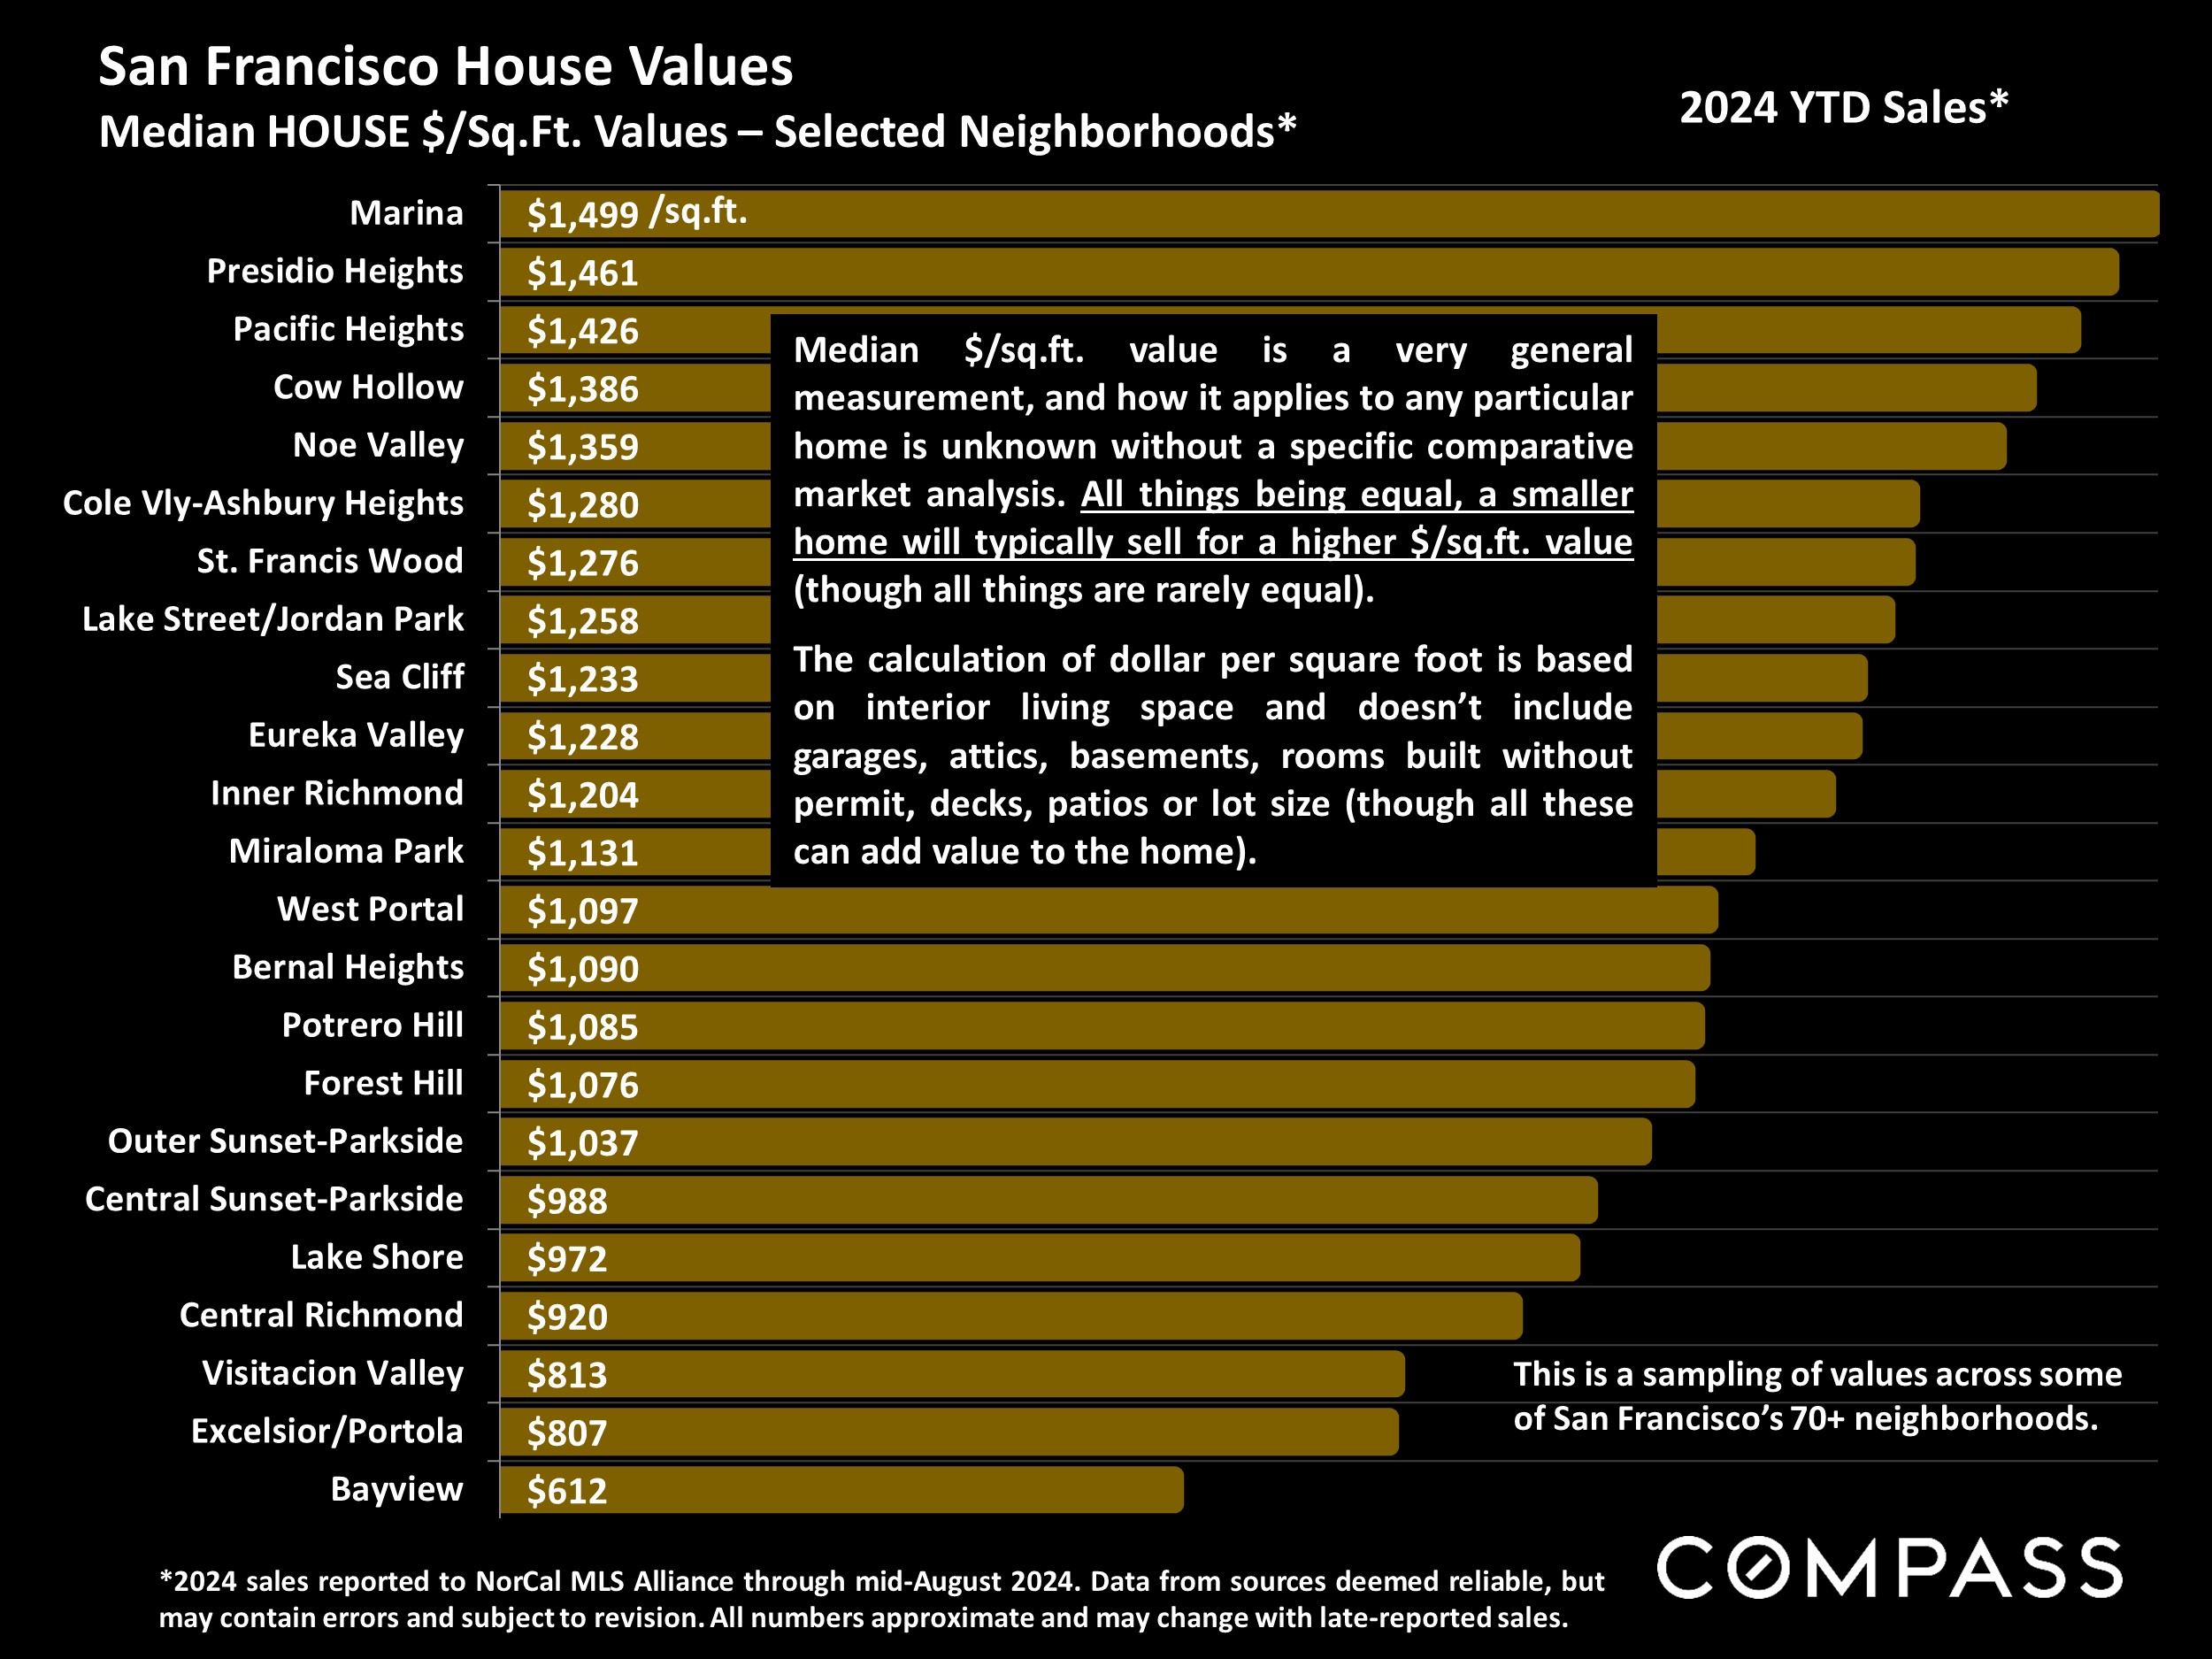
Chart comparing 2024 year-to-date median house prices per square foot across selected San Francisco neighborhoods.

Chart of 2024 San Francisco condo prices per square foot by neighborhood, from Cow Hollow at $1,247 to SoMa at $780.

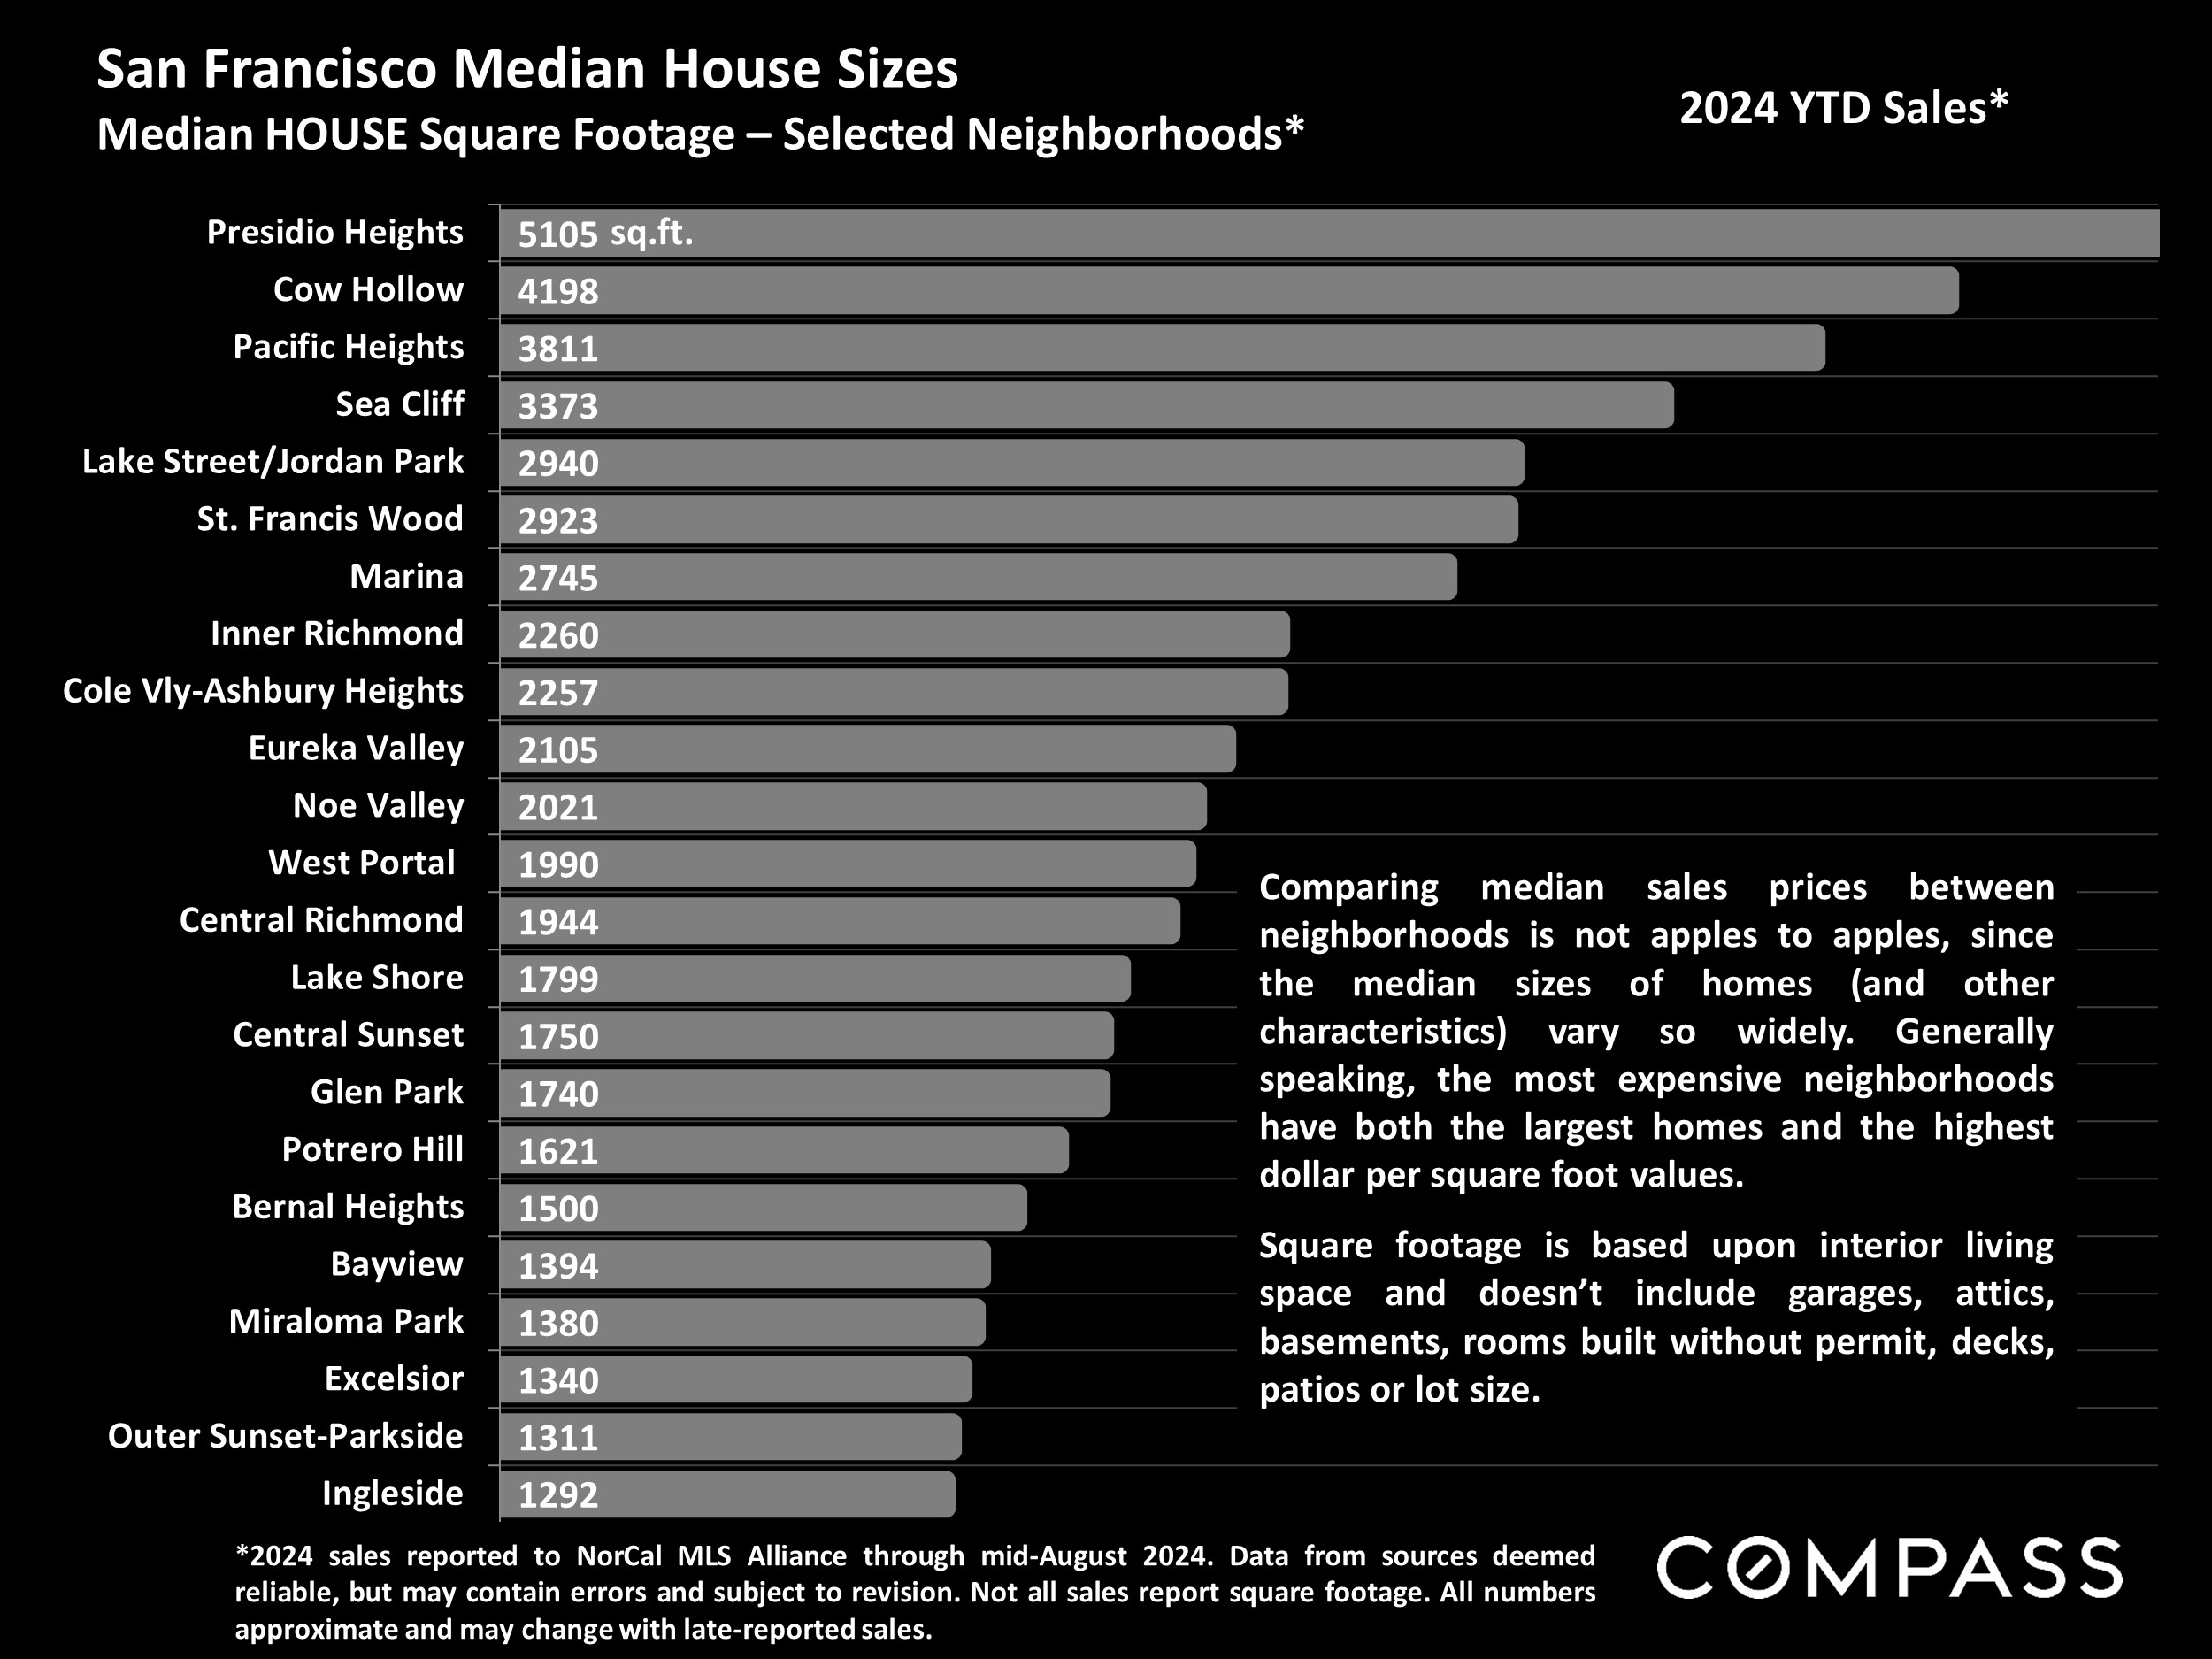
Chart comparing median house sizes across selected San Francisco neighborhoods, from Presidio Heights at 5,105 square feet to Ingleside at 1,292.

Chart comparing median condo square footage across selected San Francisco neighborhoods, from Presidio Heights to Van Ness/Civic Center.

Bar chart compares days on market across San Francisco districts; Pacific Heights leads at 43 days, while Sunset-Parkside has 20.

San Francisco condo market chart showing days on market by district, ranging from 33 to 73 days.

Chart of San Francisco luxury home sales by district and price segment, with D7 showing the most sales.

Chart of San Francisco luxury home sales by district and price range, with Pacific and Presidio Heights leading.

Color-coded map of San Francisco neighborhoods grouped into ten real estate districts.

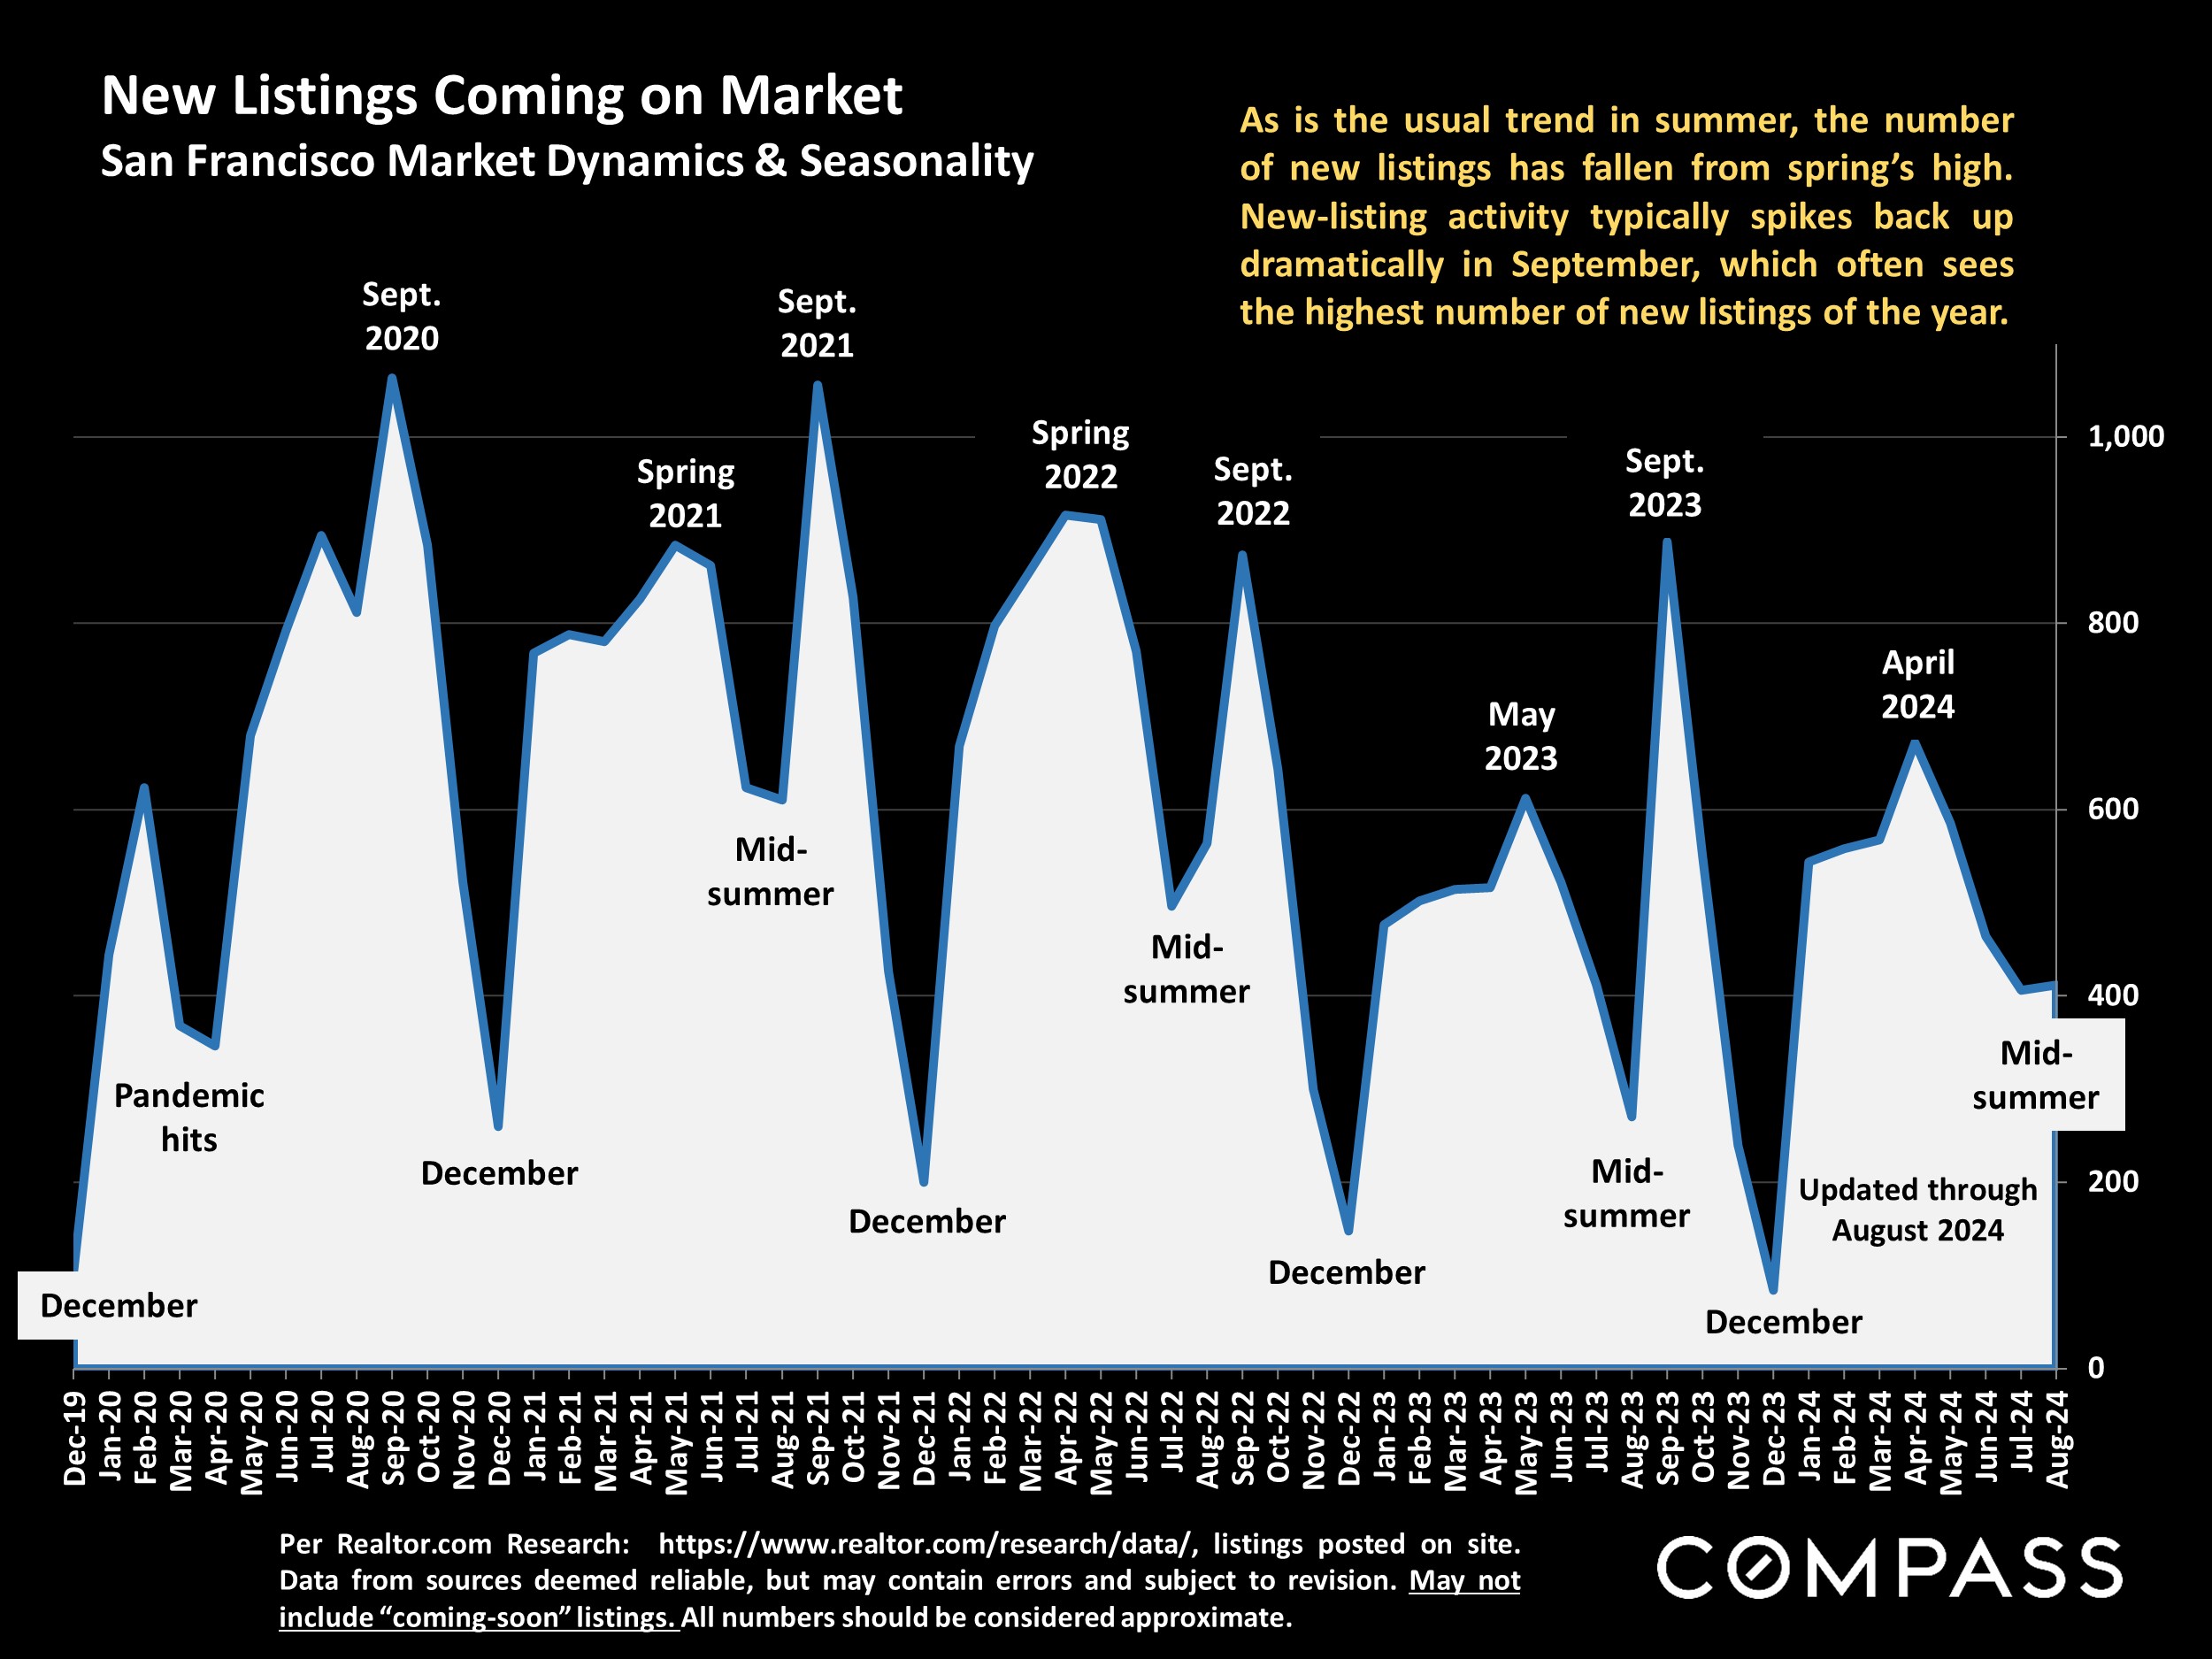
Chart of San Francisco new listings from December 2019 to August 2024, showing seasonal peaks and summer slowdowns.

San Francisco active and coming-soon listings by month, February 2022–September 2024, shown as a mint-green bar chart.

Chart of San Francisco monthly home sales from January 2020 to August 2024, with seasonal annotations and 2024 comparisons.

Chart of San Francisco $5 million-plus house sales from 2018 to 2024, with monthly bars and seasonal sales notes.

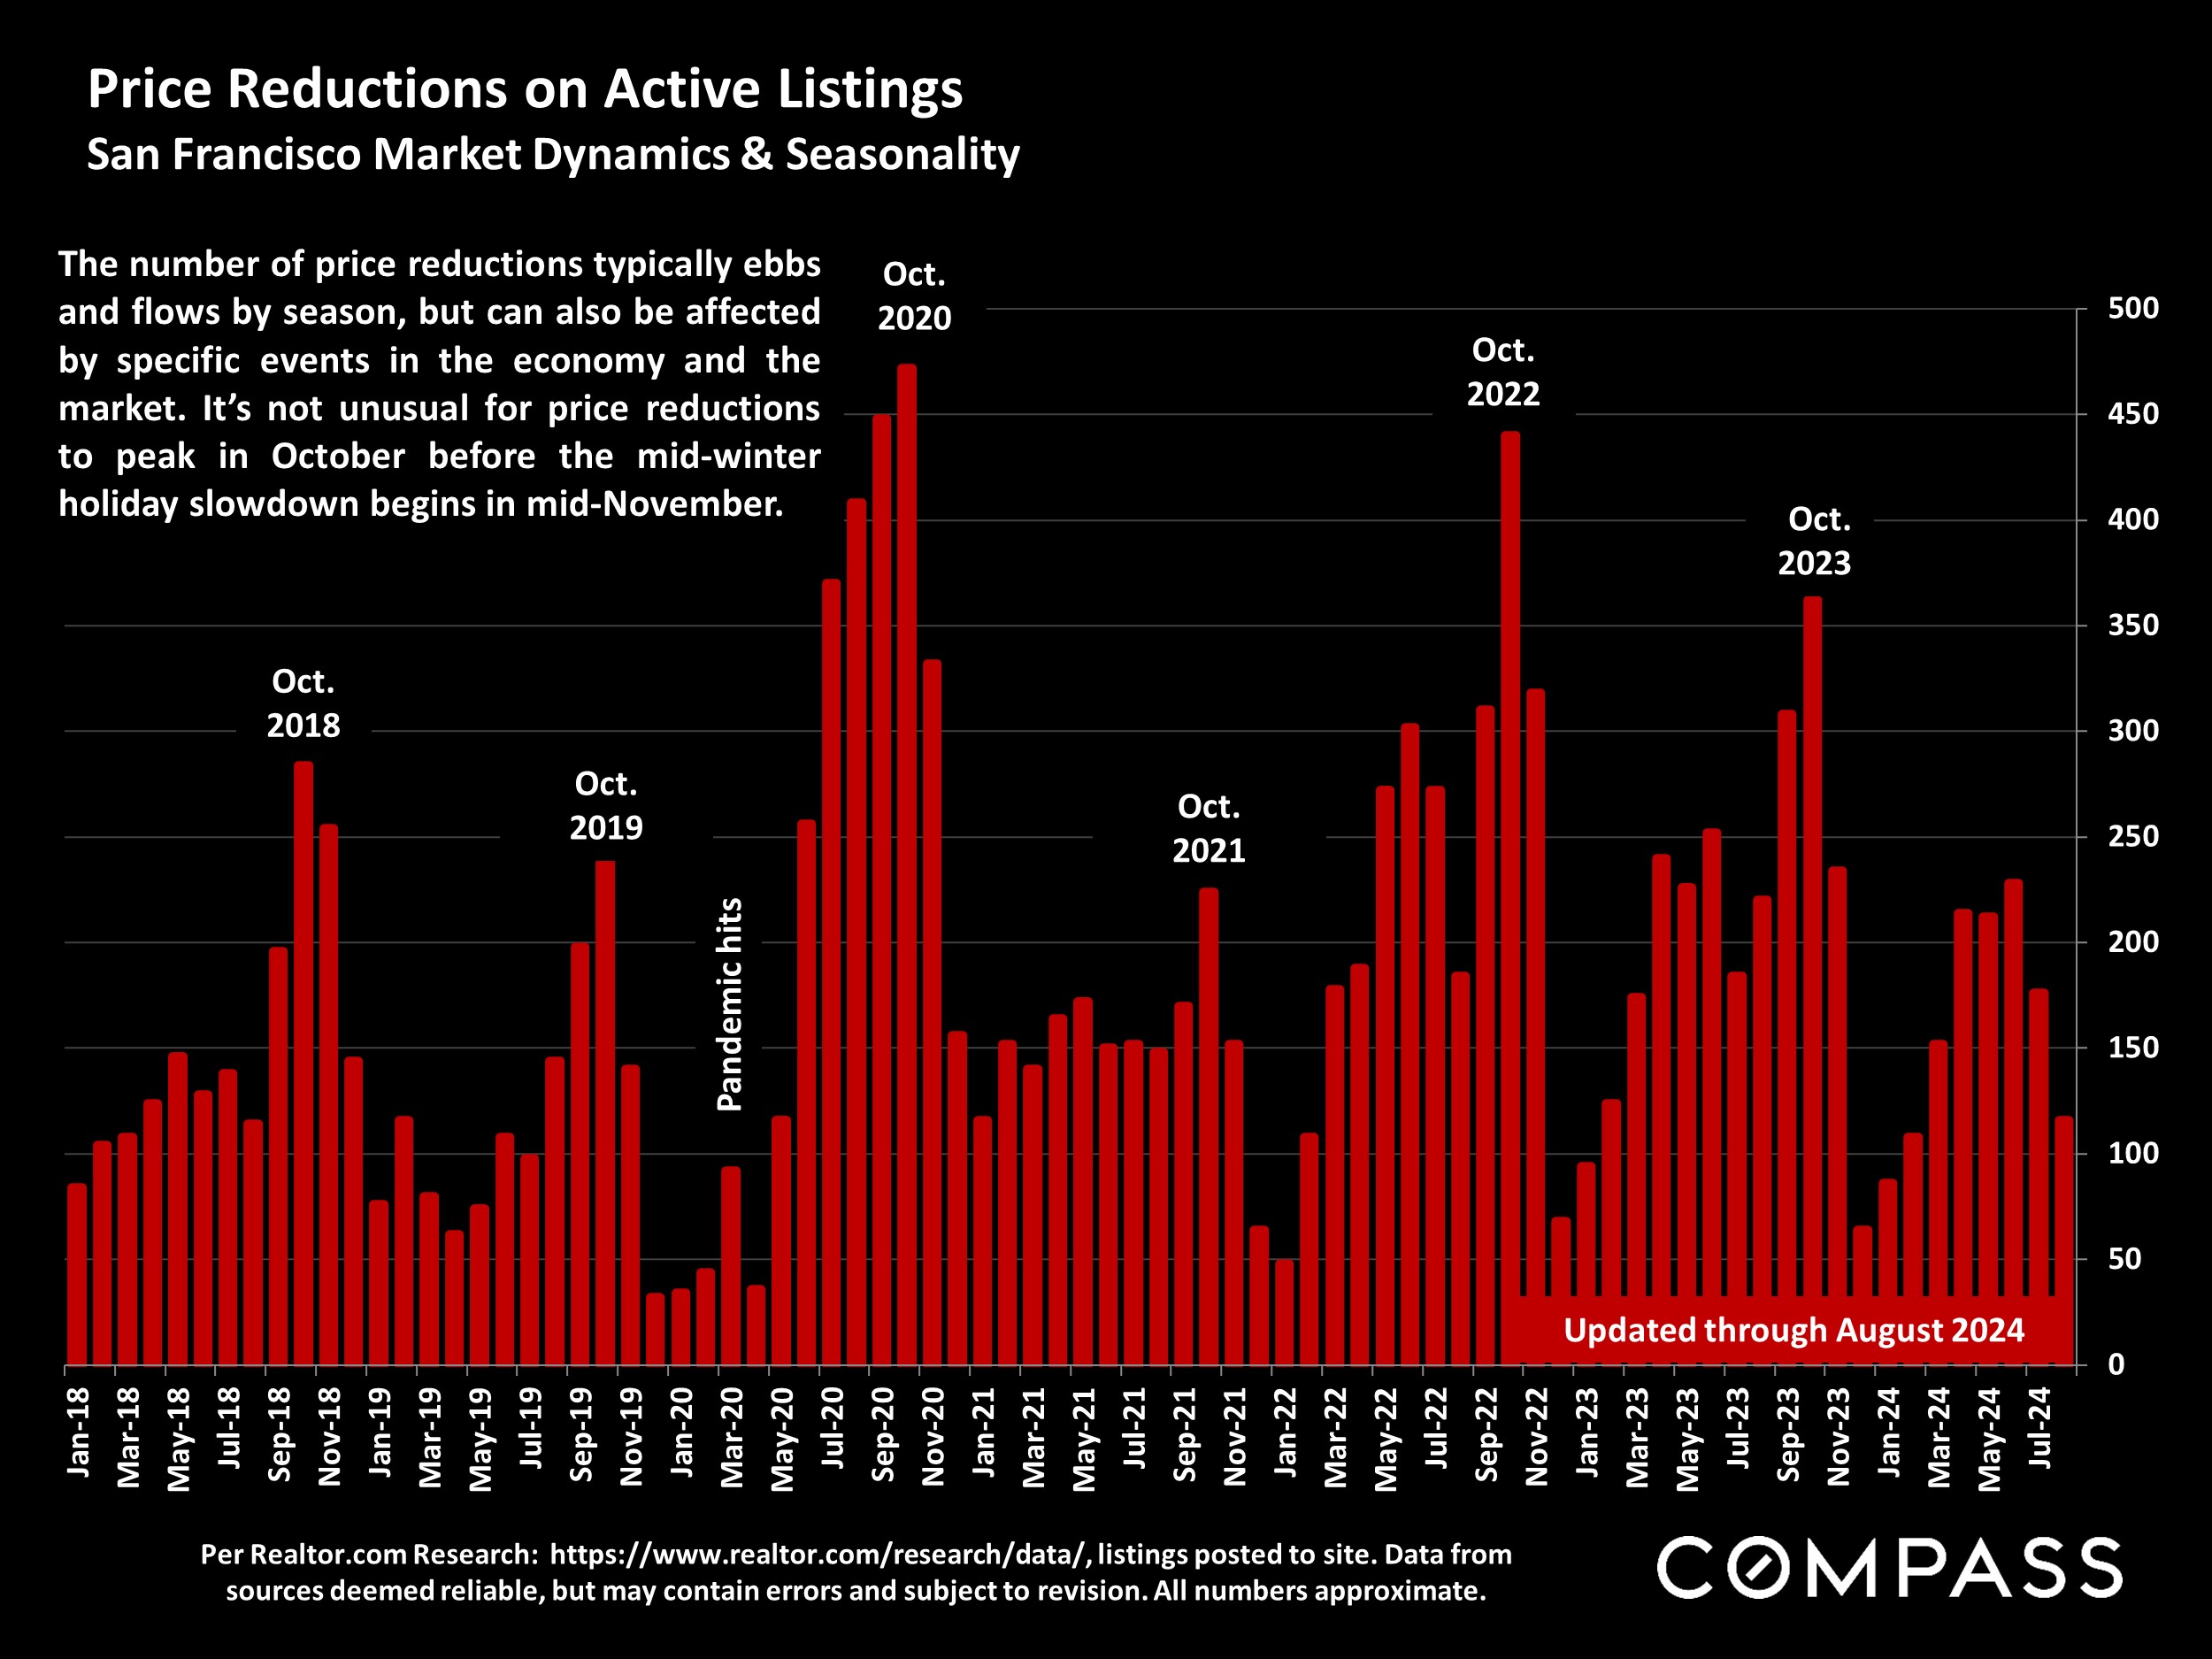
San Francisco active listing price reductions, charted monthly from 2018 to 2024 with October peaks.


Source: Compass

Work With Jason

Drawing on his decade of experience in finance, investment management, and holistic financial planning, and as a Chartered Financial Analyst ( CFA ® ) charterholder, he leverages his financial acumen and analytical focus to help his clients navigate the sophisticated San Francisco market.
Contact
Follow Us