San Francisco Real Estate Market Update | September 2023

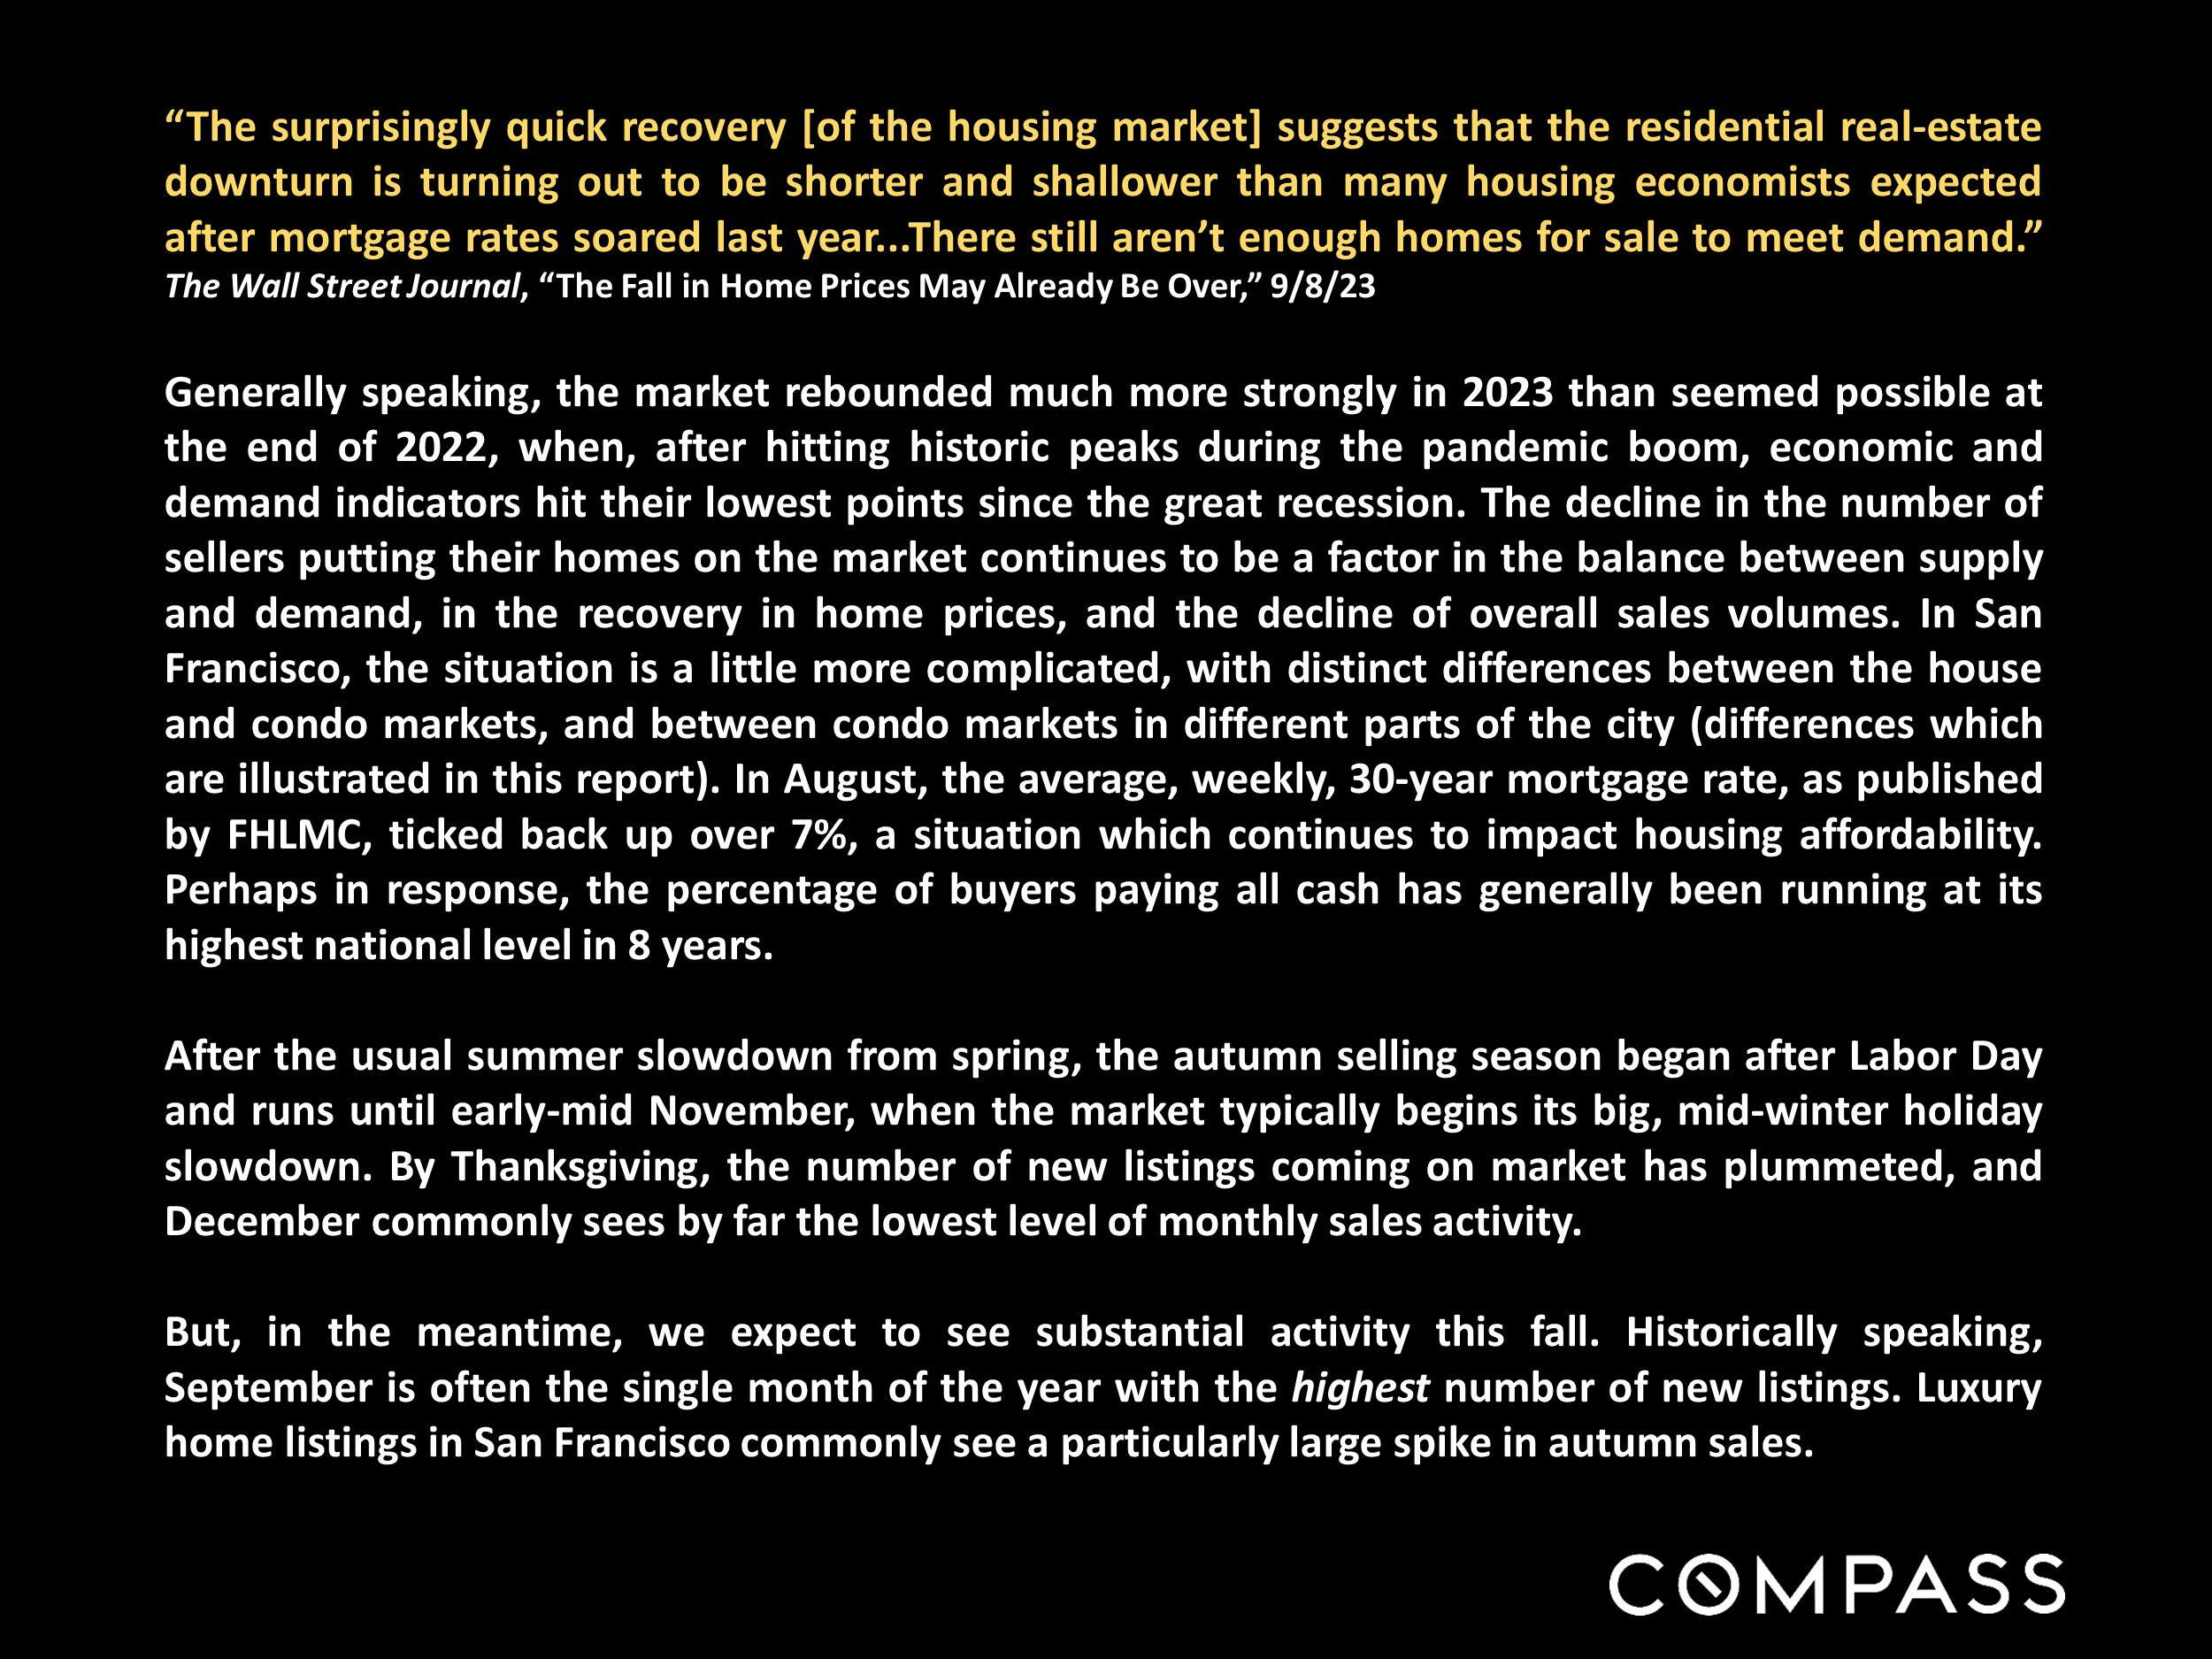
"The surprisingly quick recovery [of the housing market] suggests that the residential real-estate downturn is turning out to be shorter and shallower than many housing economists expected after mortgage rates soared last year..There still aren't enough homes for sale to meet demand."

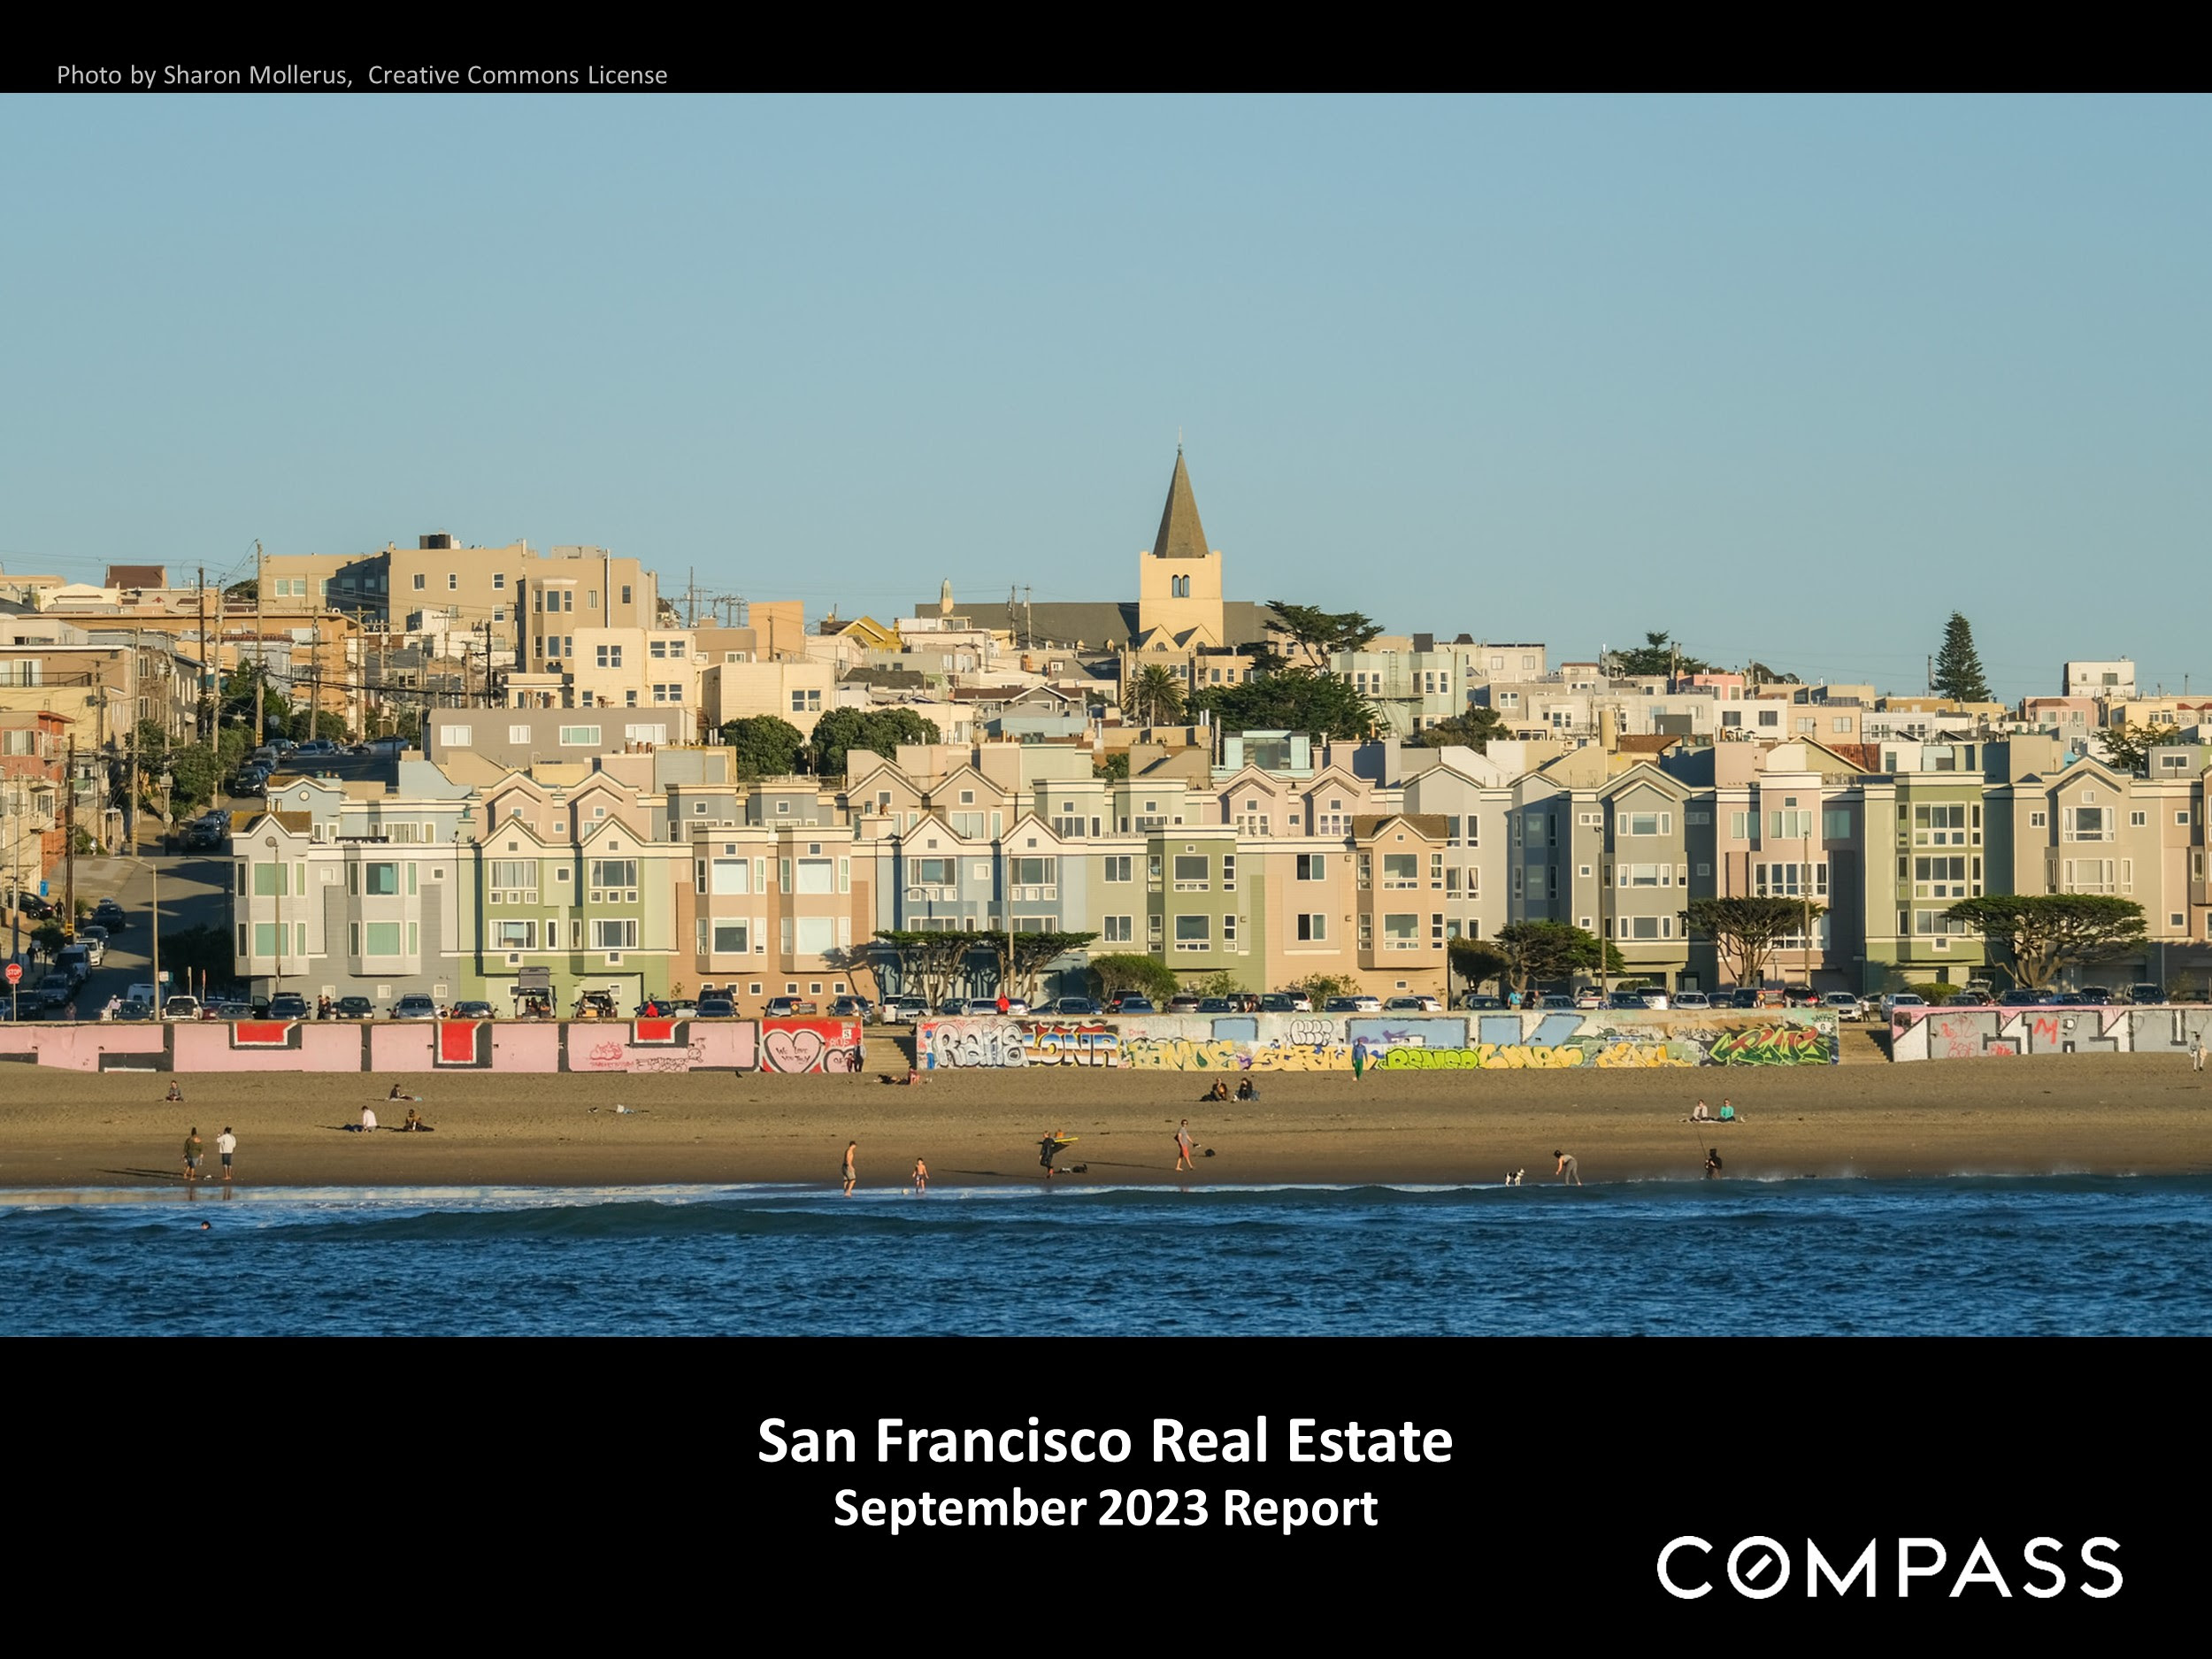
September 2023 San Francisco real estate report cover featuring beachside homes and the COMPASS name.

San Francisco real estate market report discussing the 2023 rebound, autumn listings, and luxury home sales.

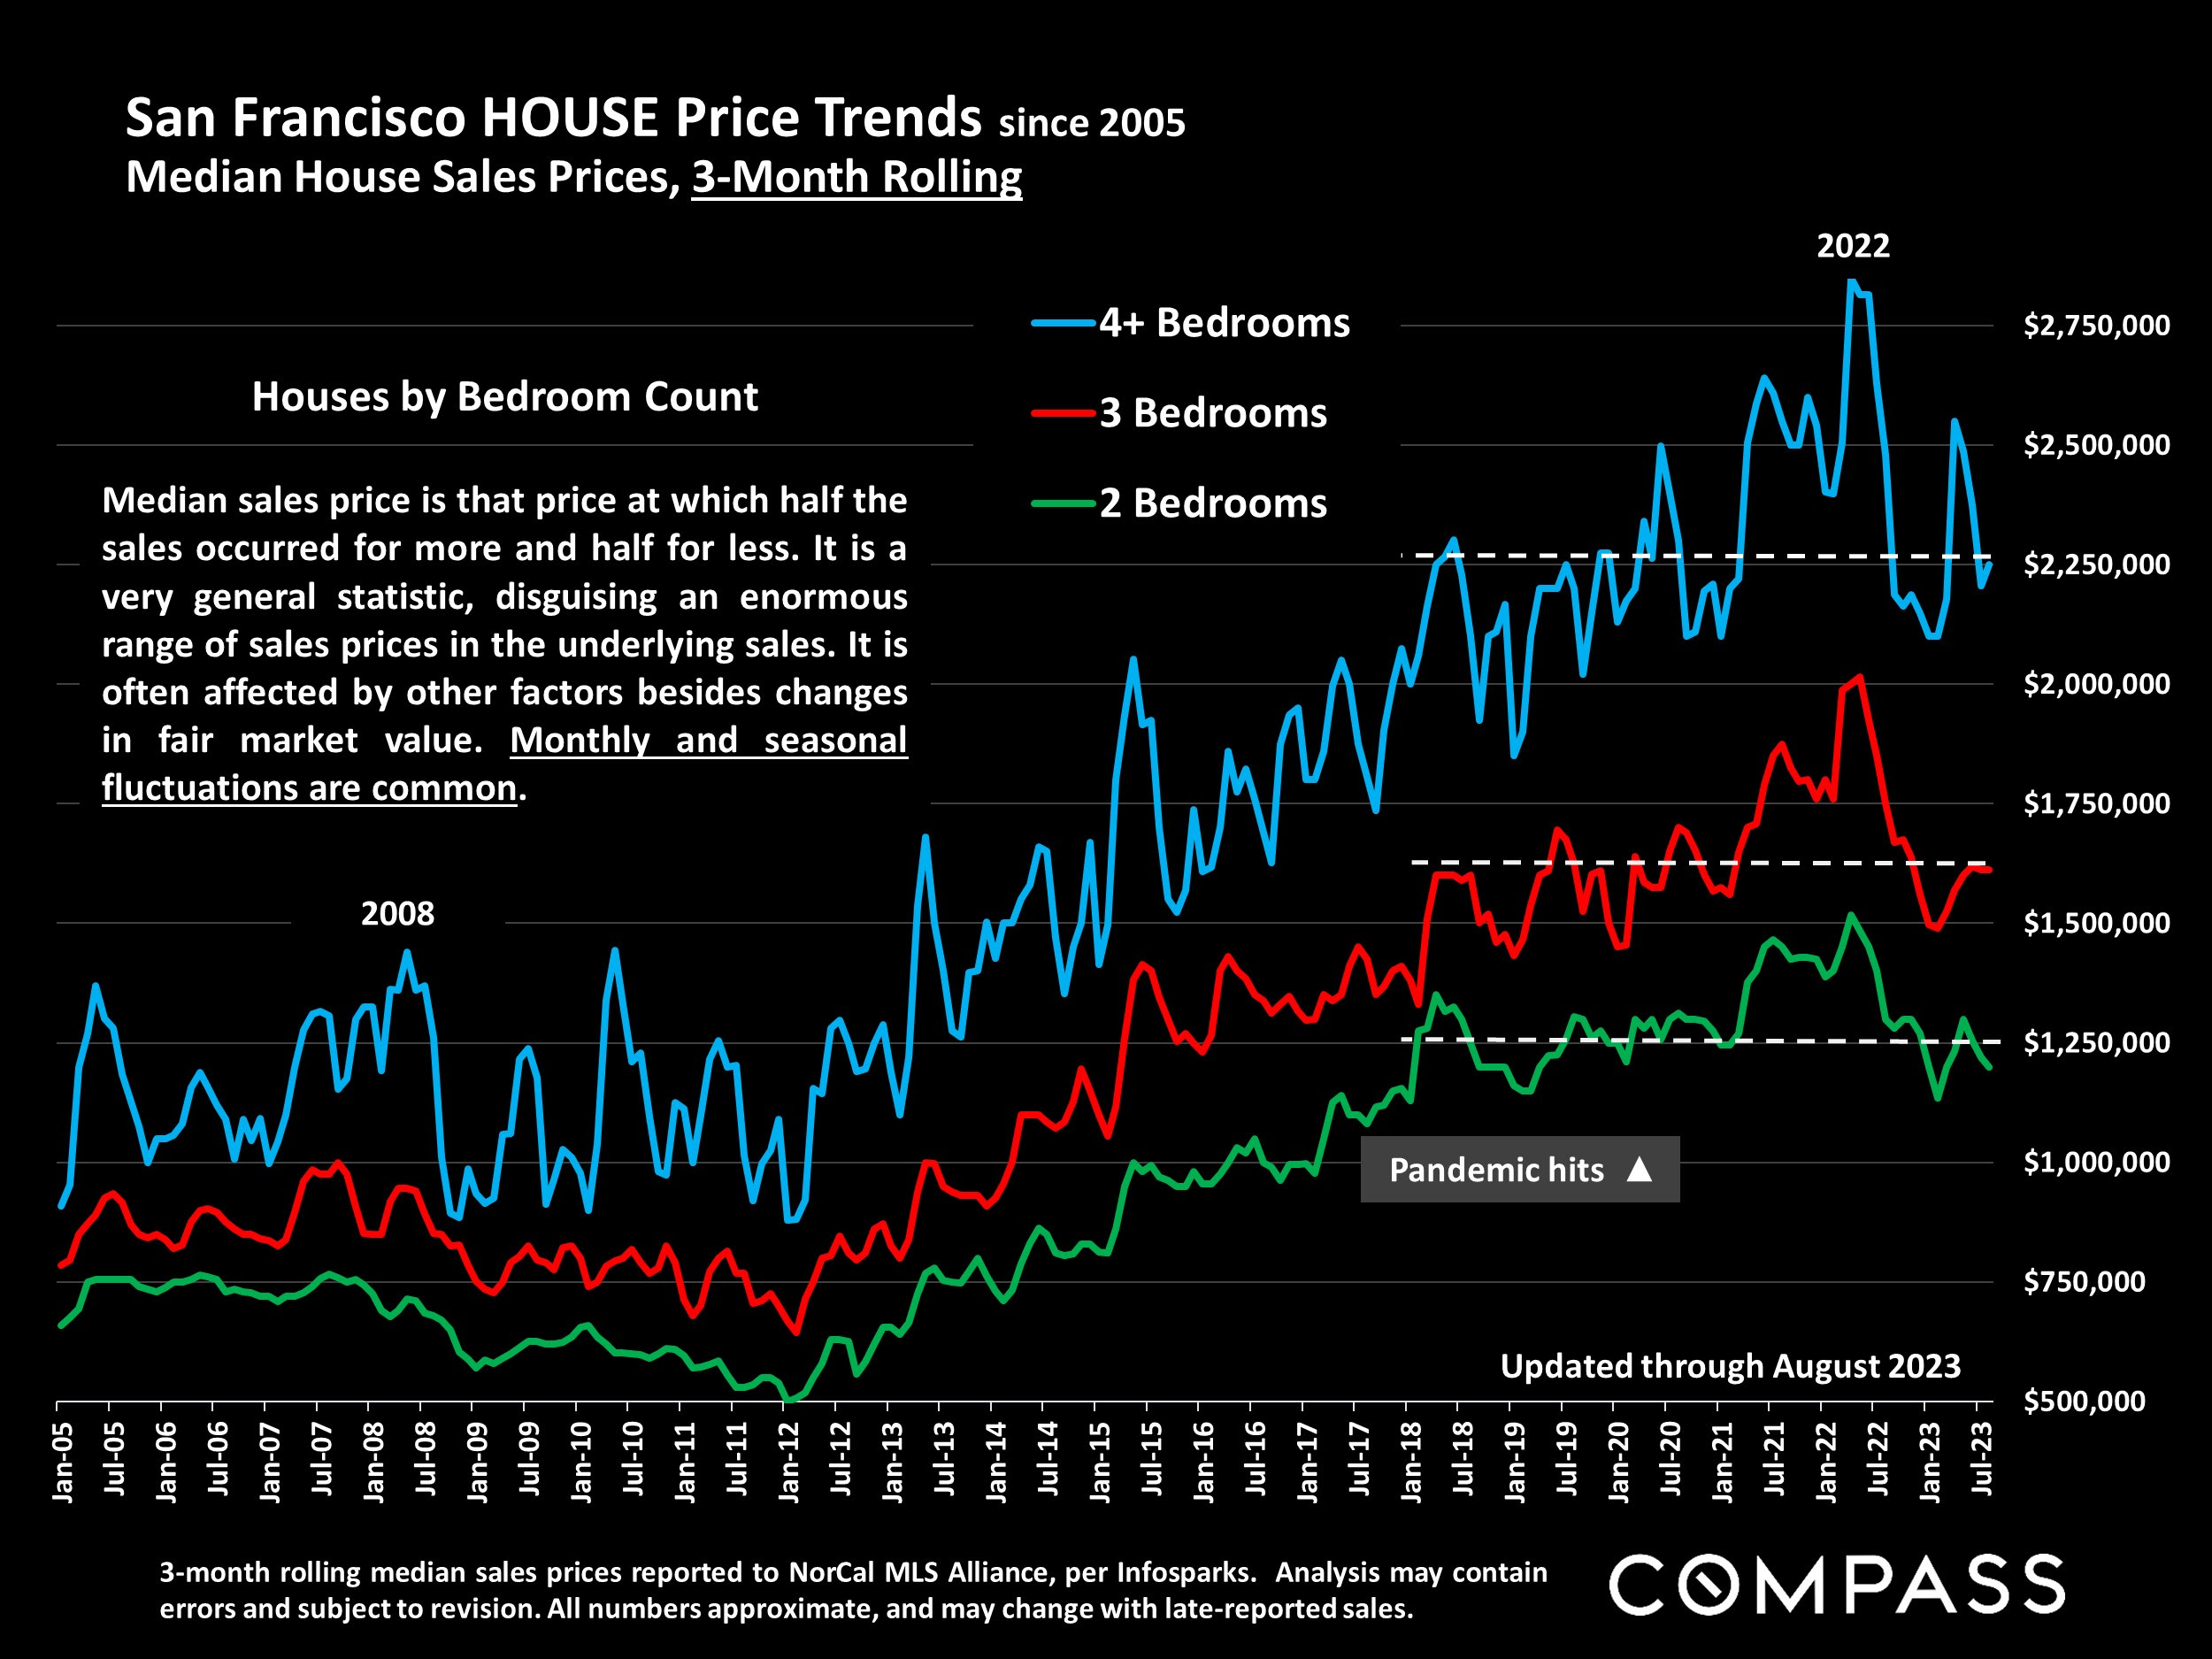
Chart of San Francisco median house prices by bedroom count, 2005–2023, with 4+ bedroom prices highest.

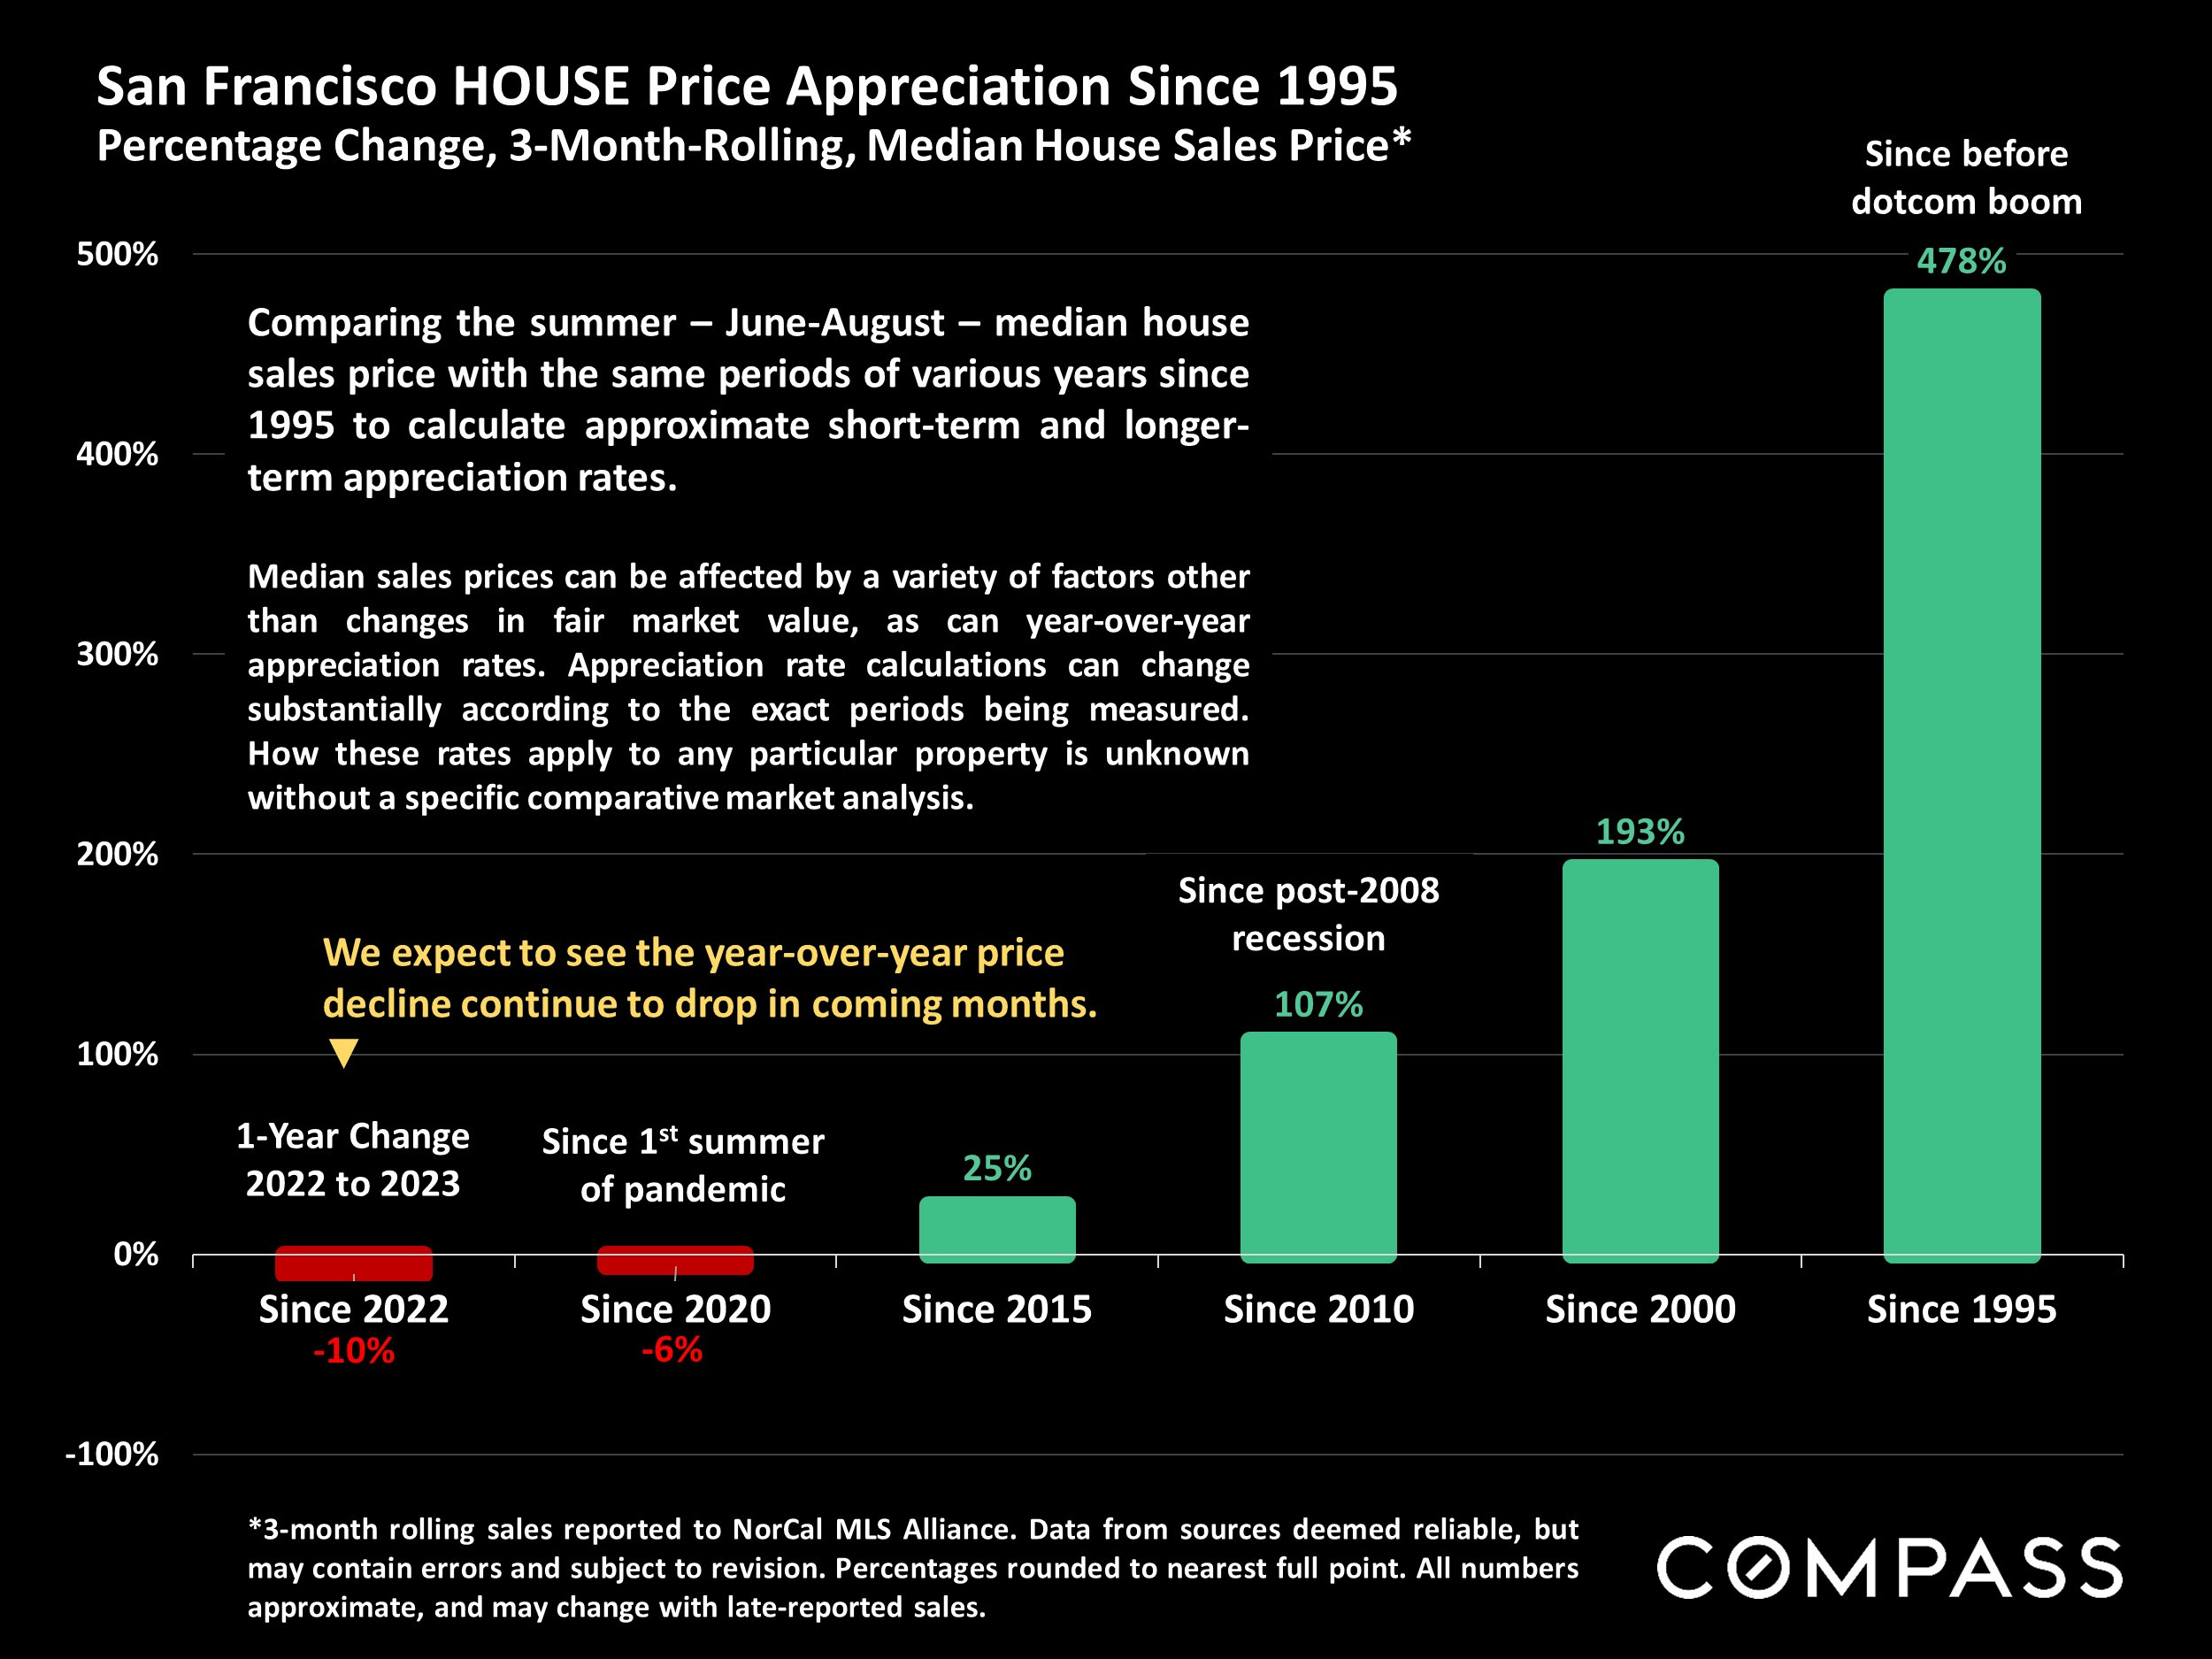
Chart of San Francisco house price appreciation since 1995, including recent declines and long-term gains.

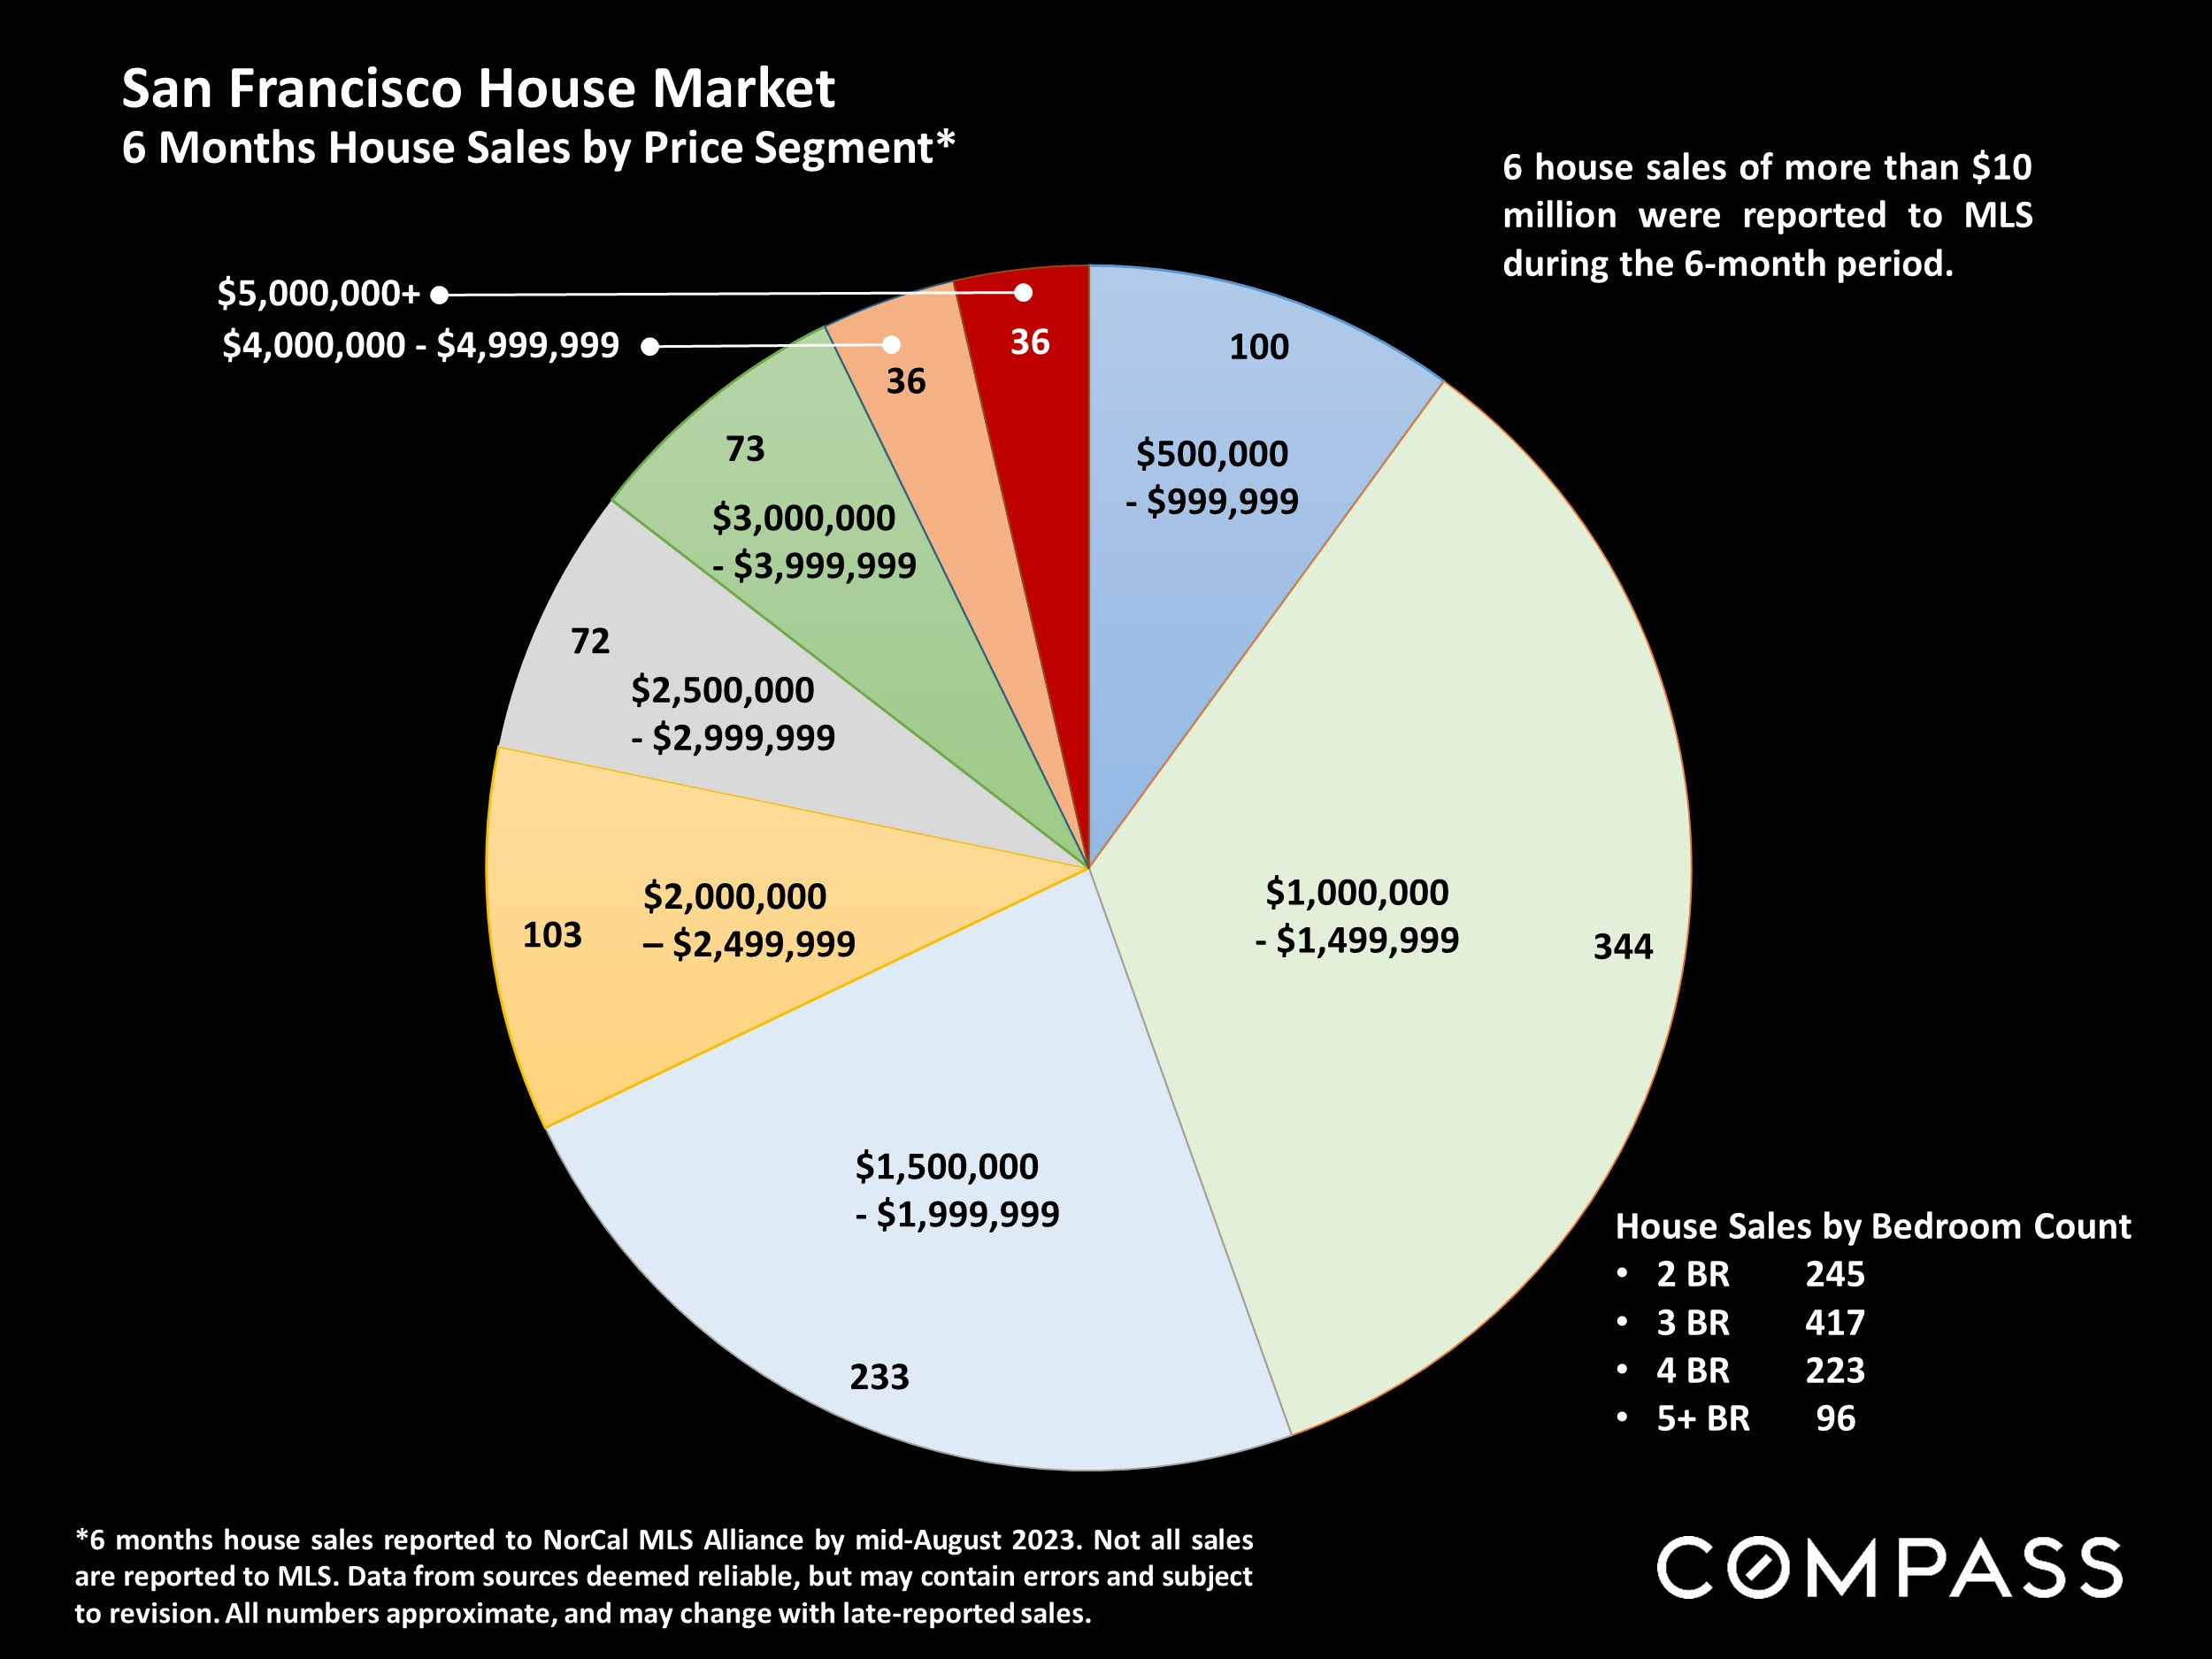
San Francisco six-month house sales infographic with price-segment pie chart and bedroom-count totals.

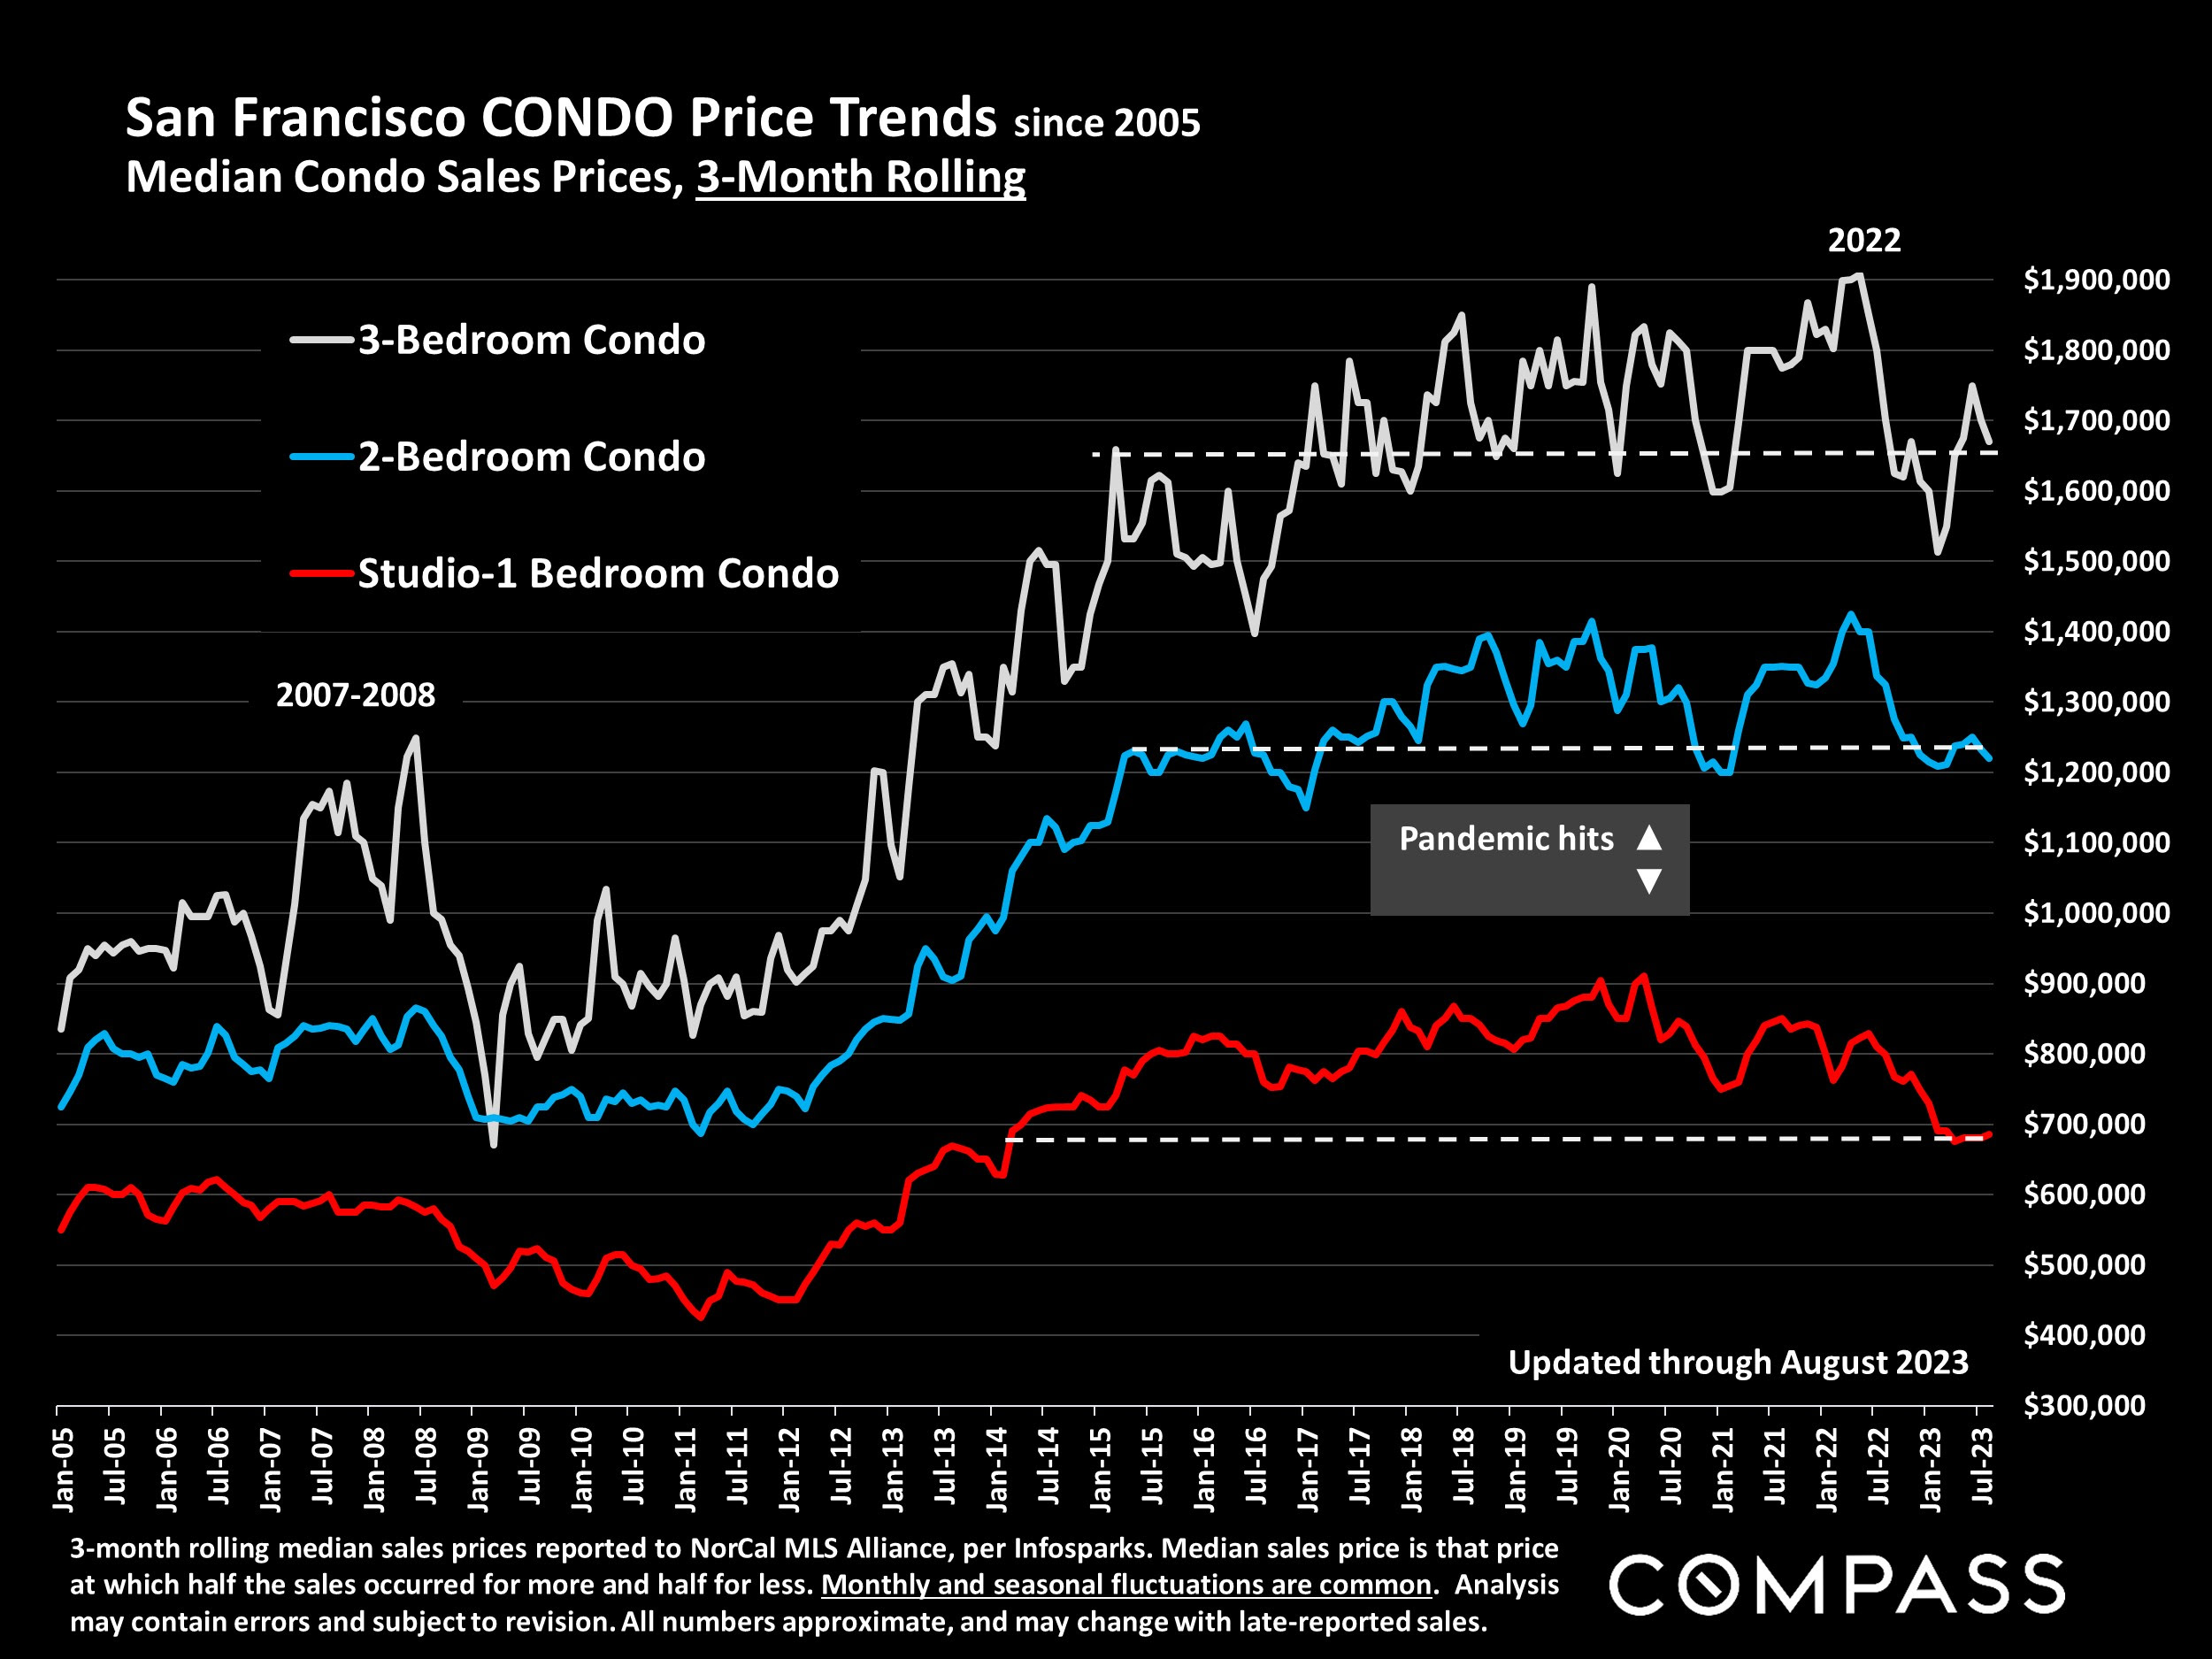
San Francisco condo price trends chart comparing three-bedroom, two-bedroom, and studio-to-one-bedroom sales from 2005 to 2023.

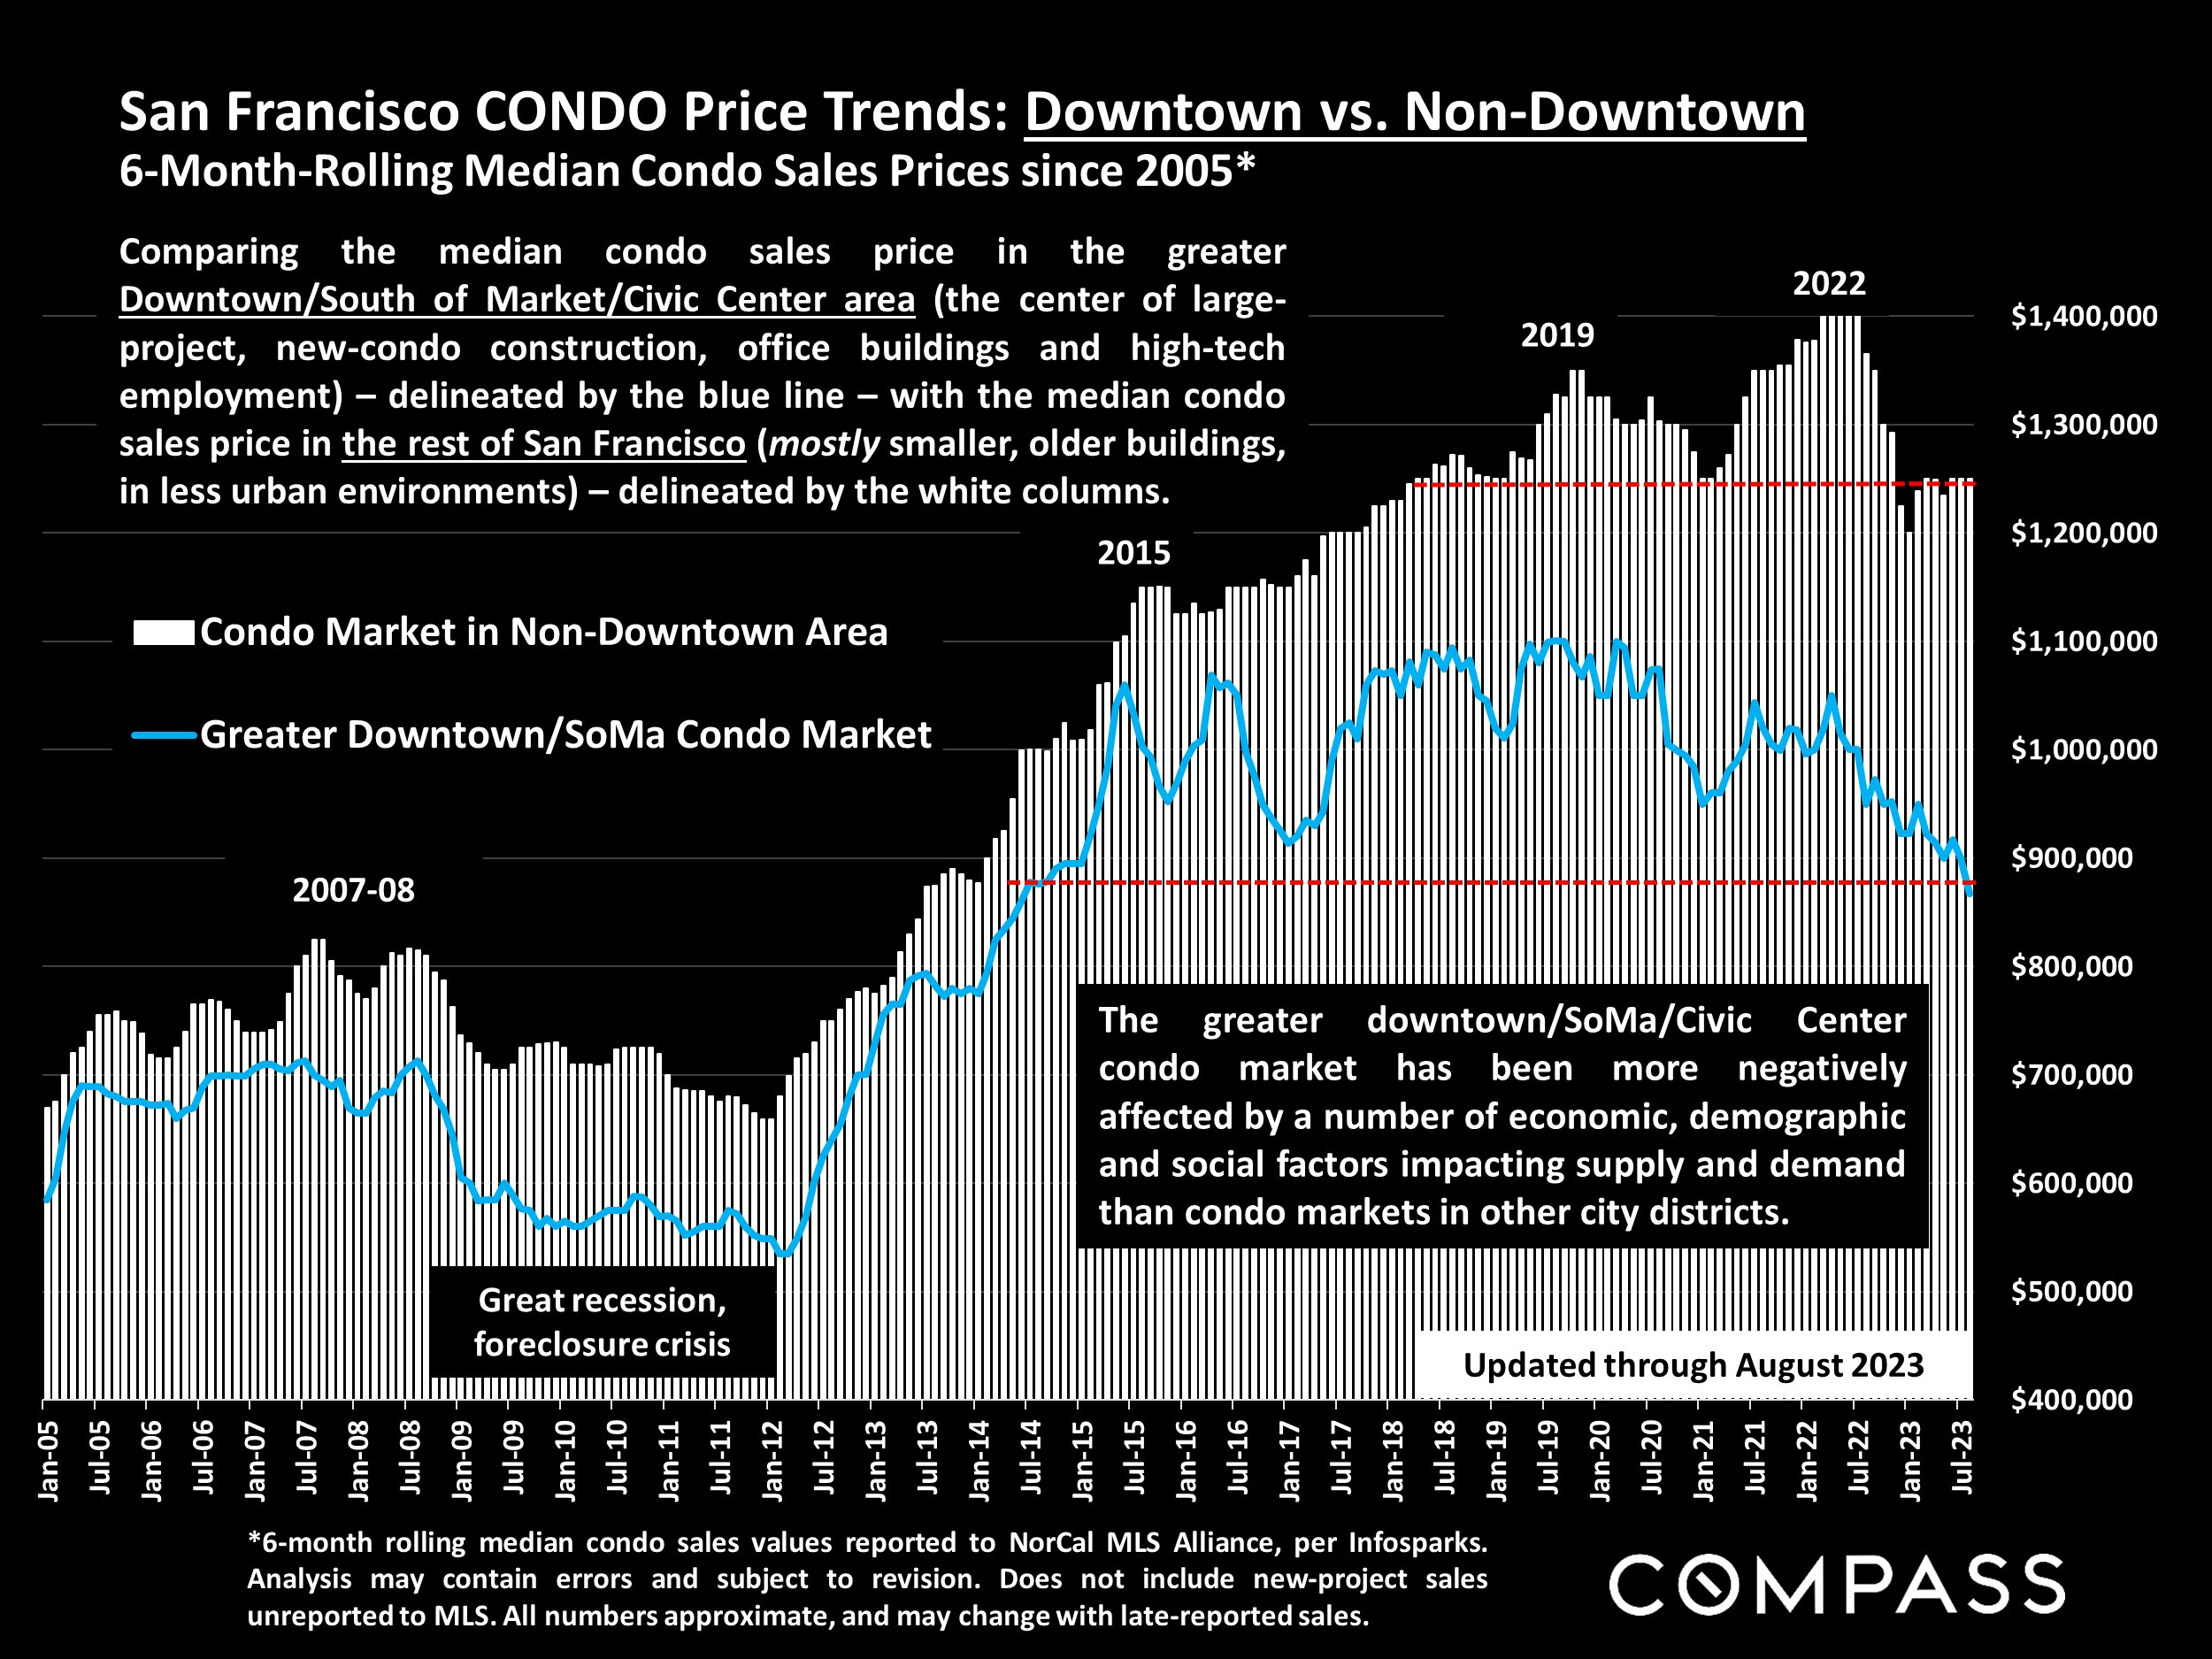
San Francisco condo price trends, 2005–2023: white bars compare non-downtown prices with the blue downtown price line.

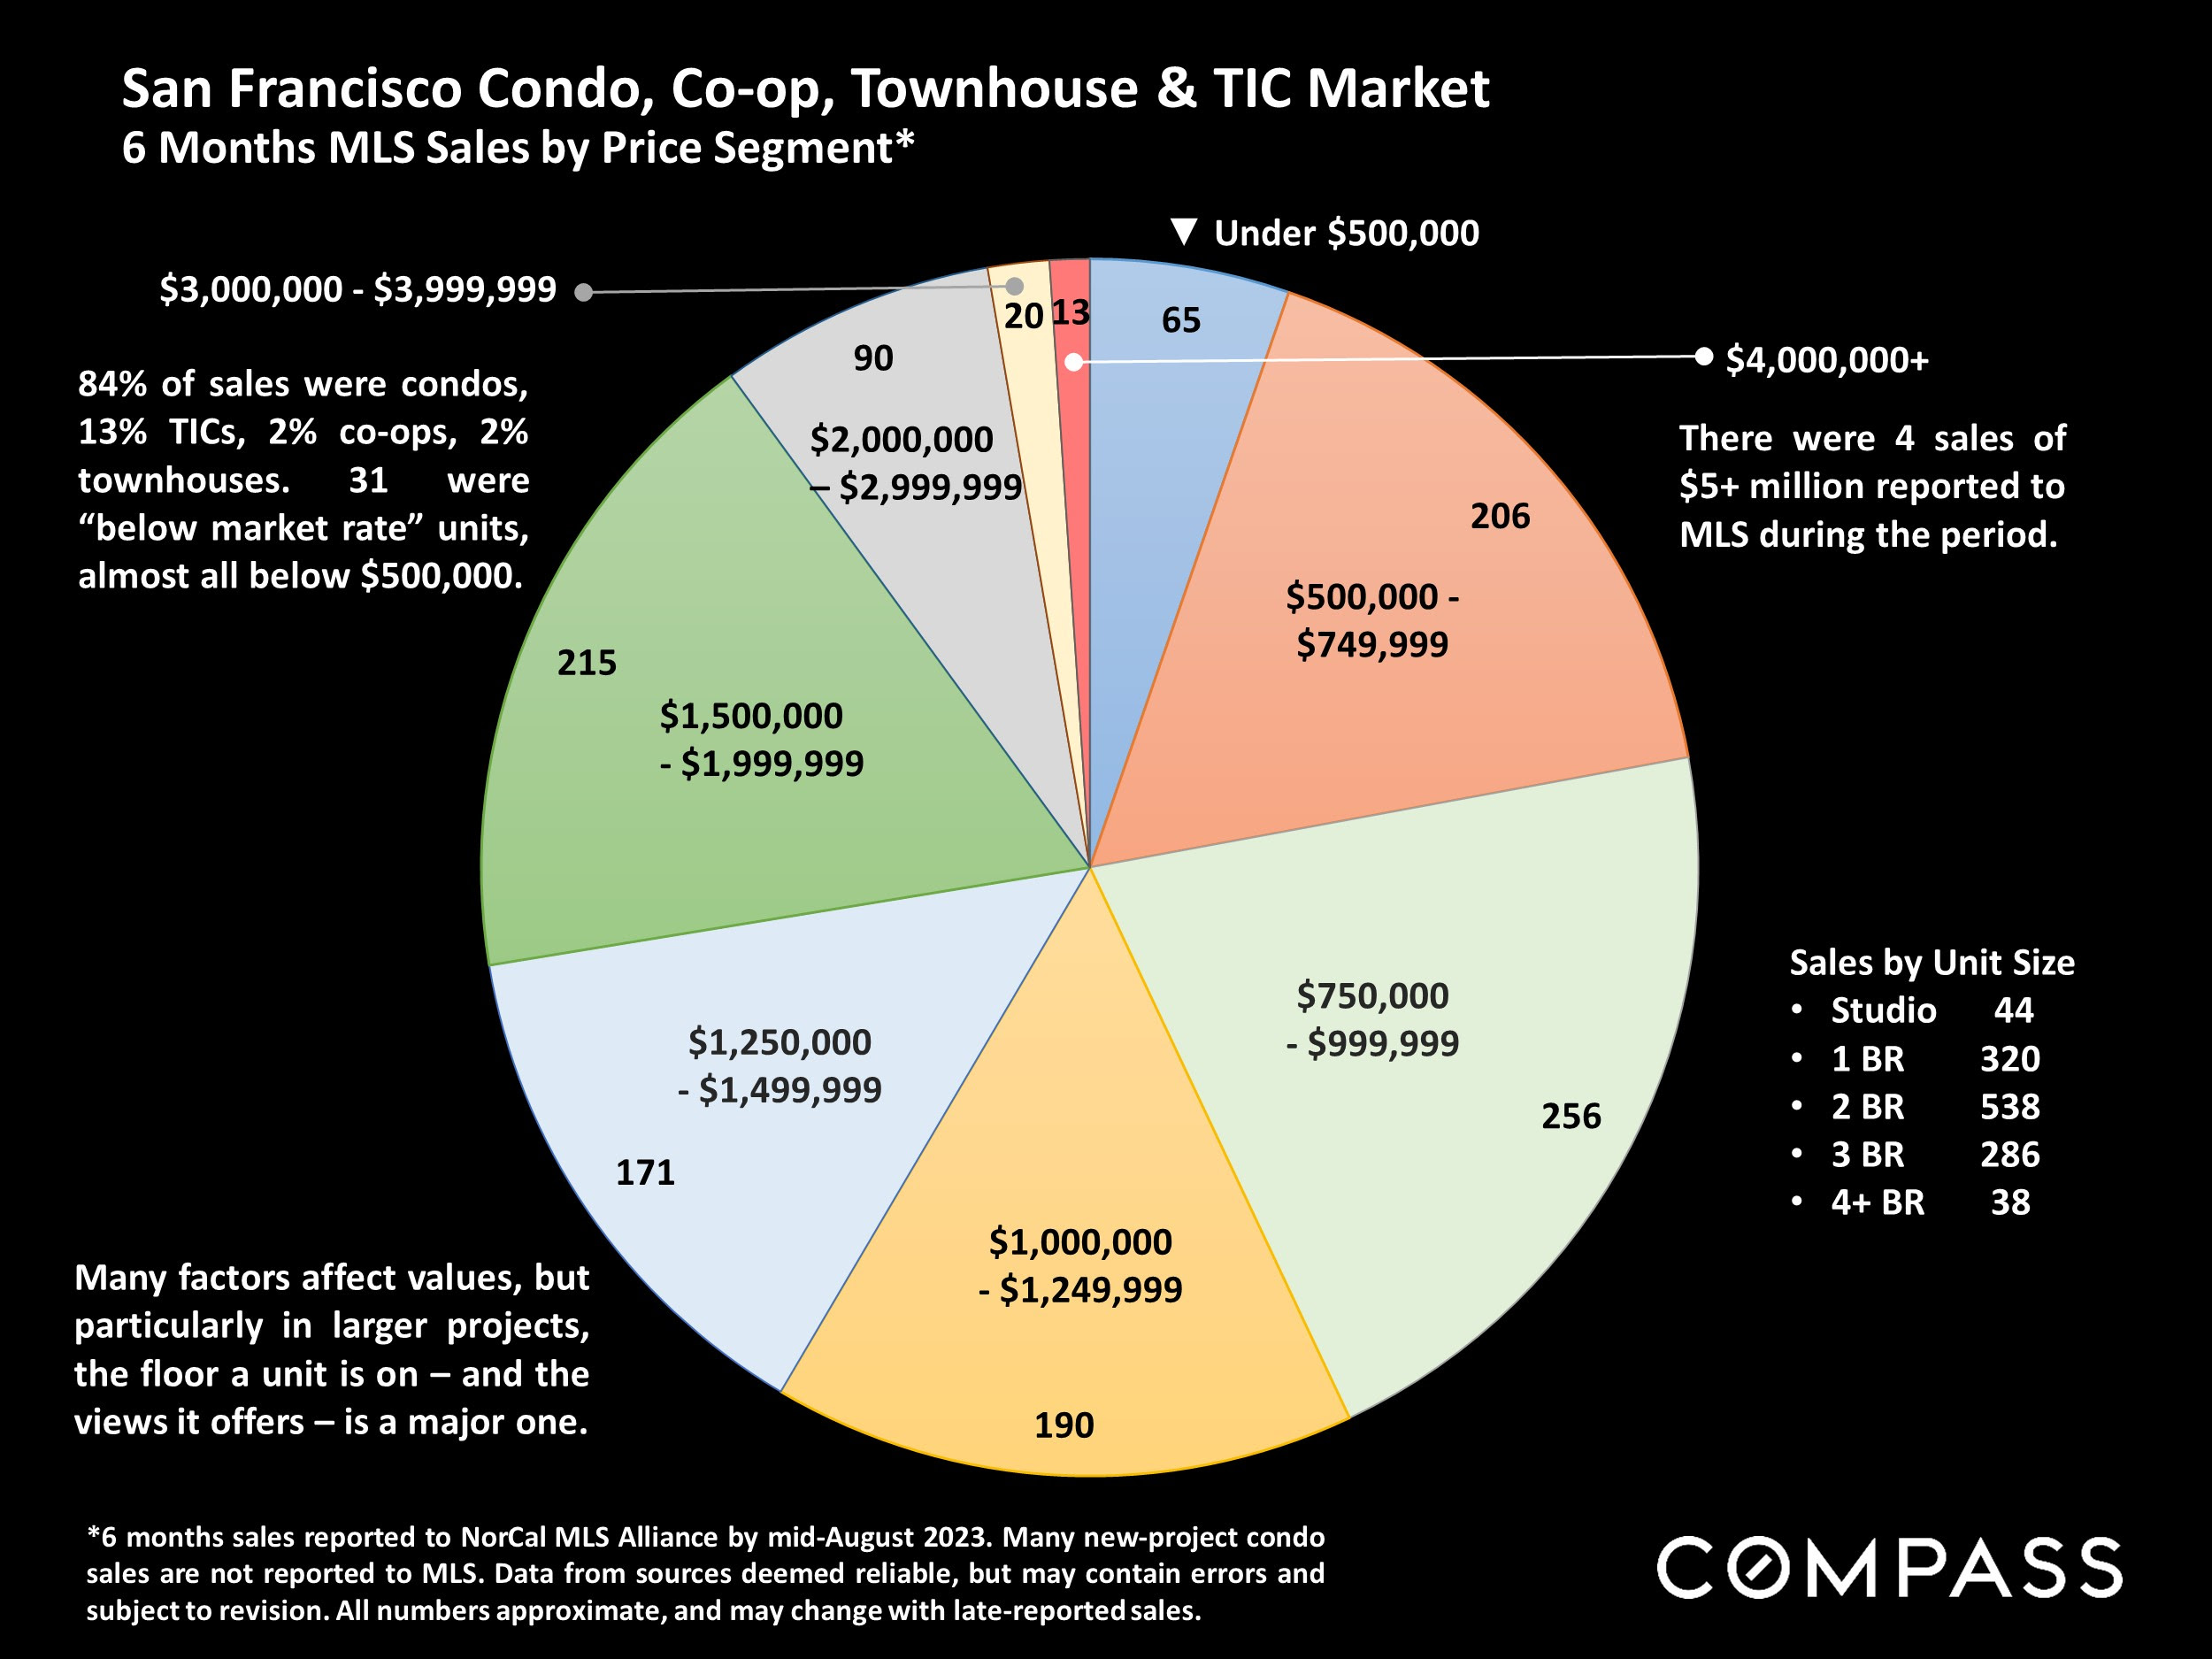
Infographic of San Francisco six-month home sales by price segment, with unit-size counts and market notes.

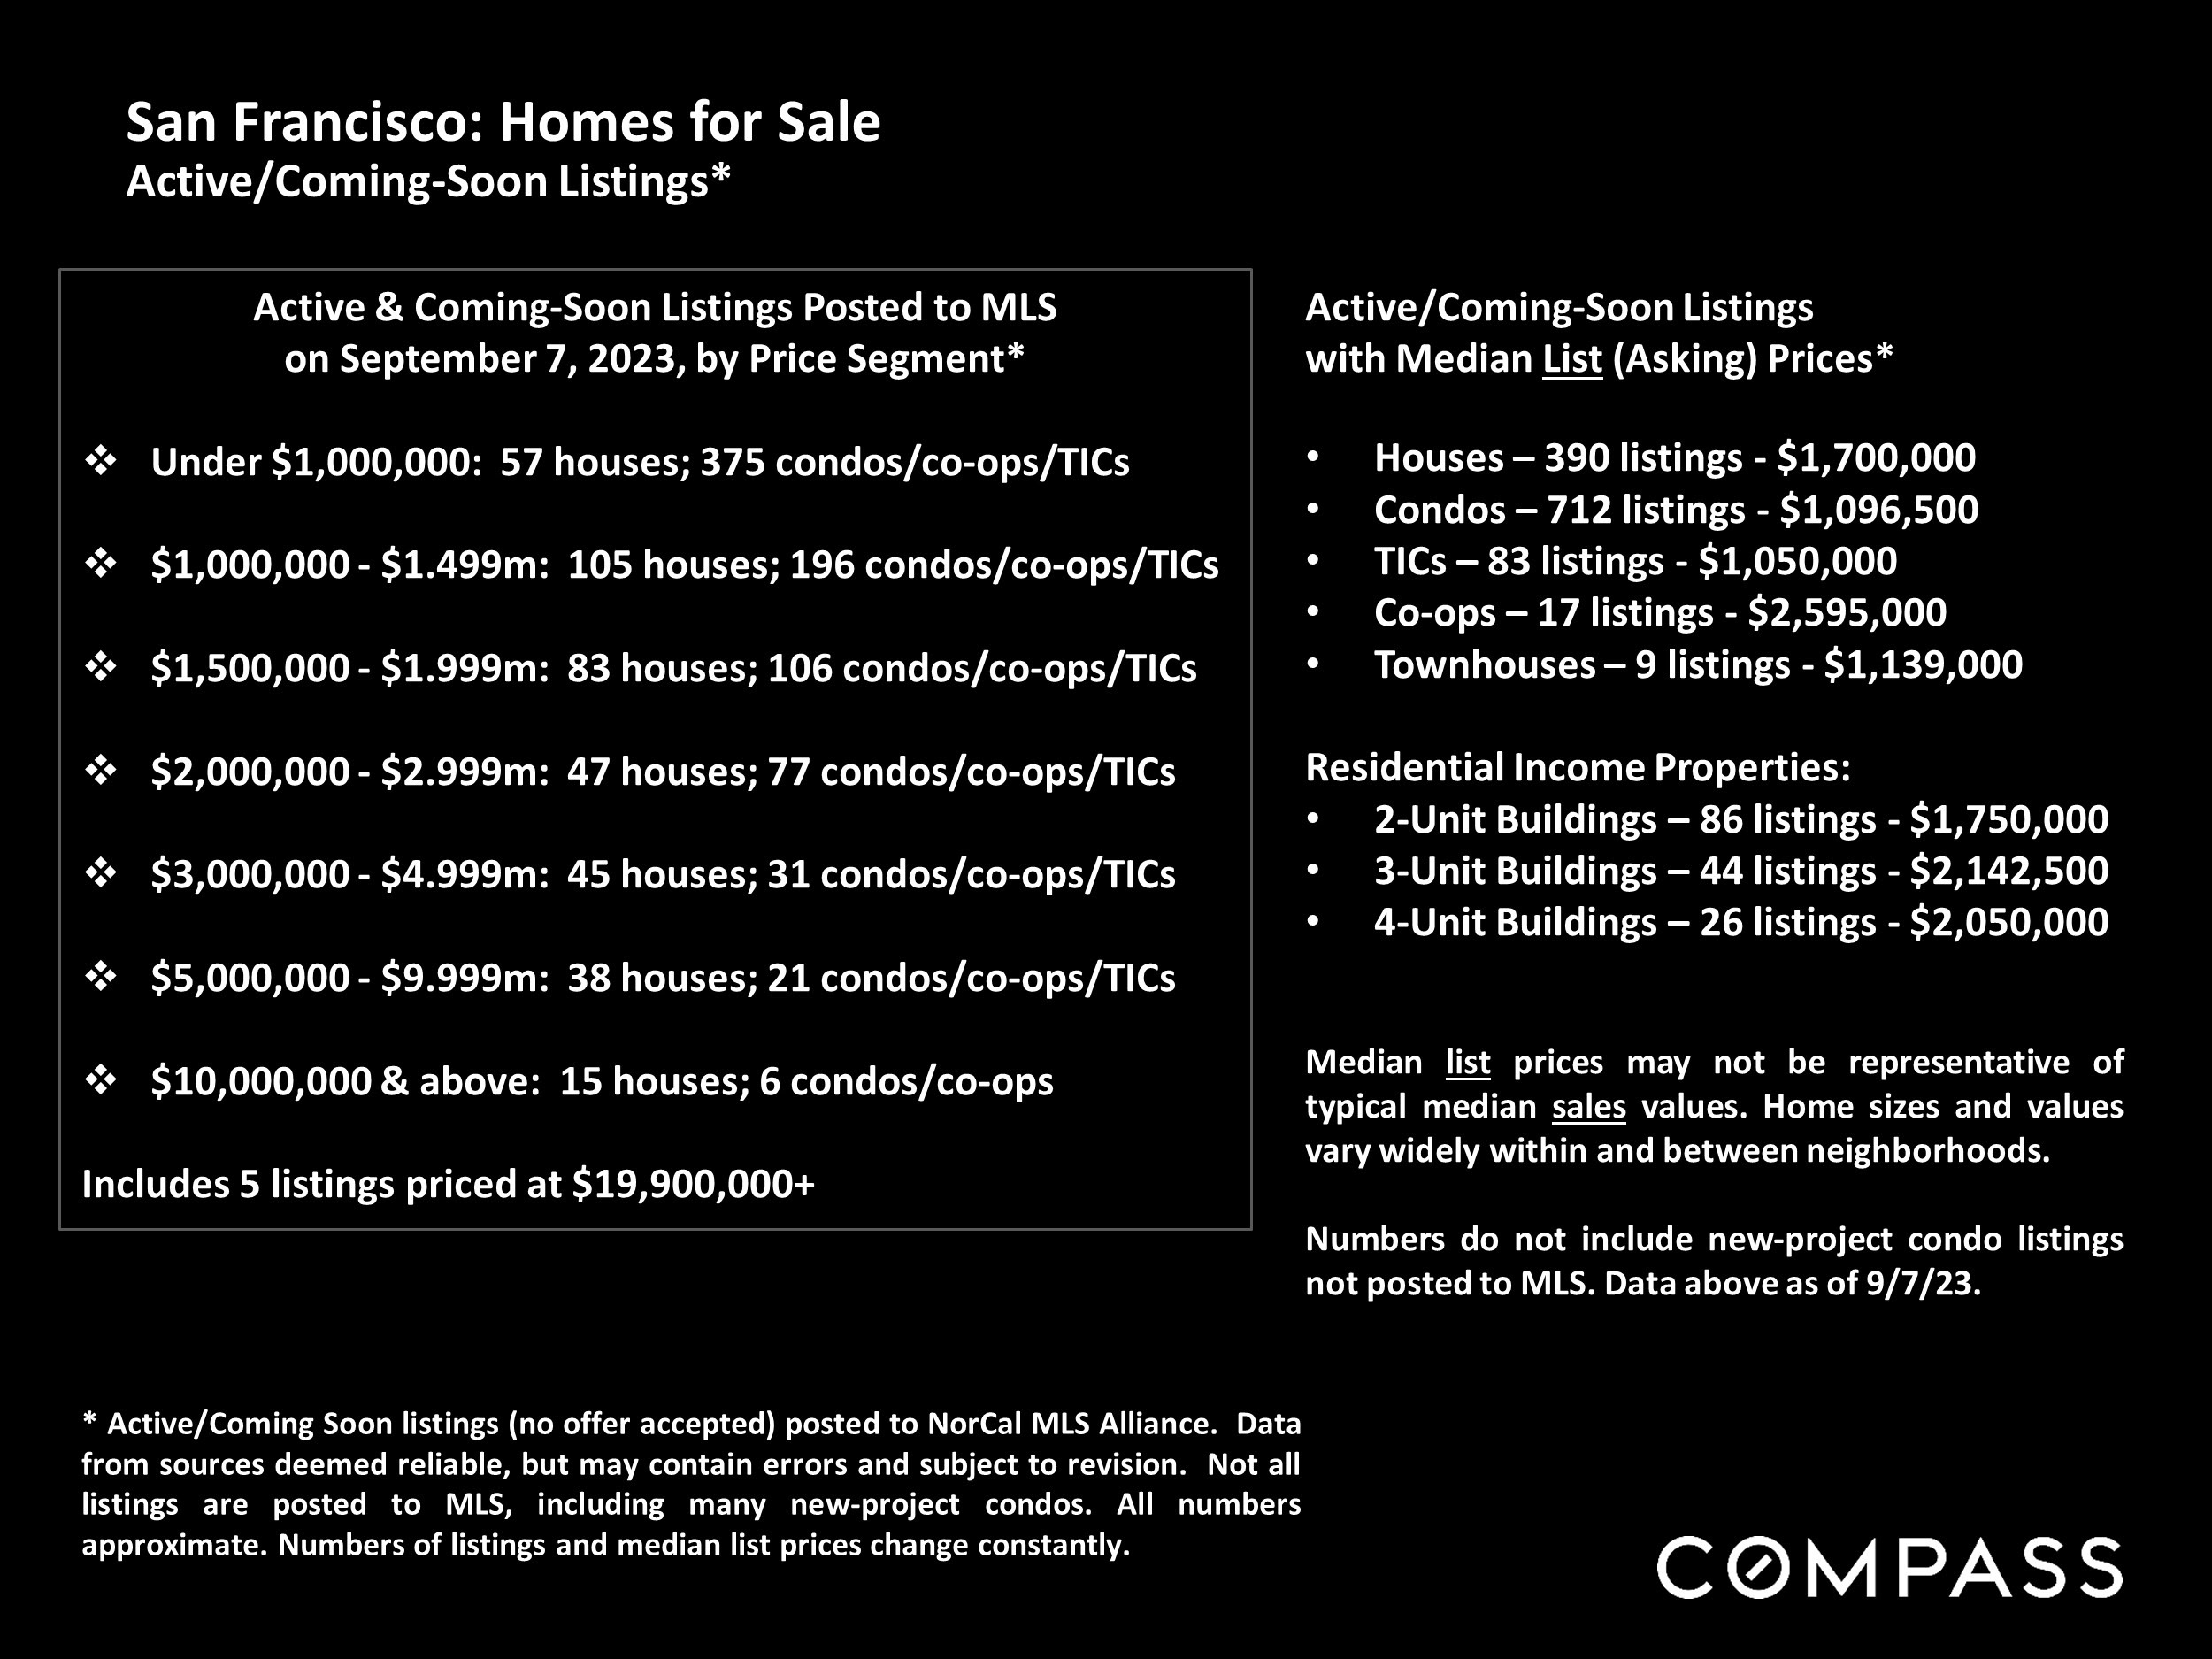
San Francisco September 2023 listing counts by price segment and median asking prices by property type.

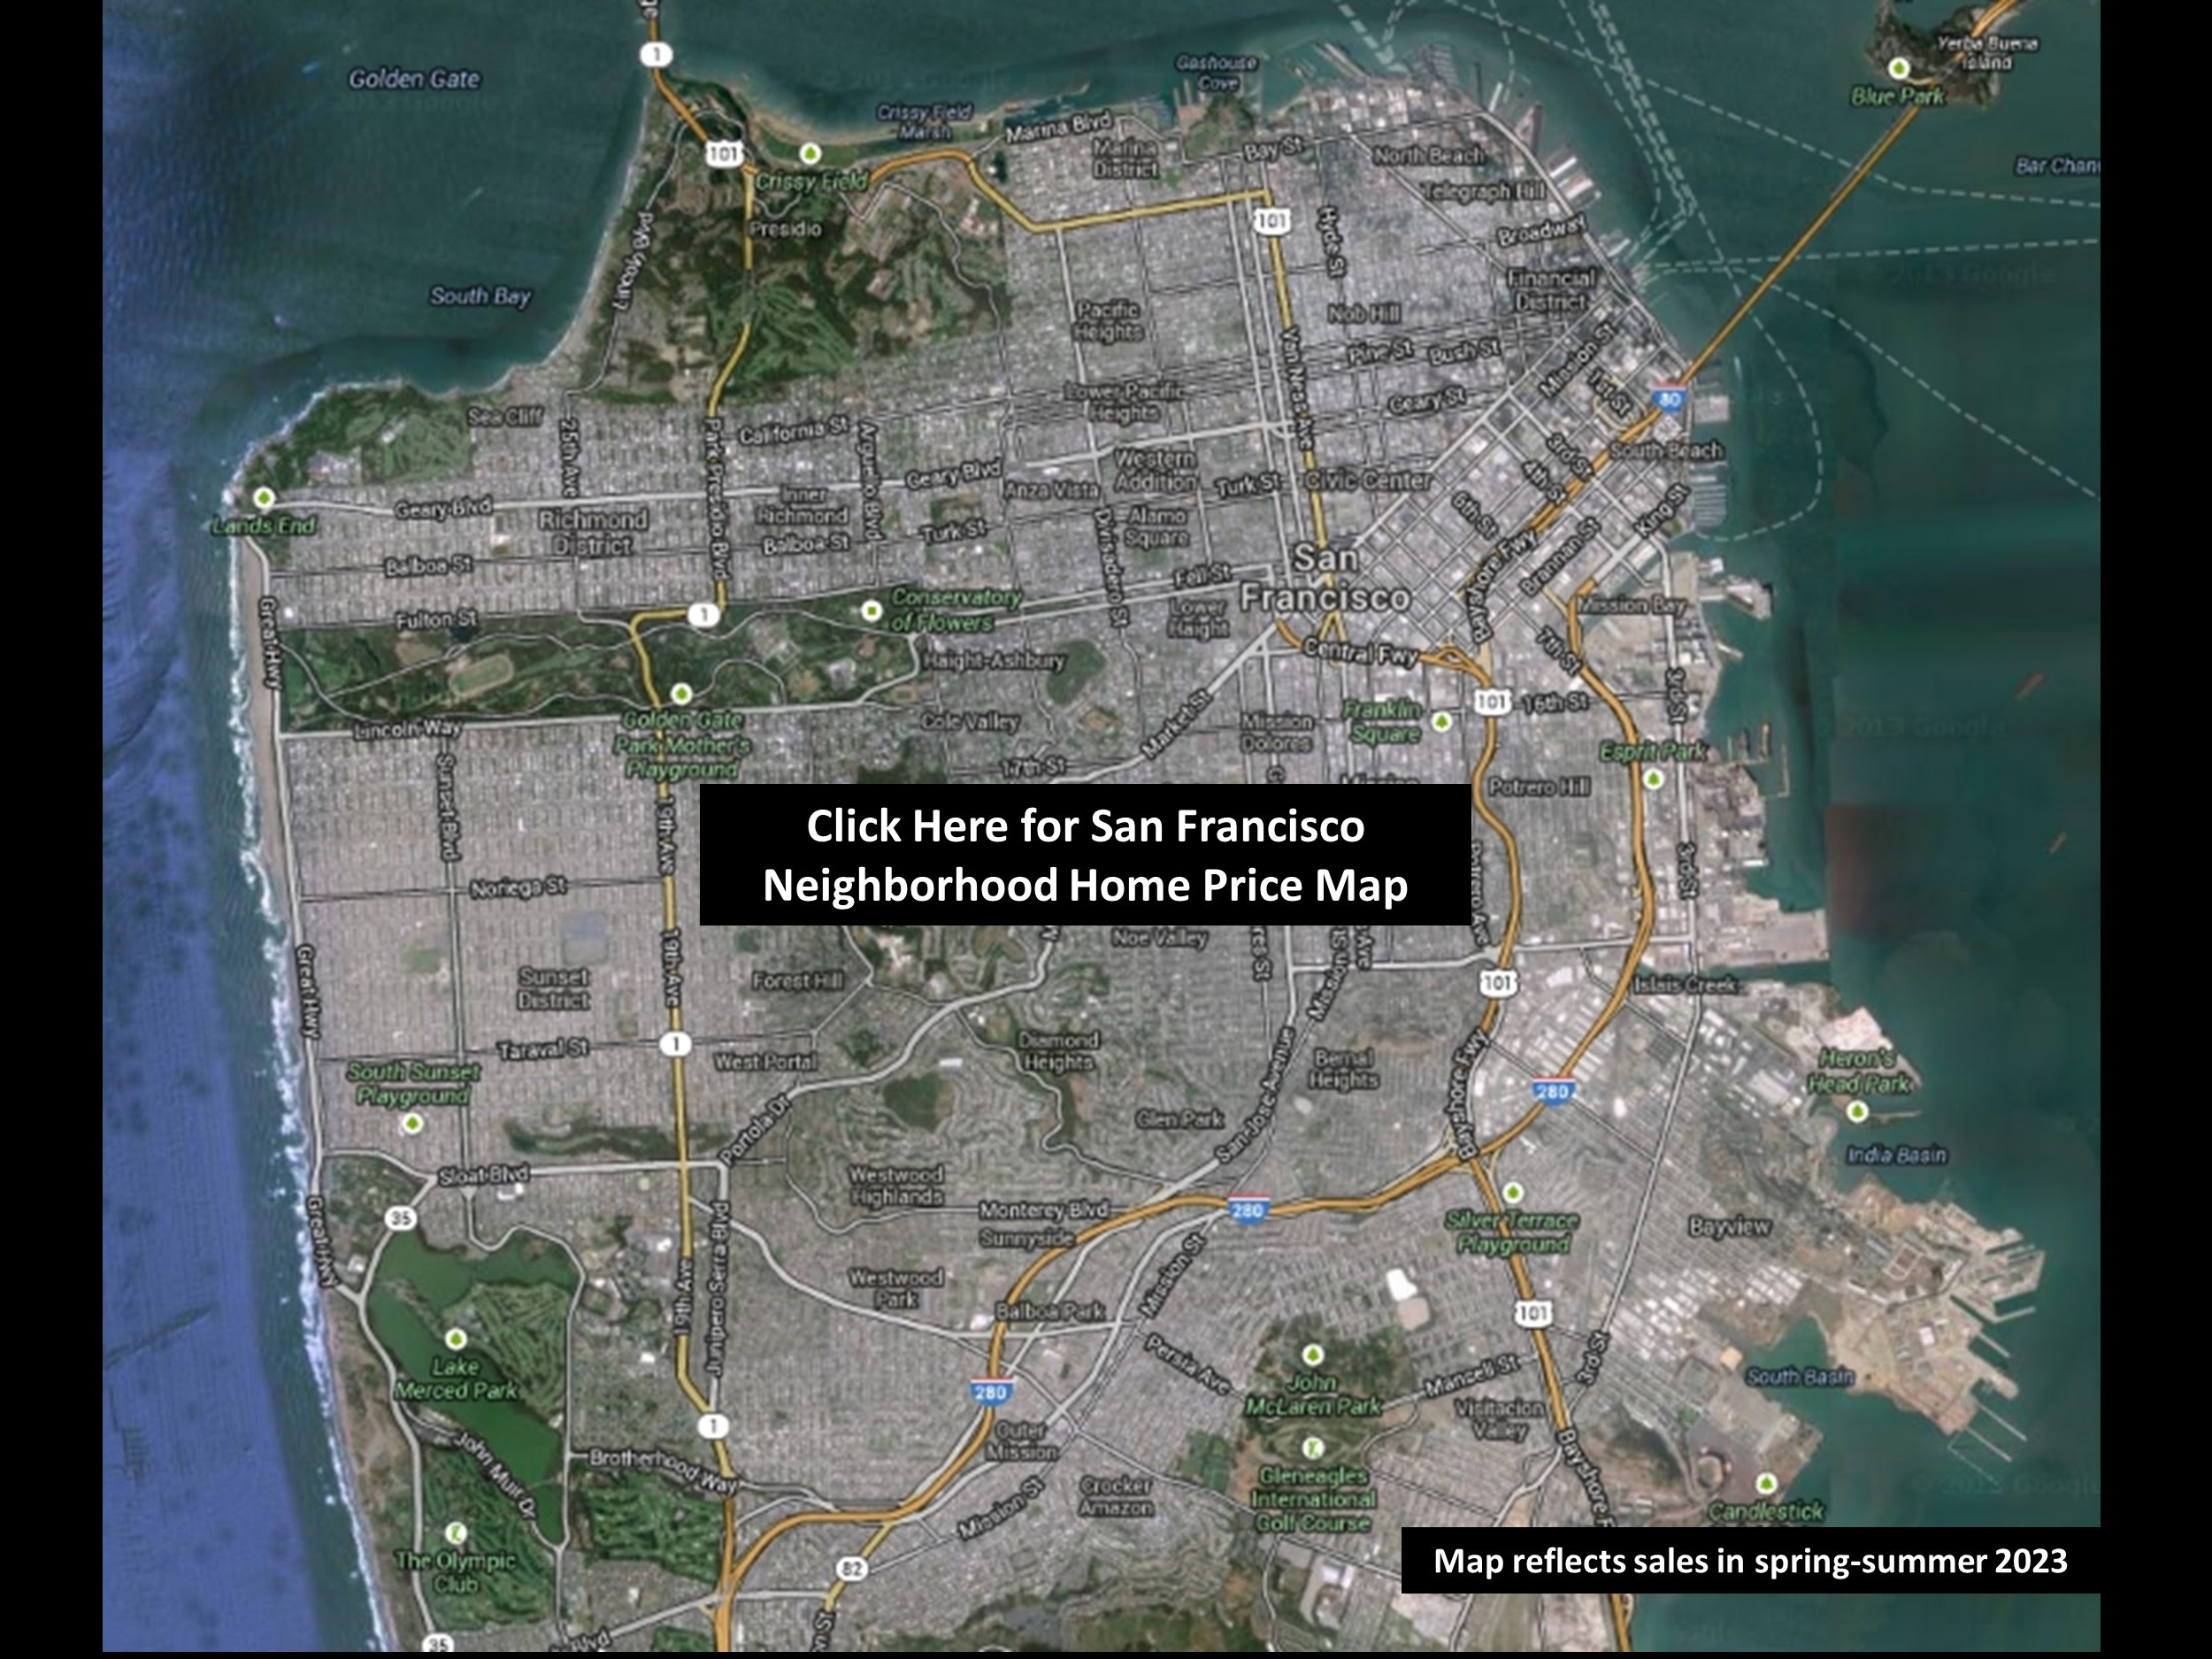
Map of San Francisco neighborhoods; home price data reflects spring–summer 2023 sales.

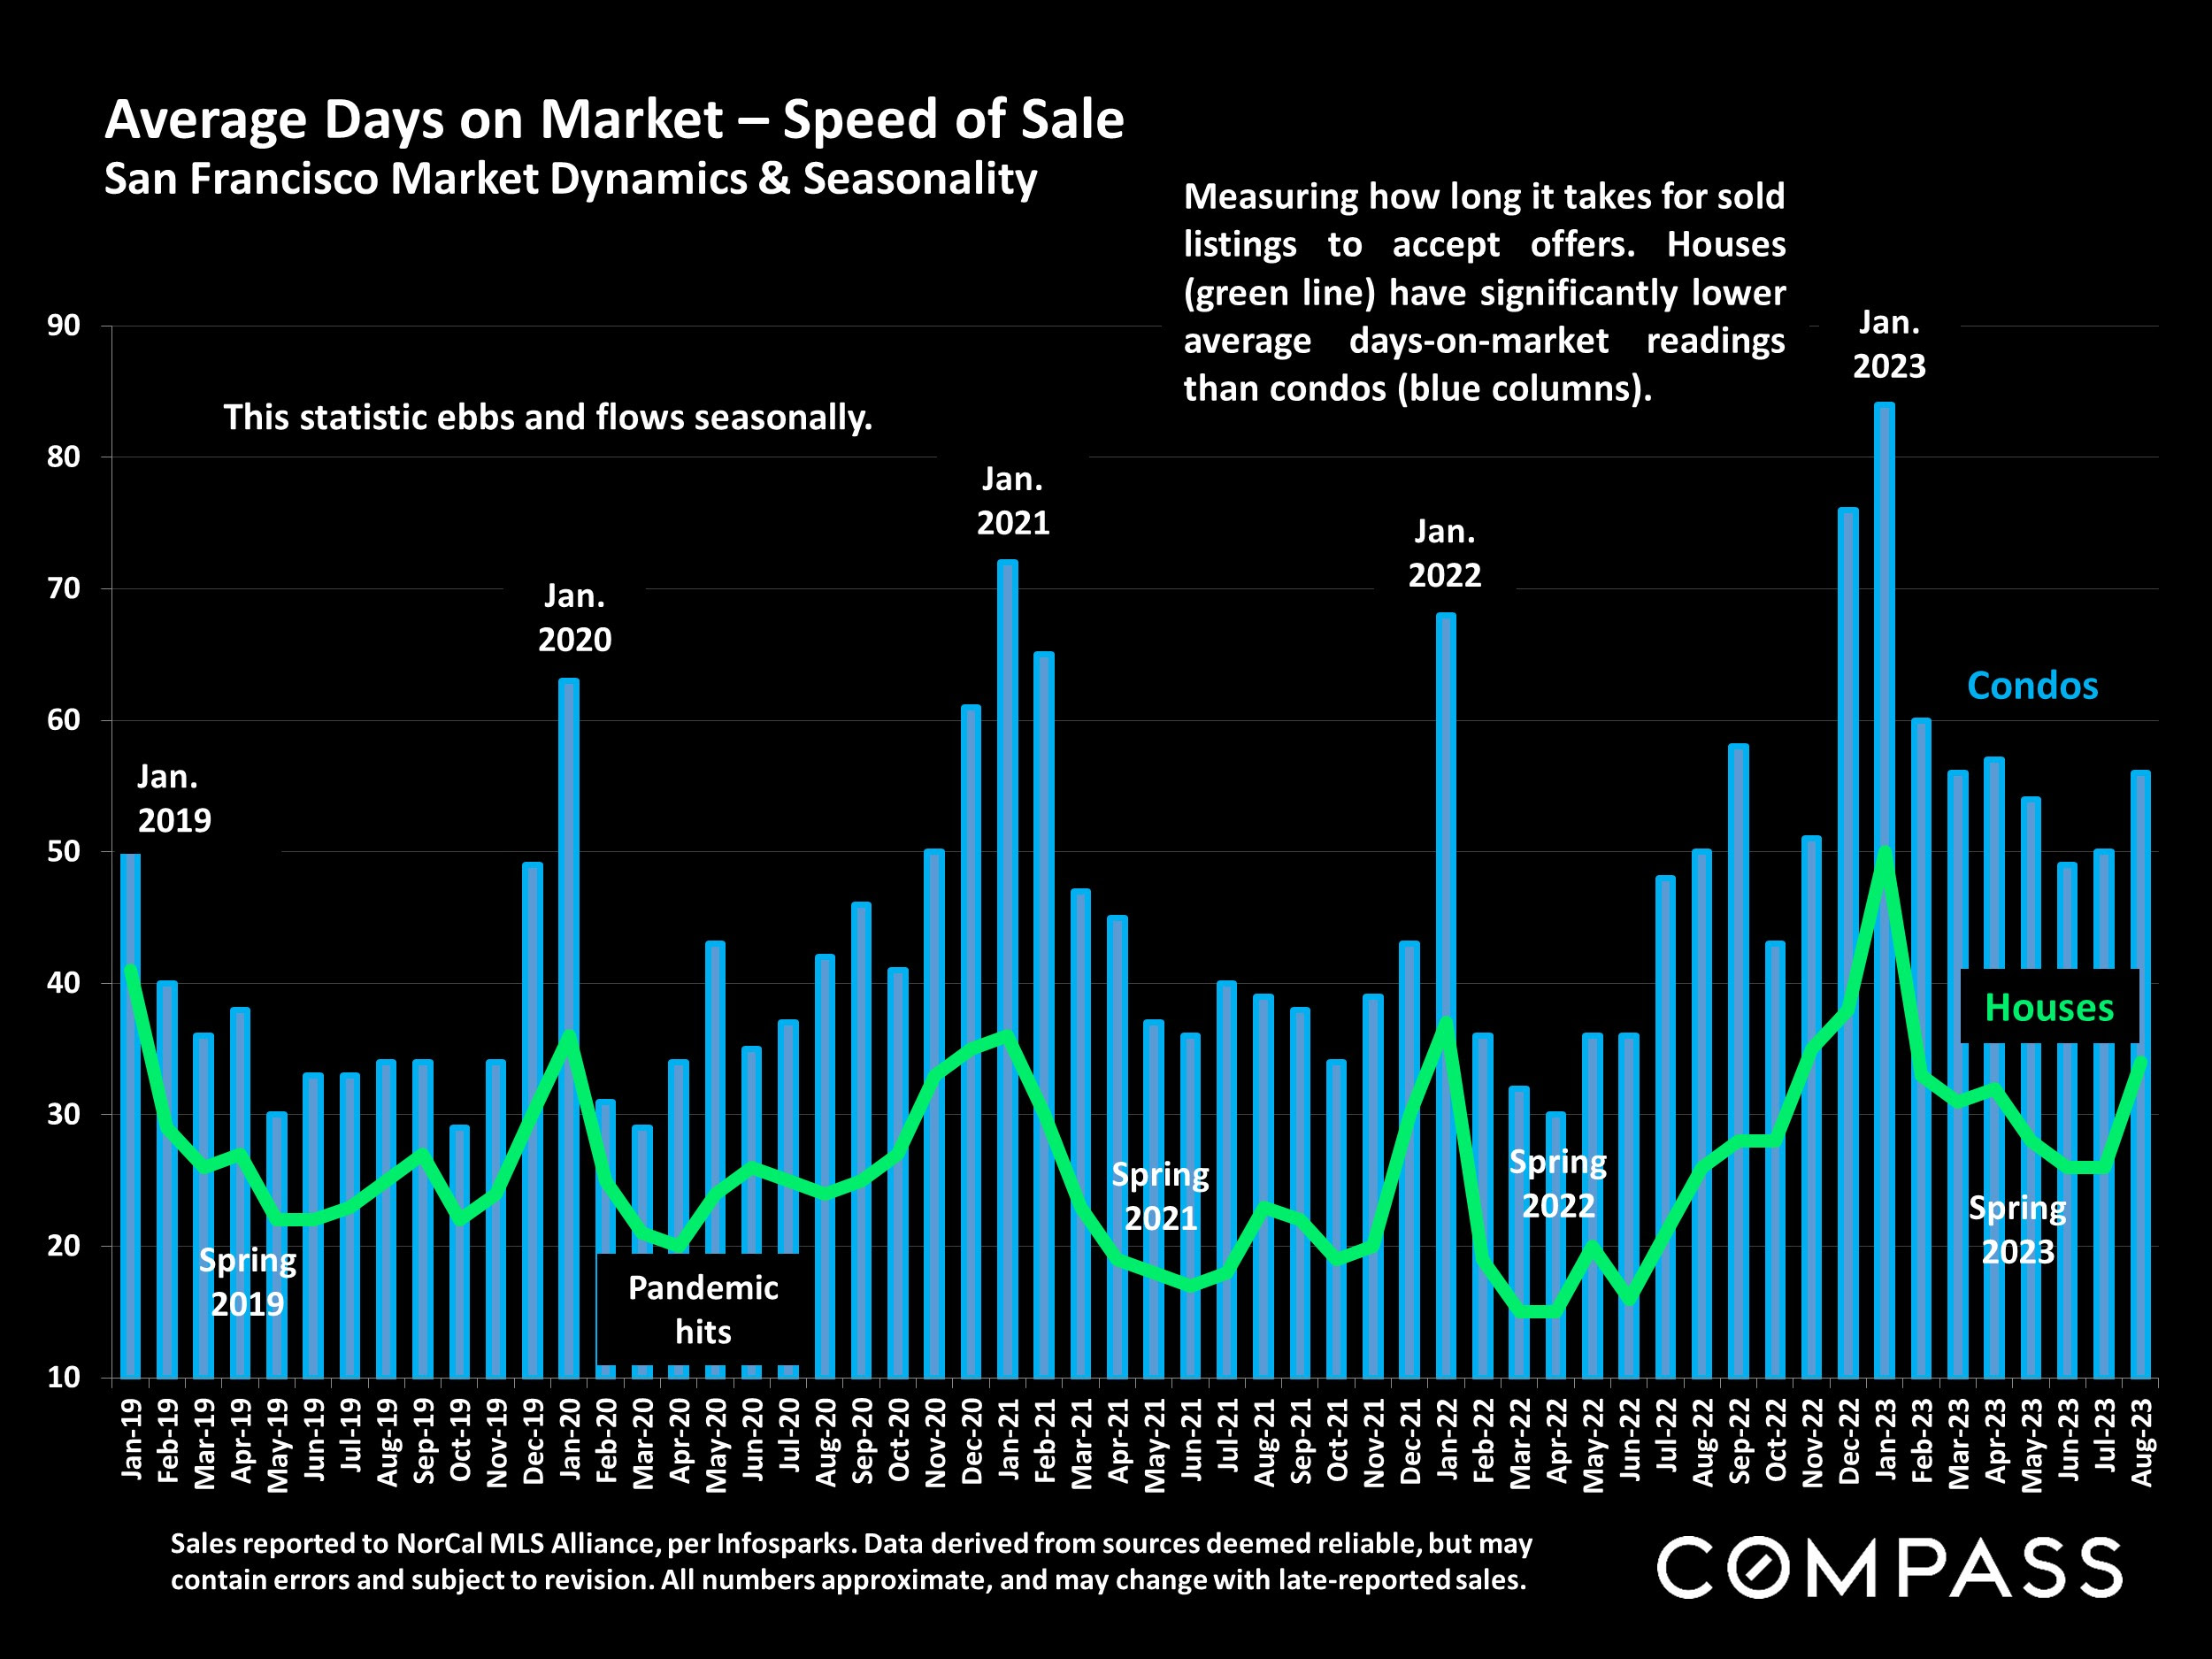
Chart comparing monthly San Francisco condo and house days on market from 2019 to August 2023.

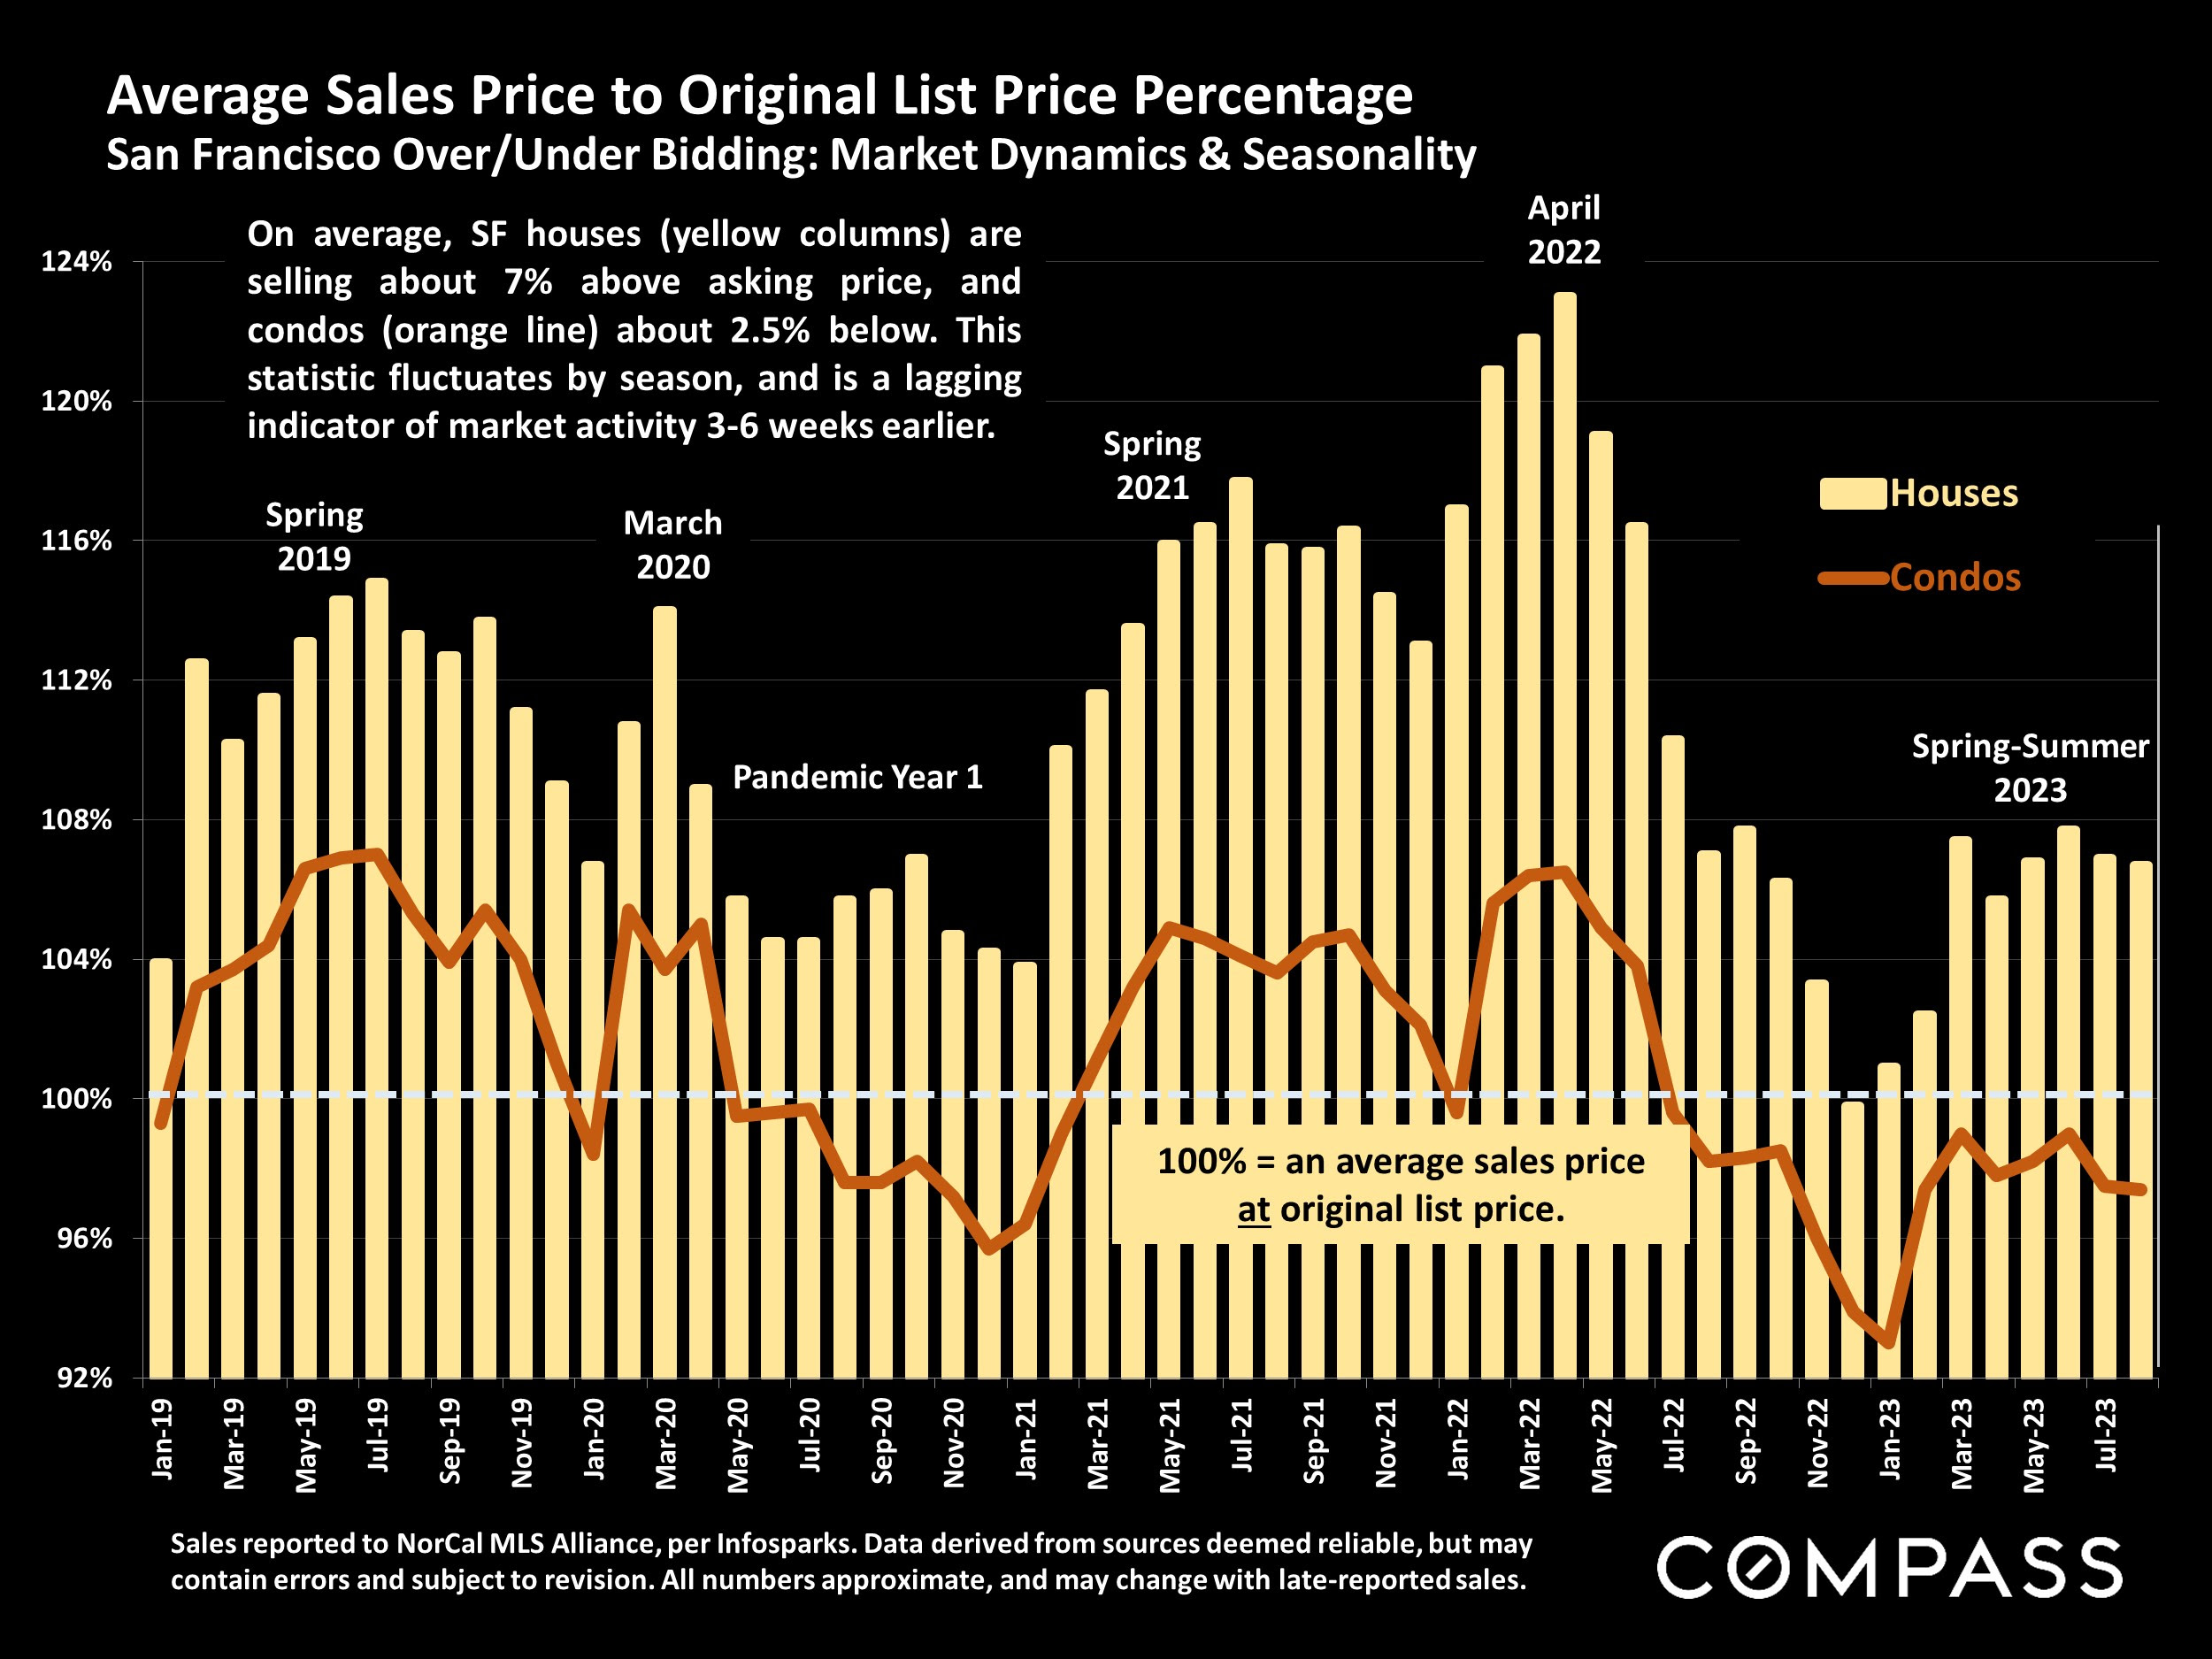
San Francisco home sale-to-list price chart, with monthly house bars, a condo line, and a 100% reference line.

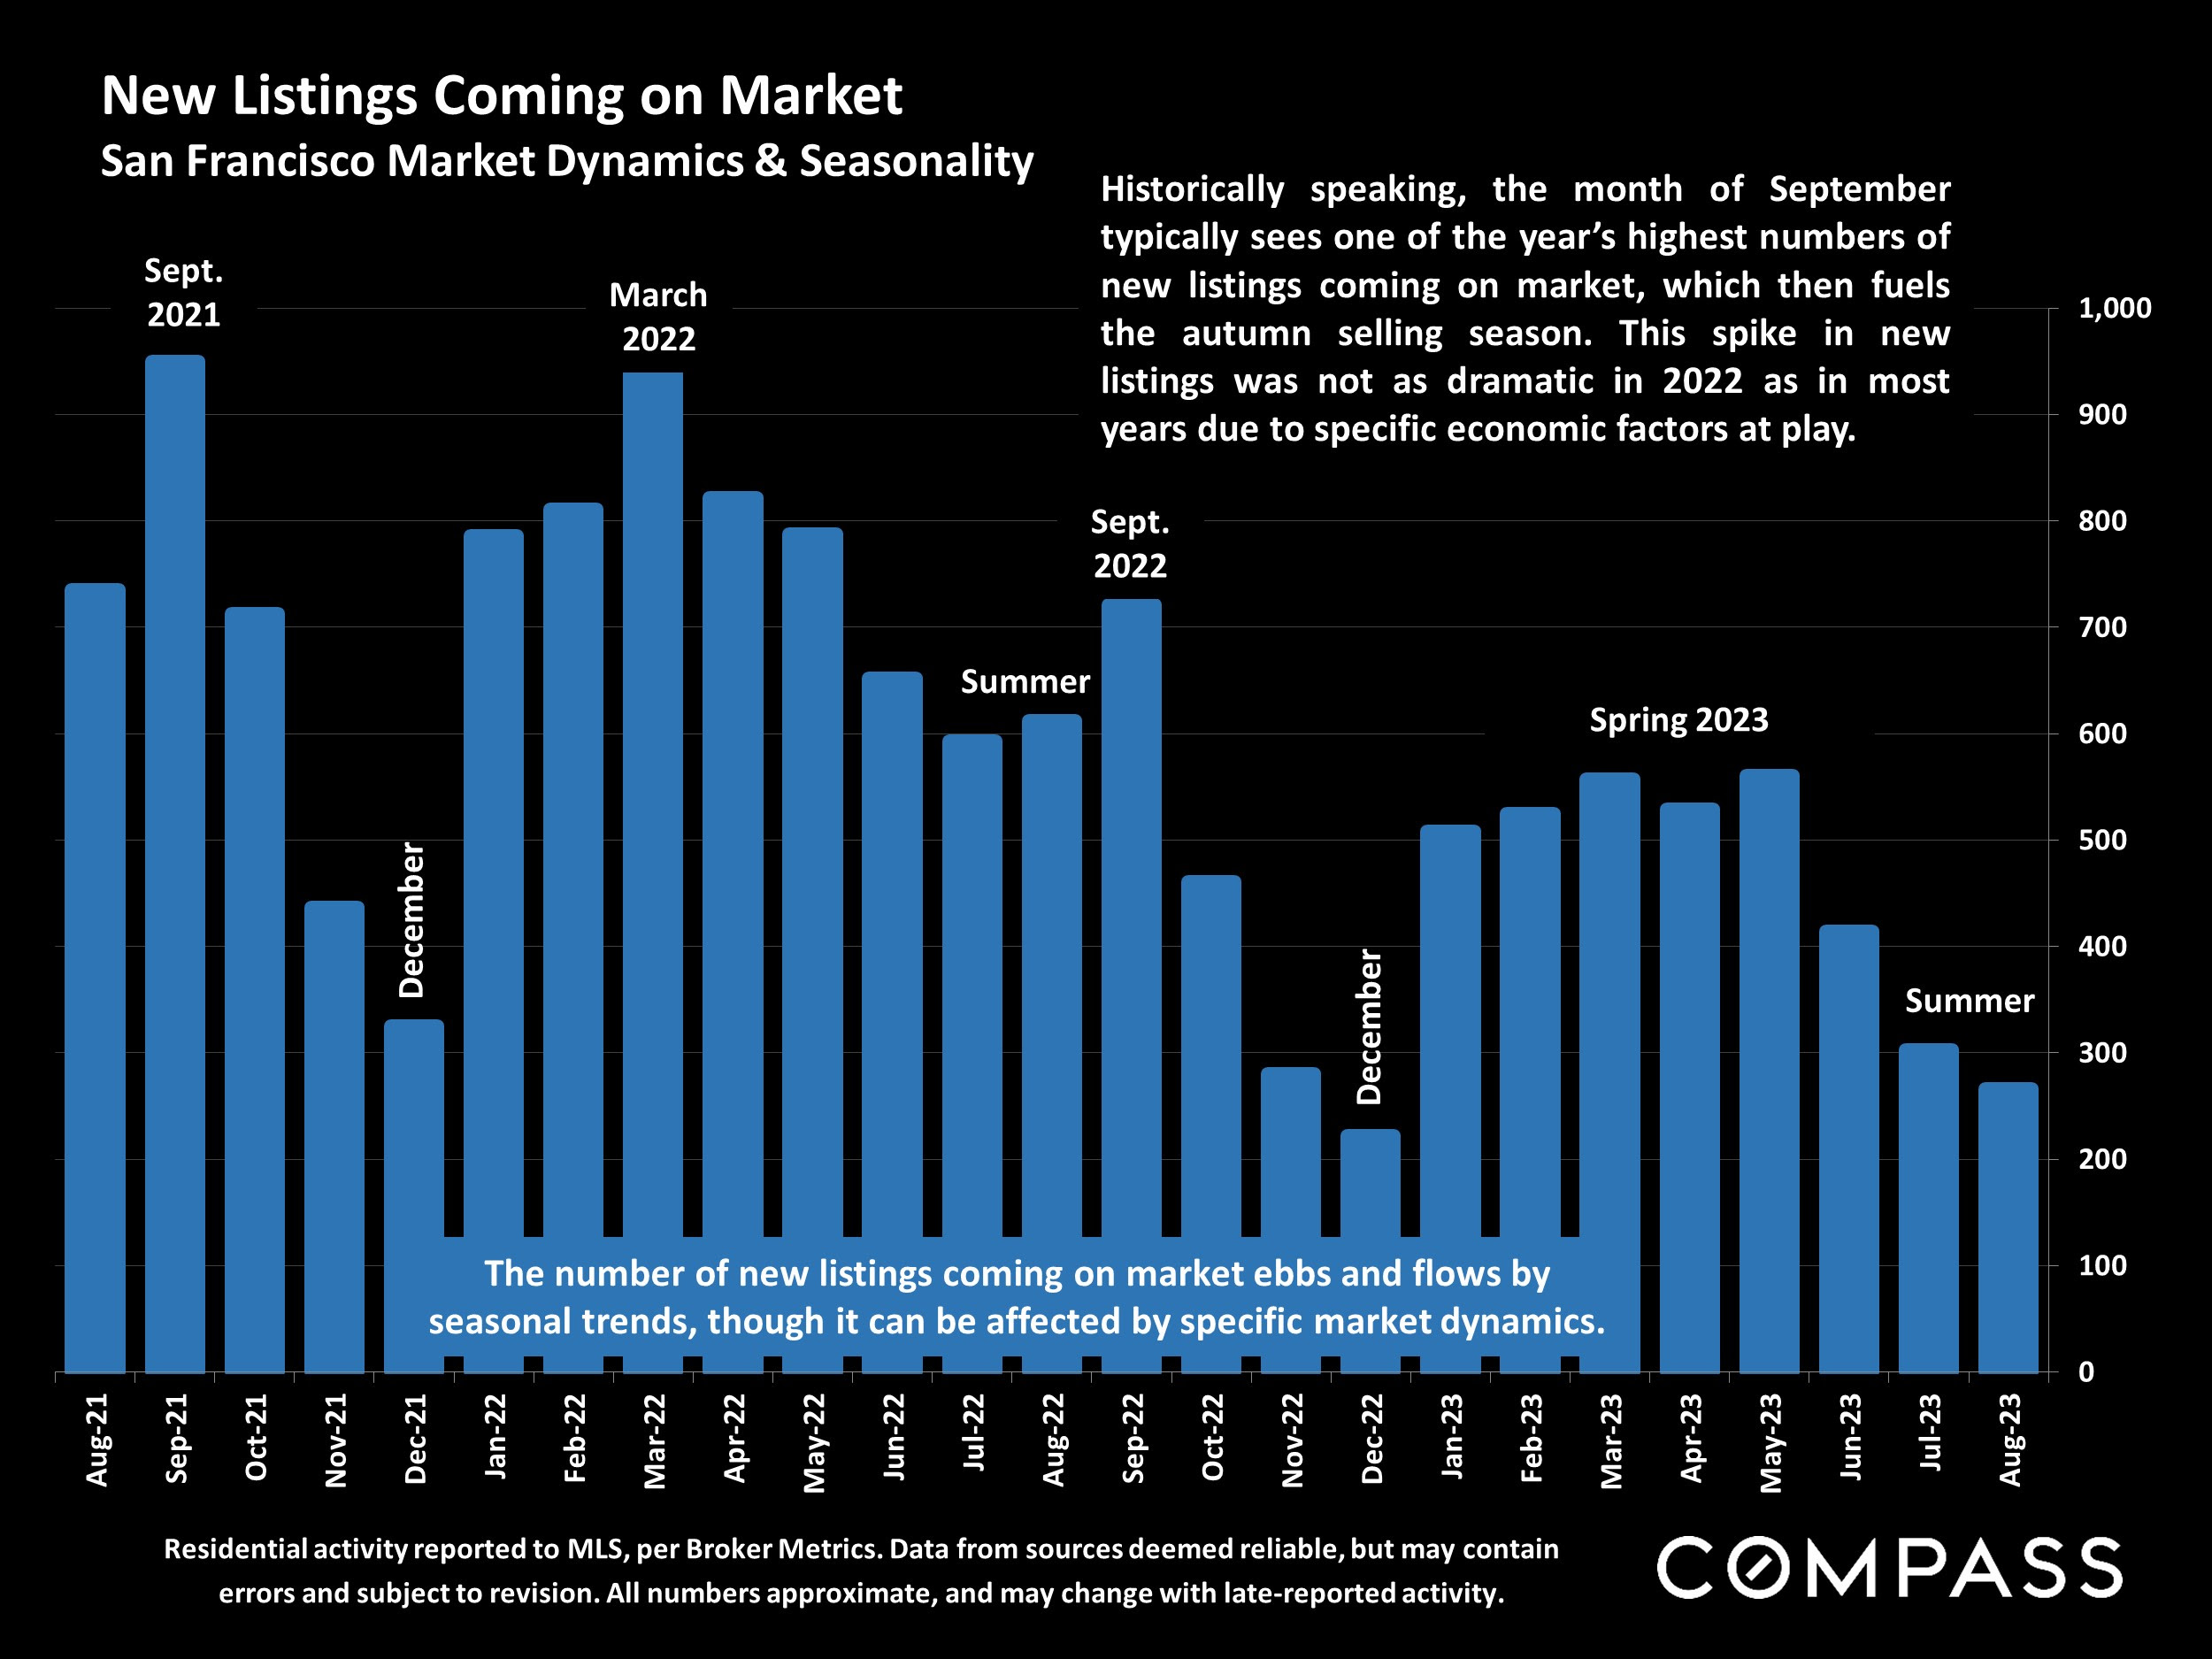
Chart of monthly San Francisco new listings, August 2021–August 2023, with seasonal trends and September peaks.

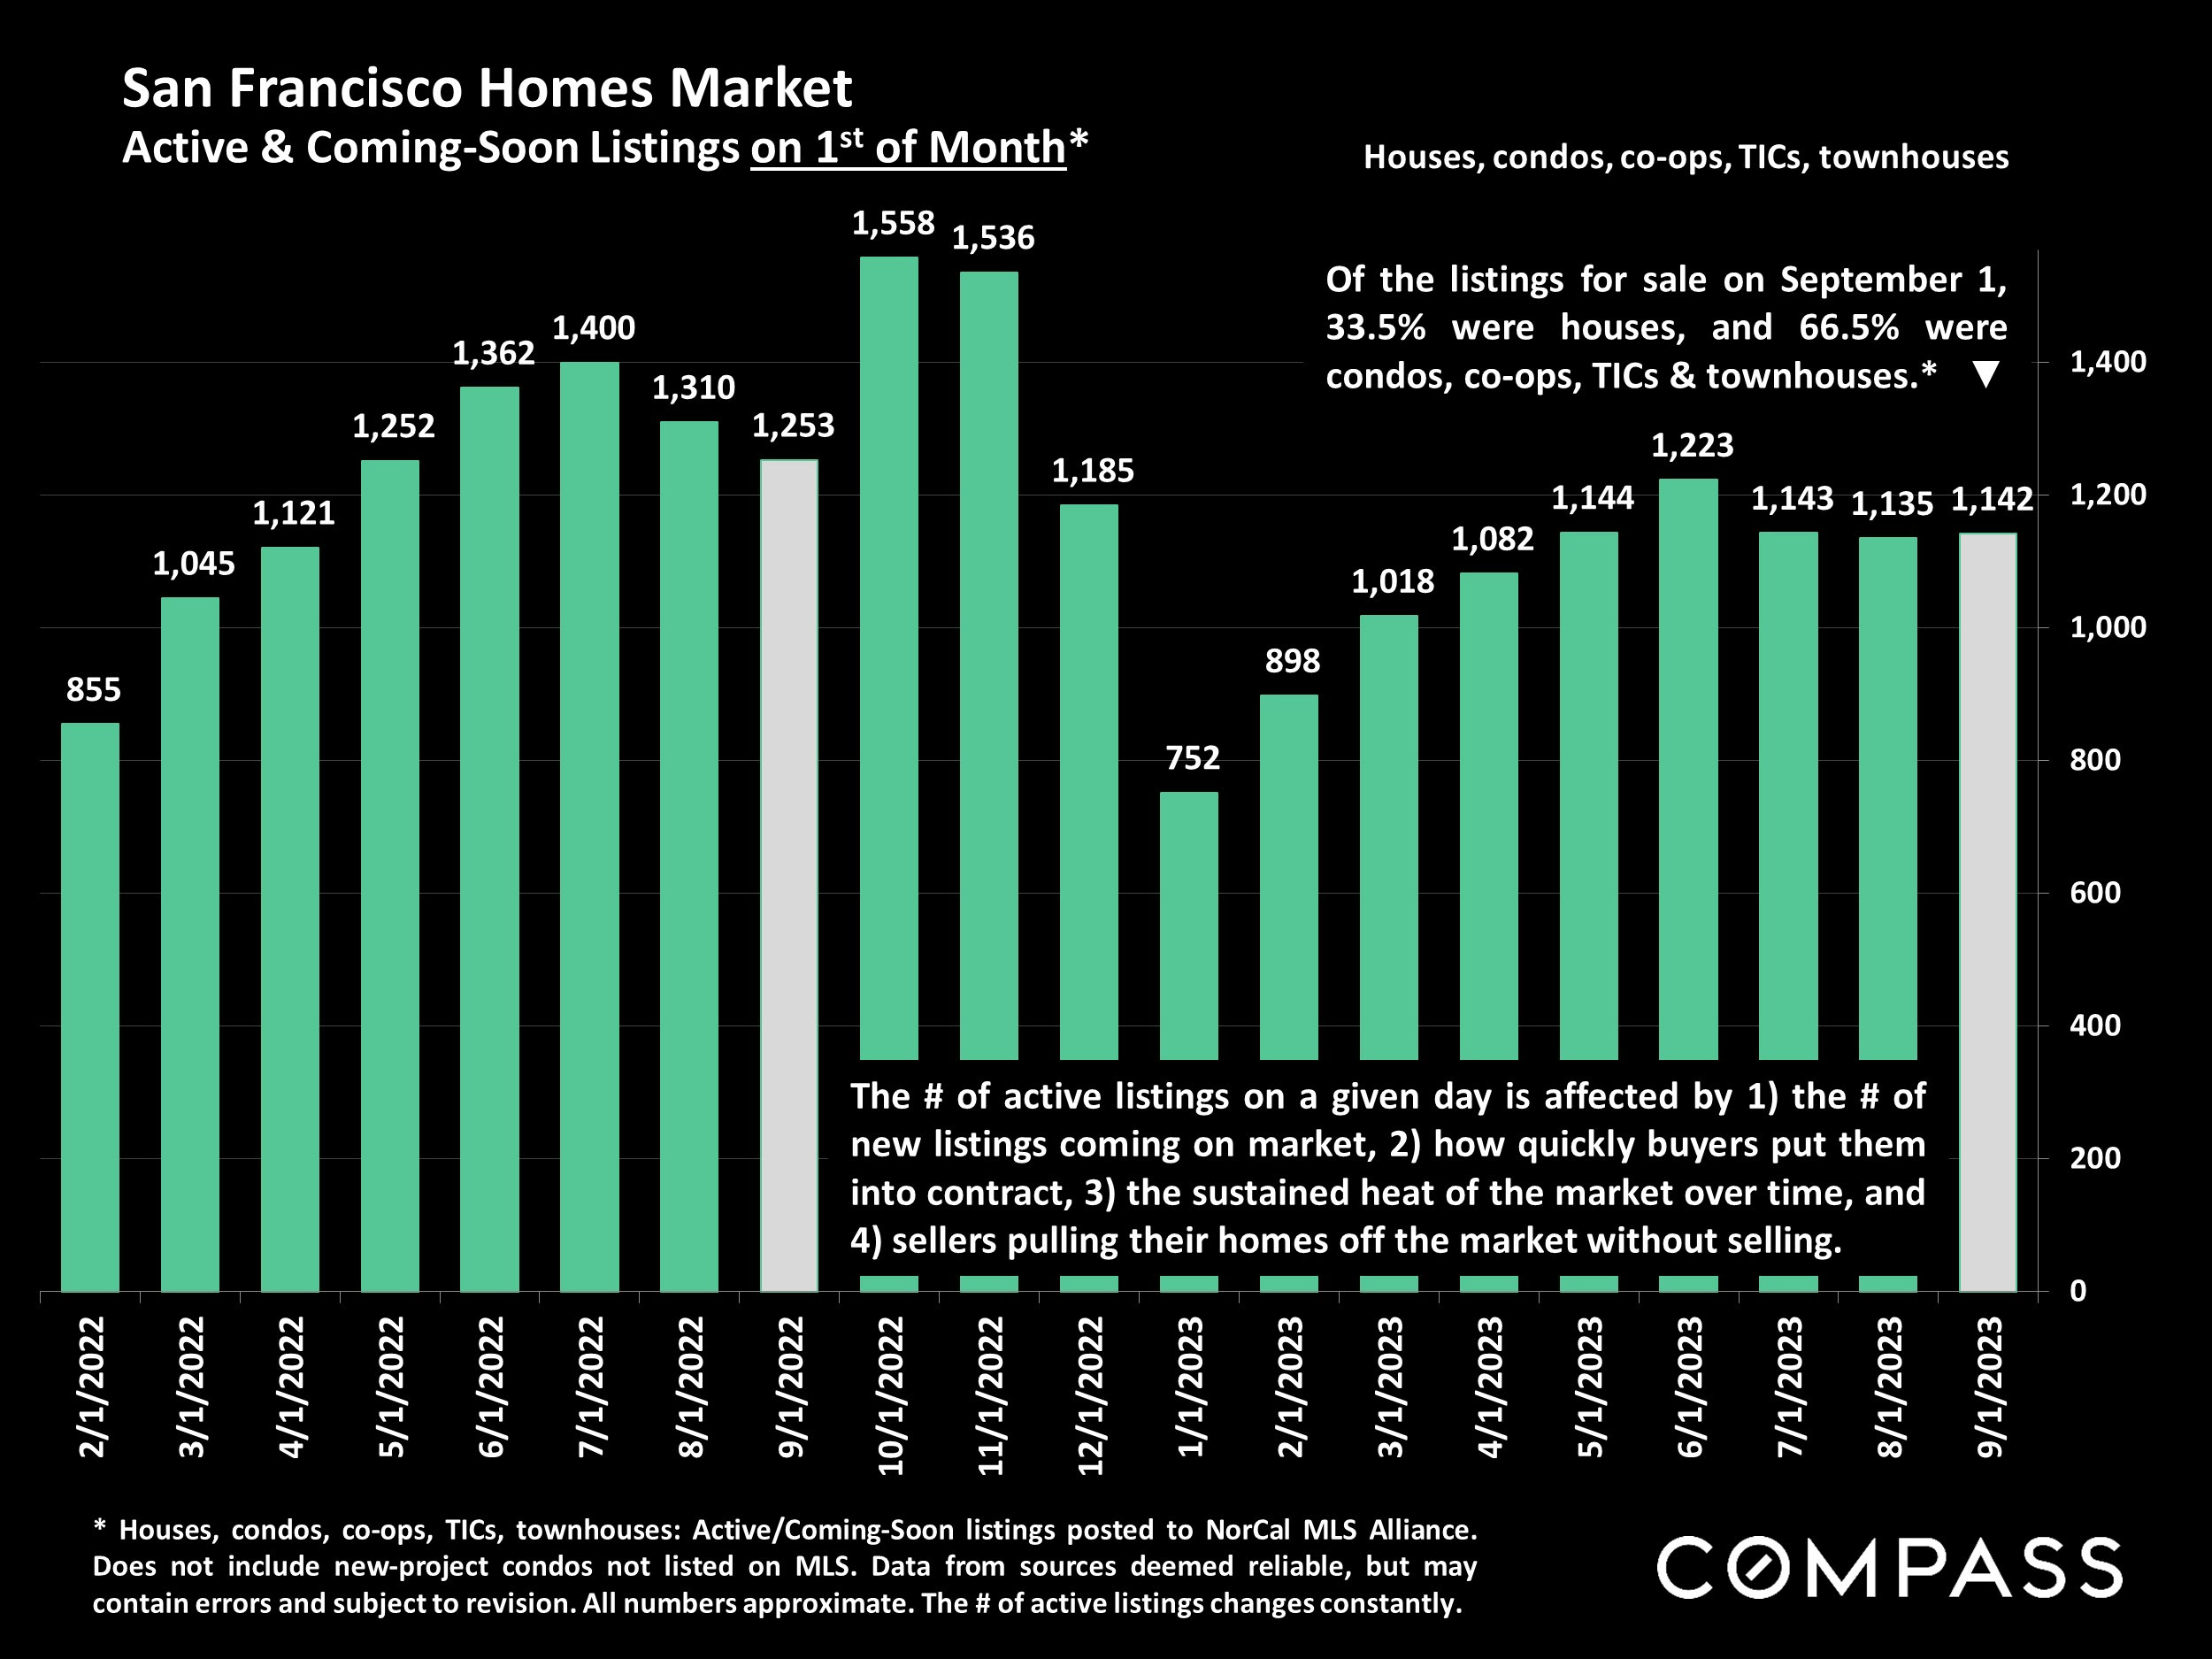
San Francisco home listing chart, February 2022–September 2023, with monthly totals and September 2023 housing-type breakdown.

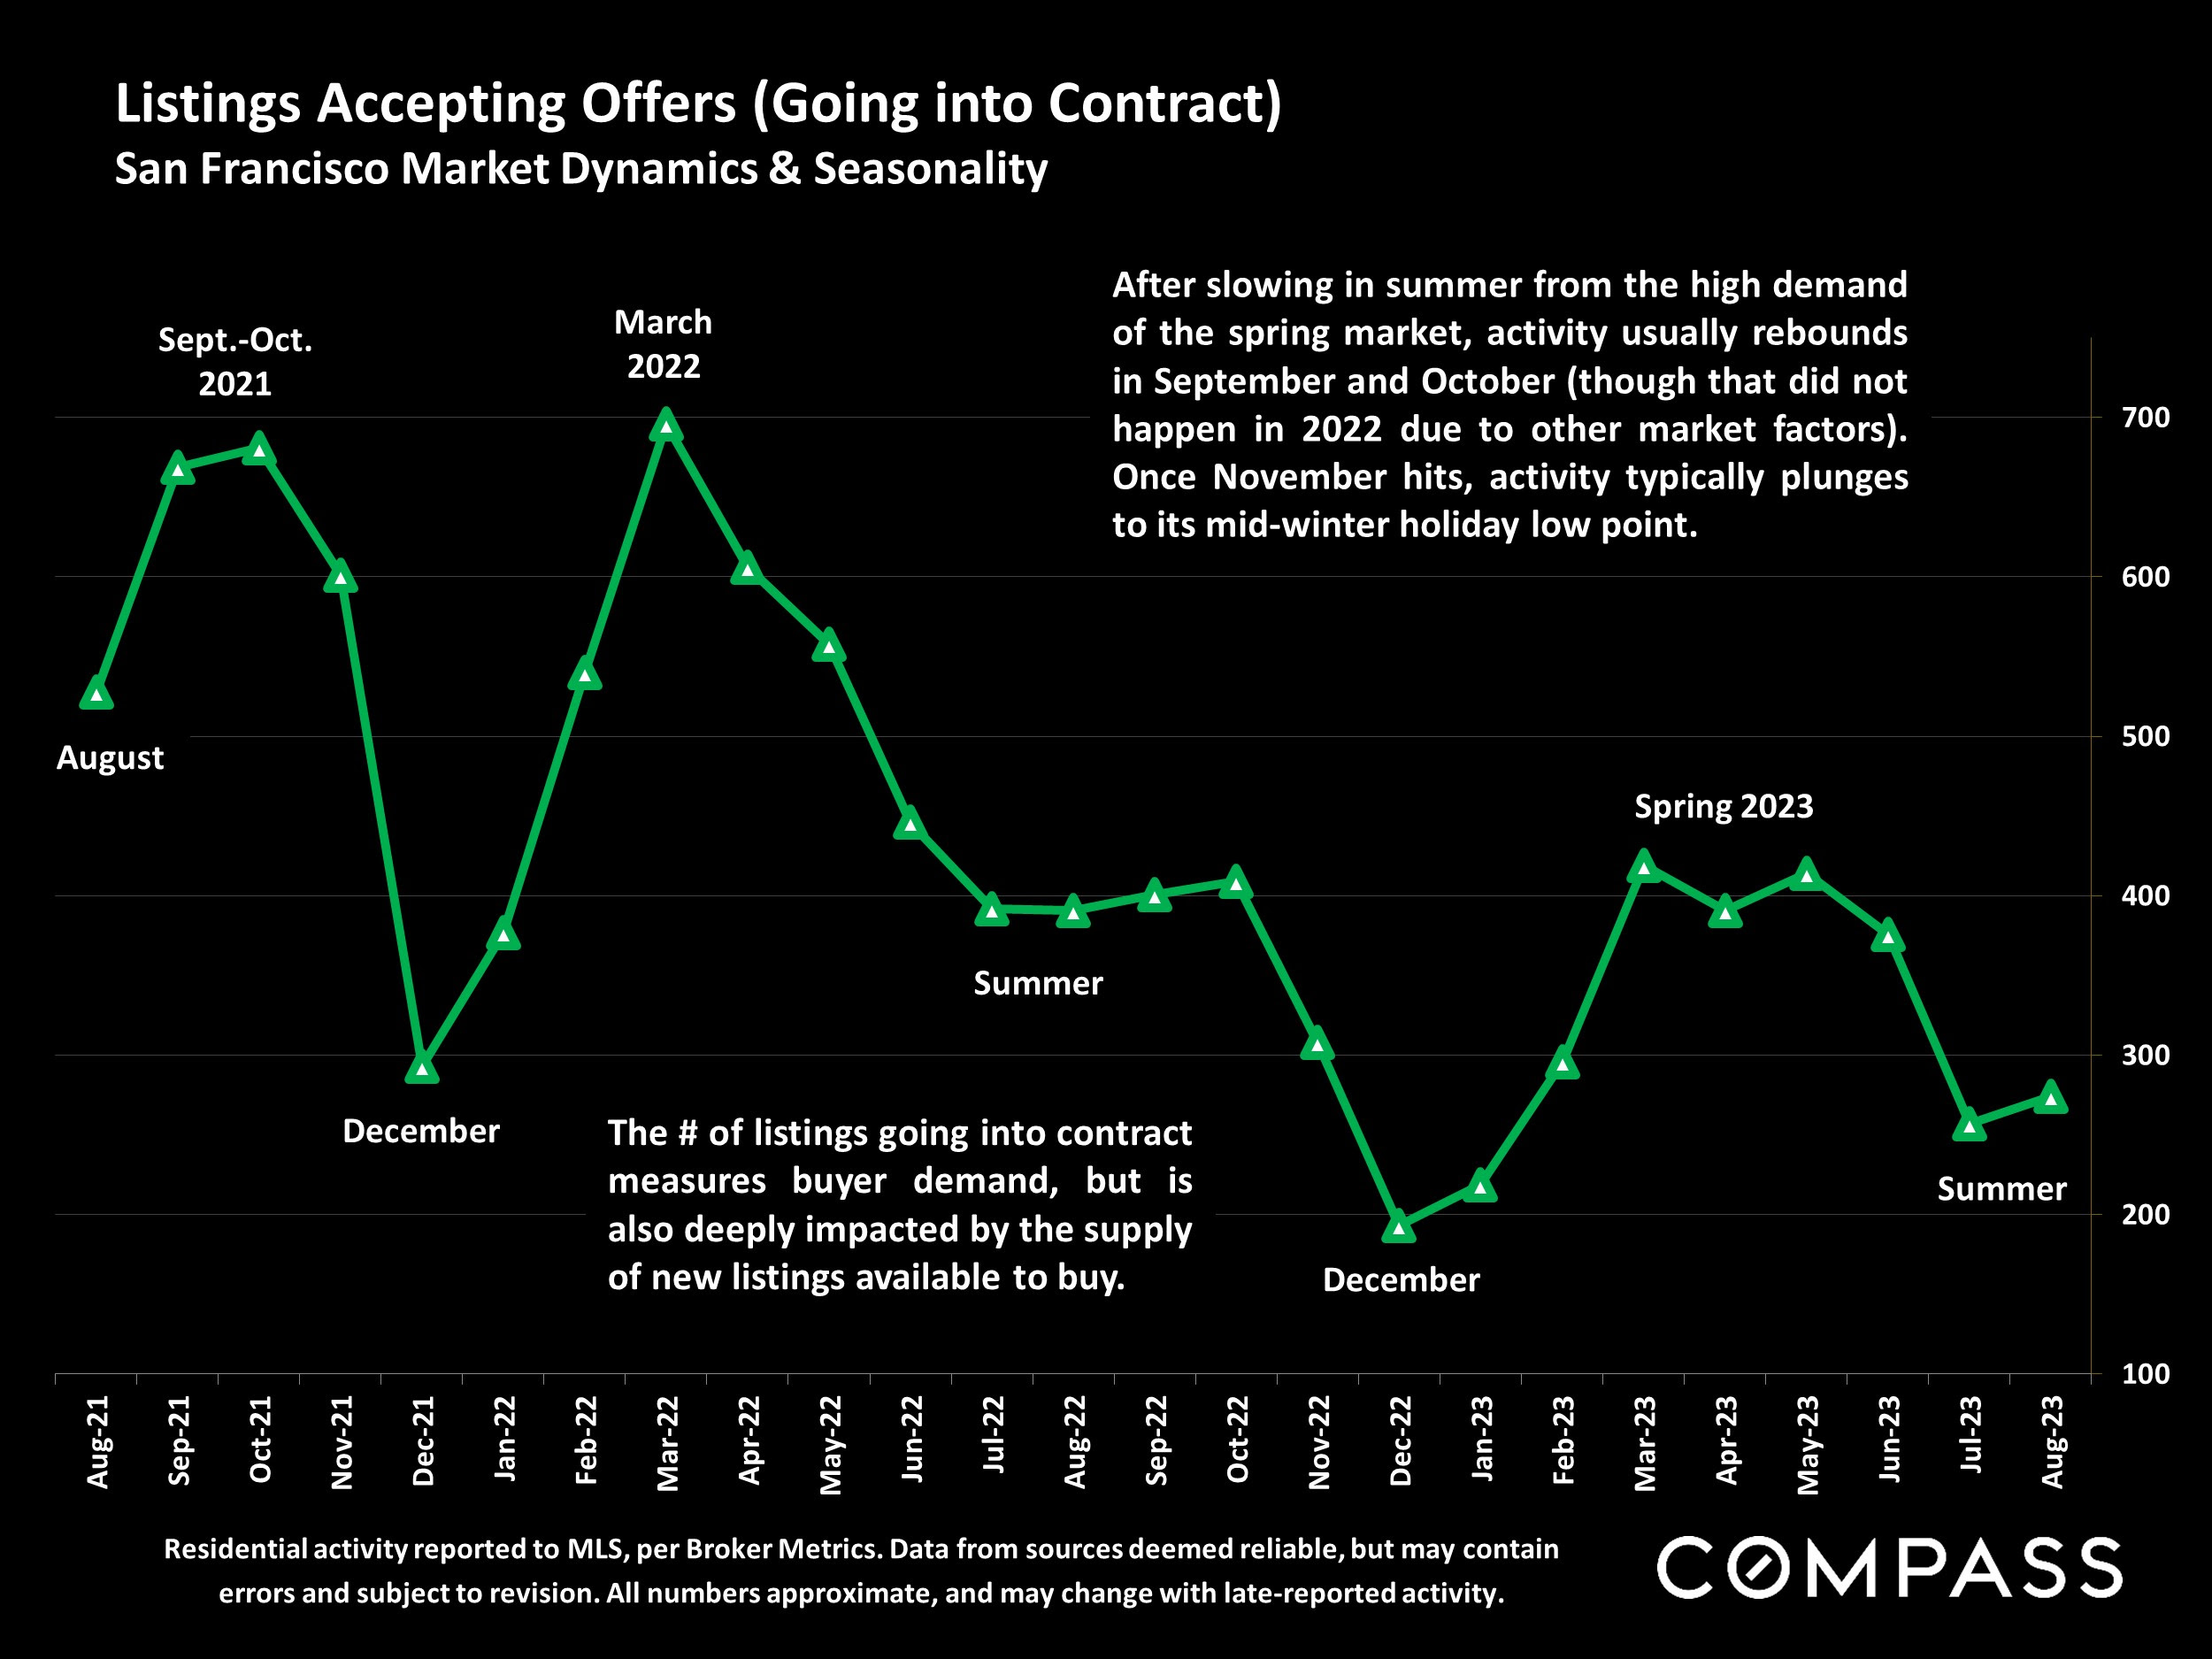
San Francisco listings-accepting-offers chart, with a green monthly trend line and notes on market seasonality.

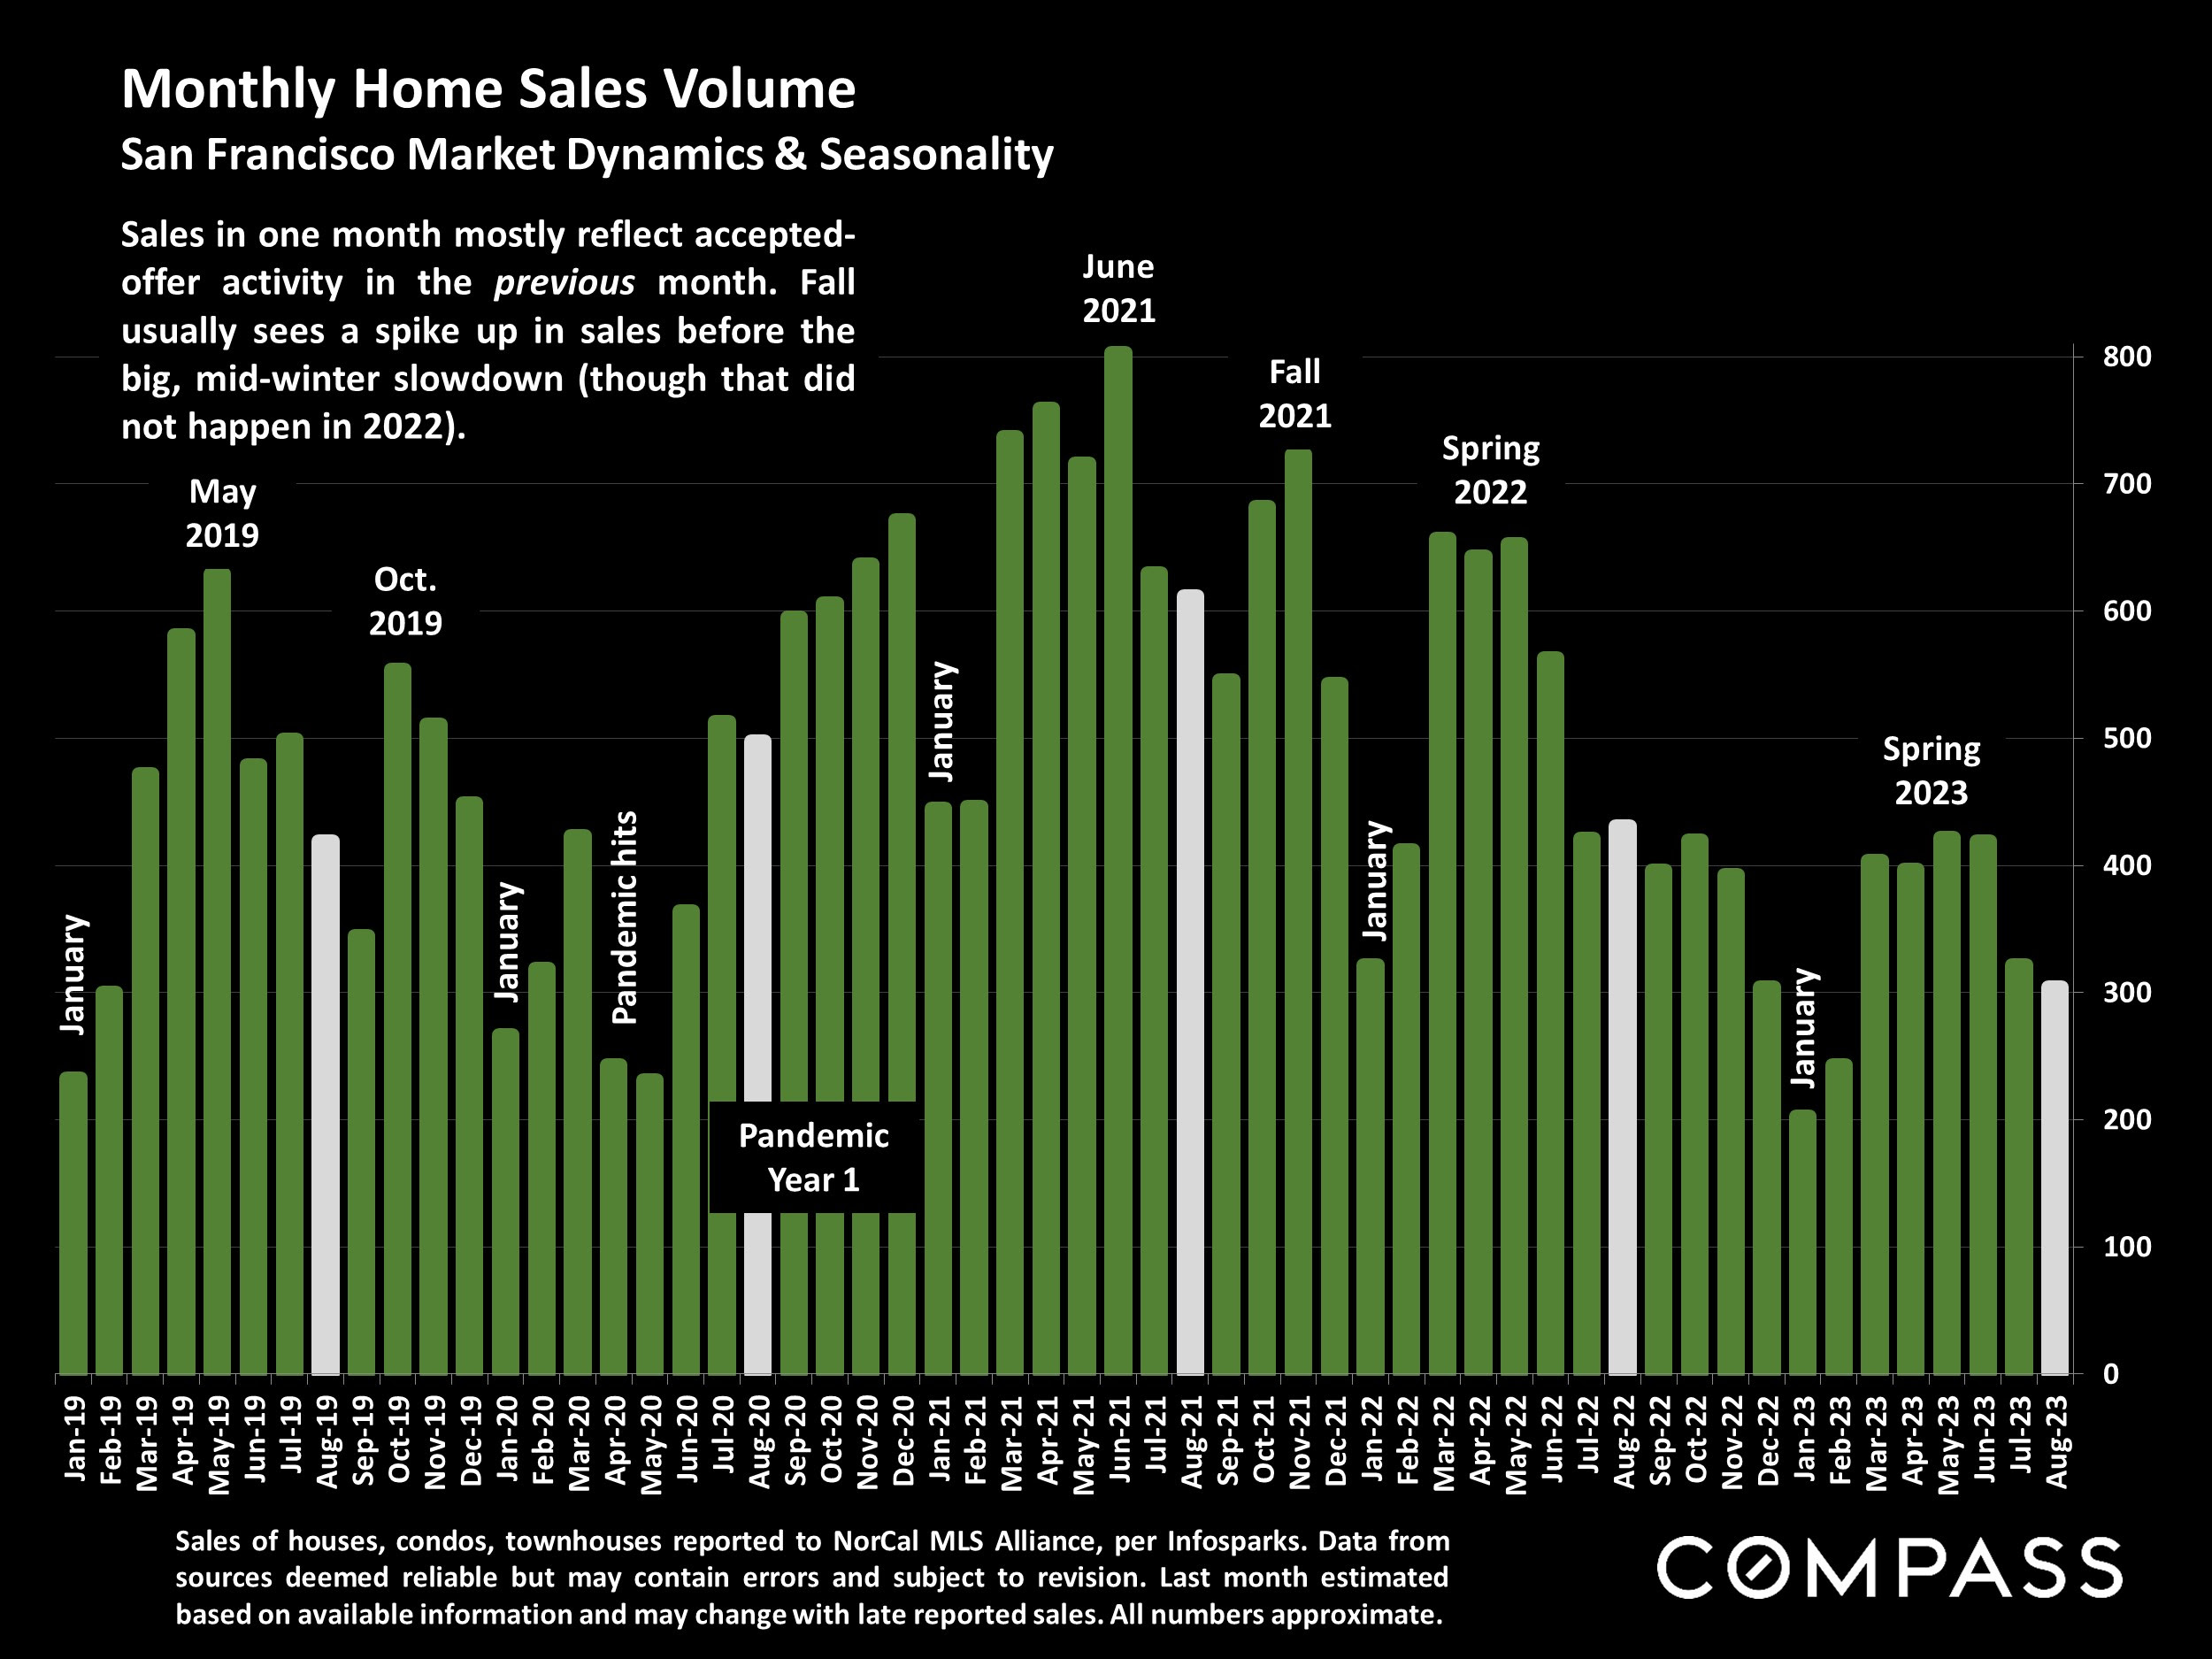
Chart of monthly San Francisco home sales, January 2019 to August 2023, with seasonal and pandemic-era annotations.

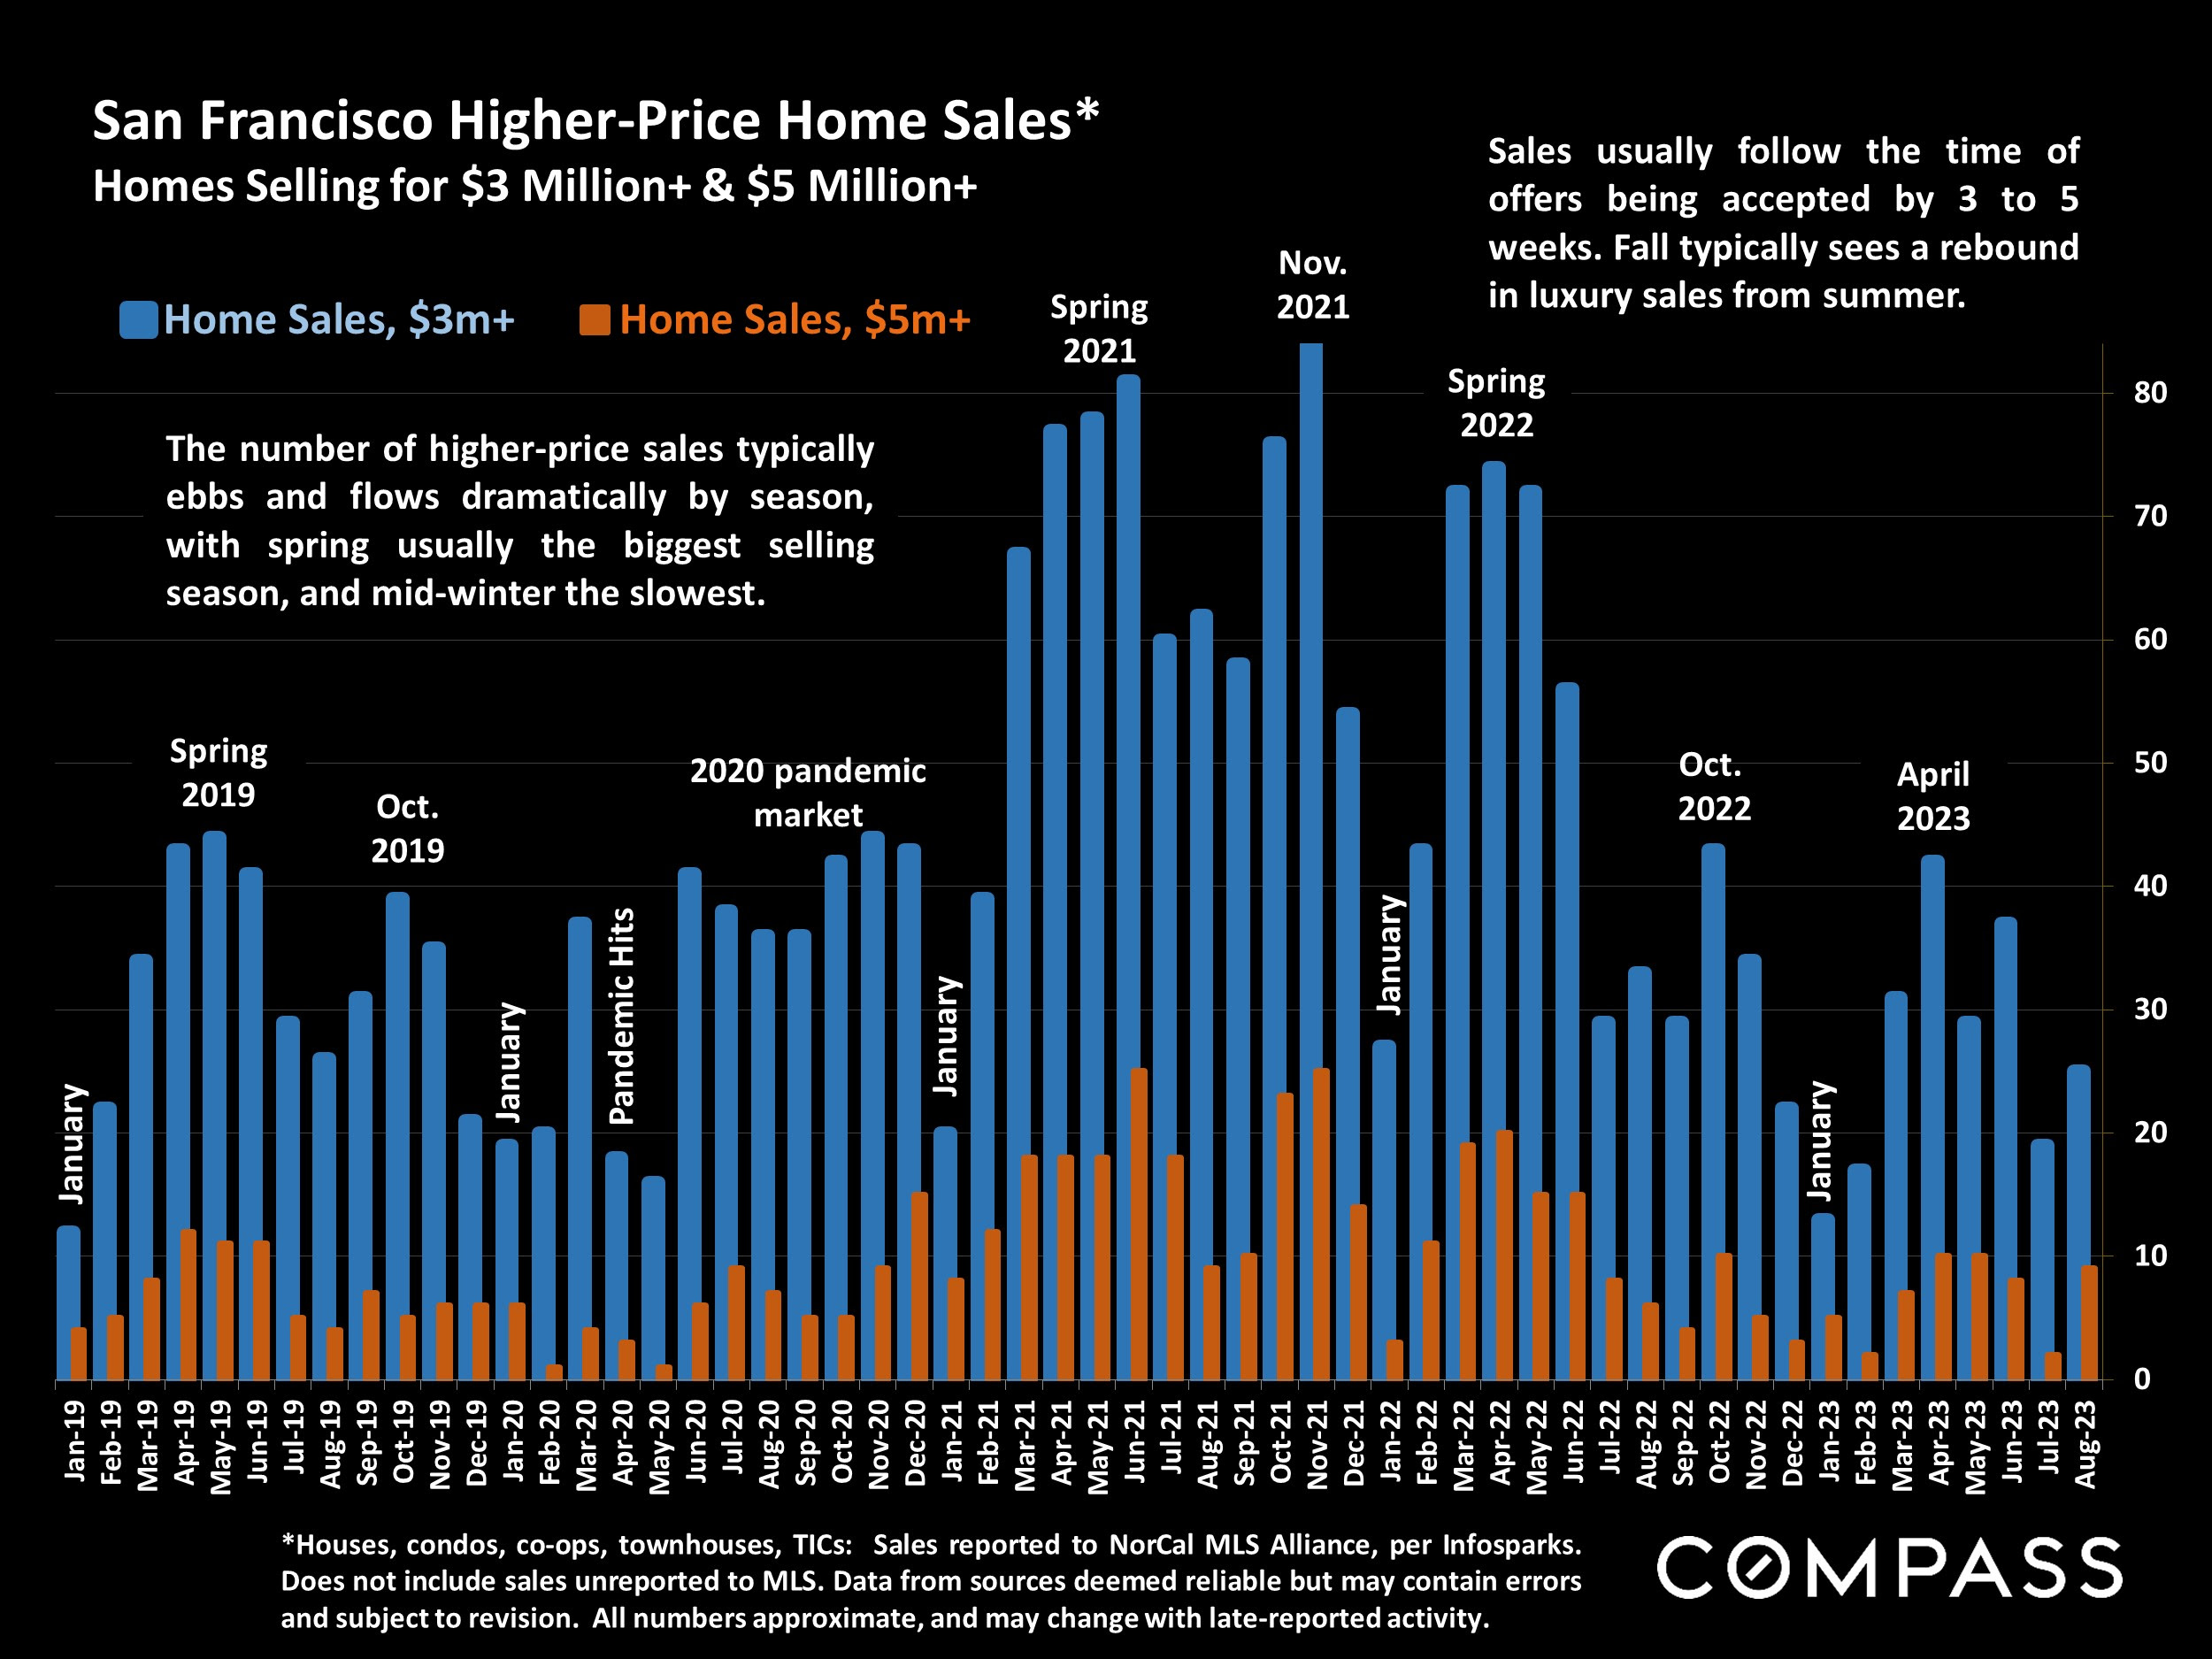
Bar chart comparing San Francisco home sales over $3 million and $5 million from 2019 to 2023.

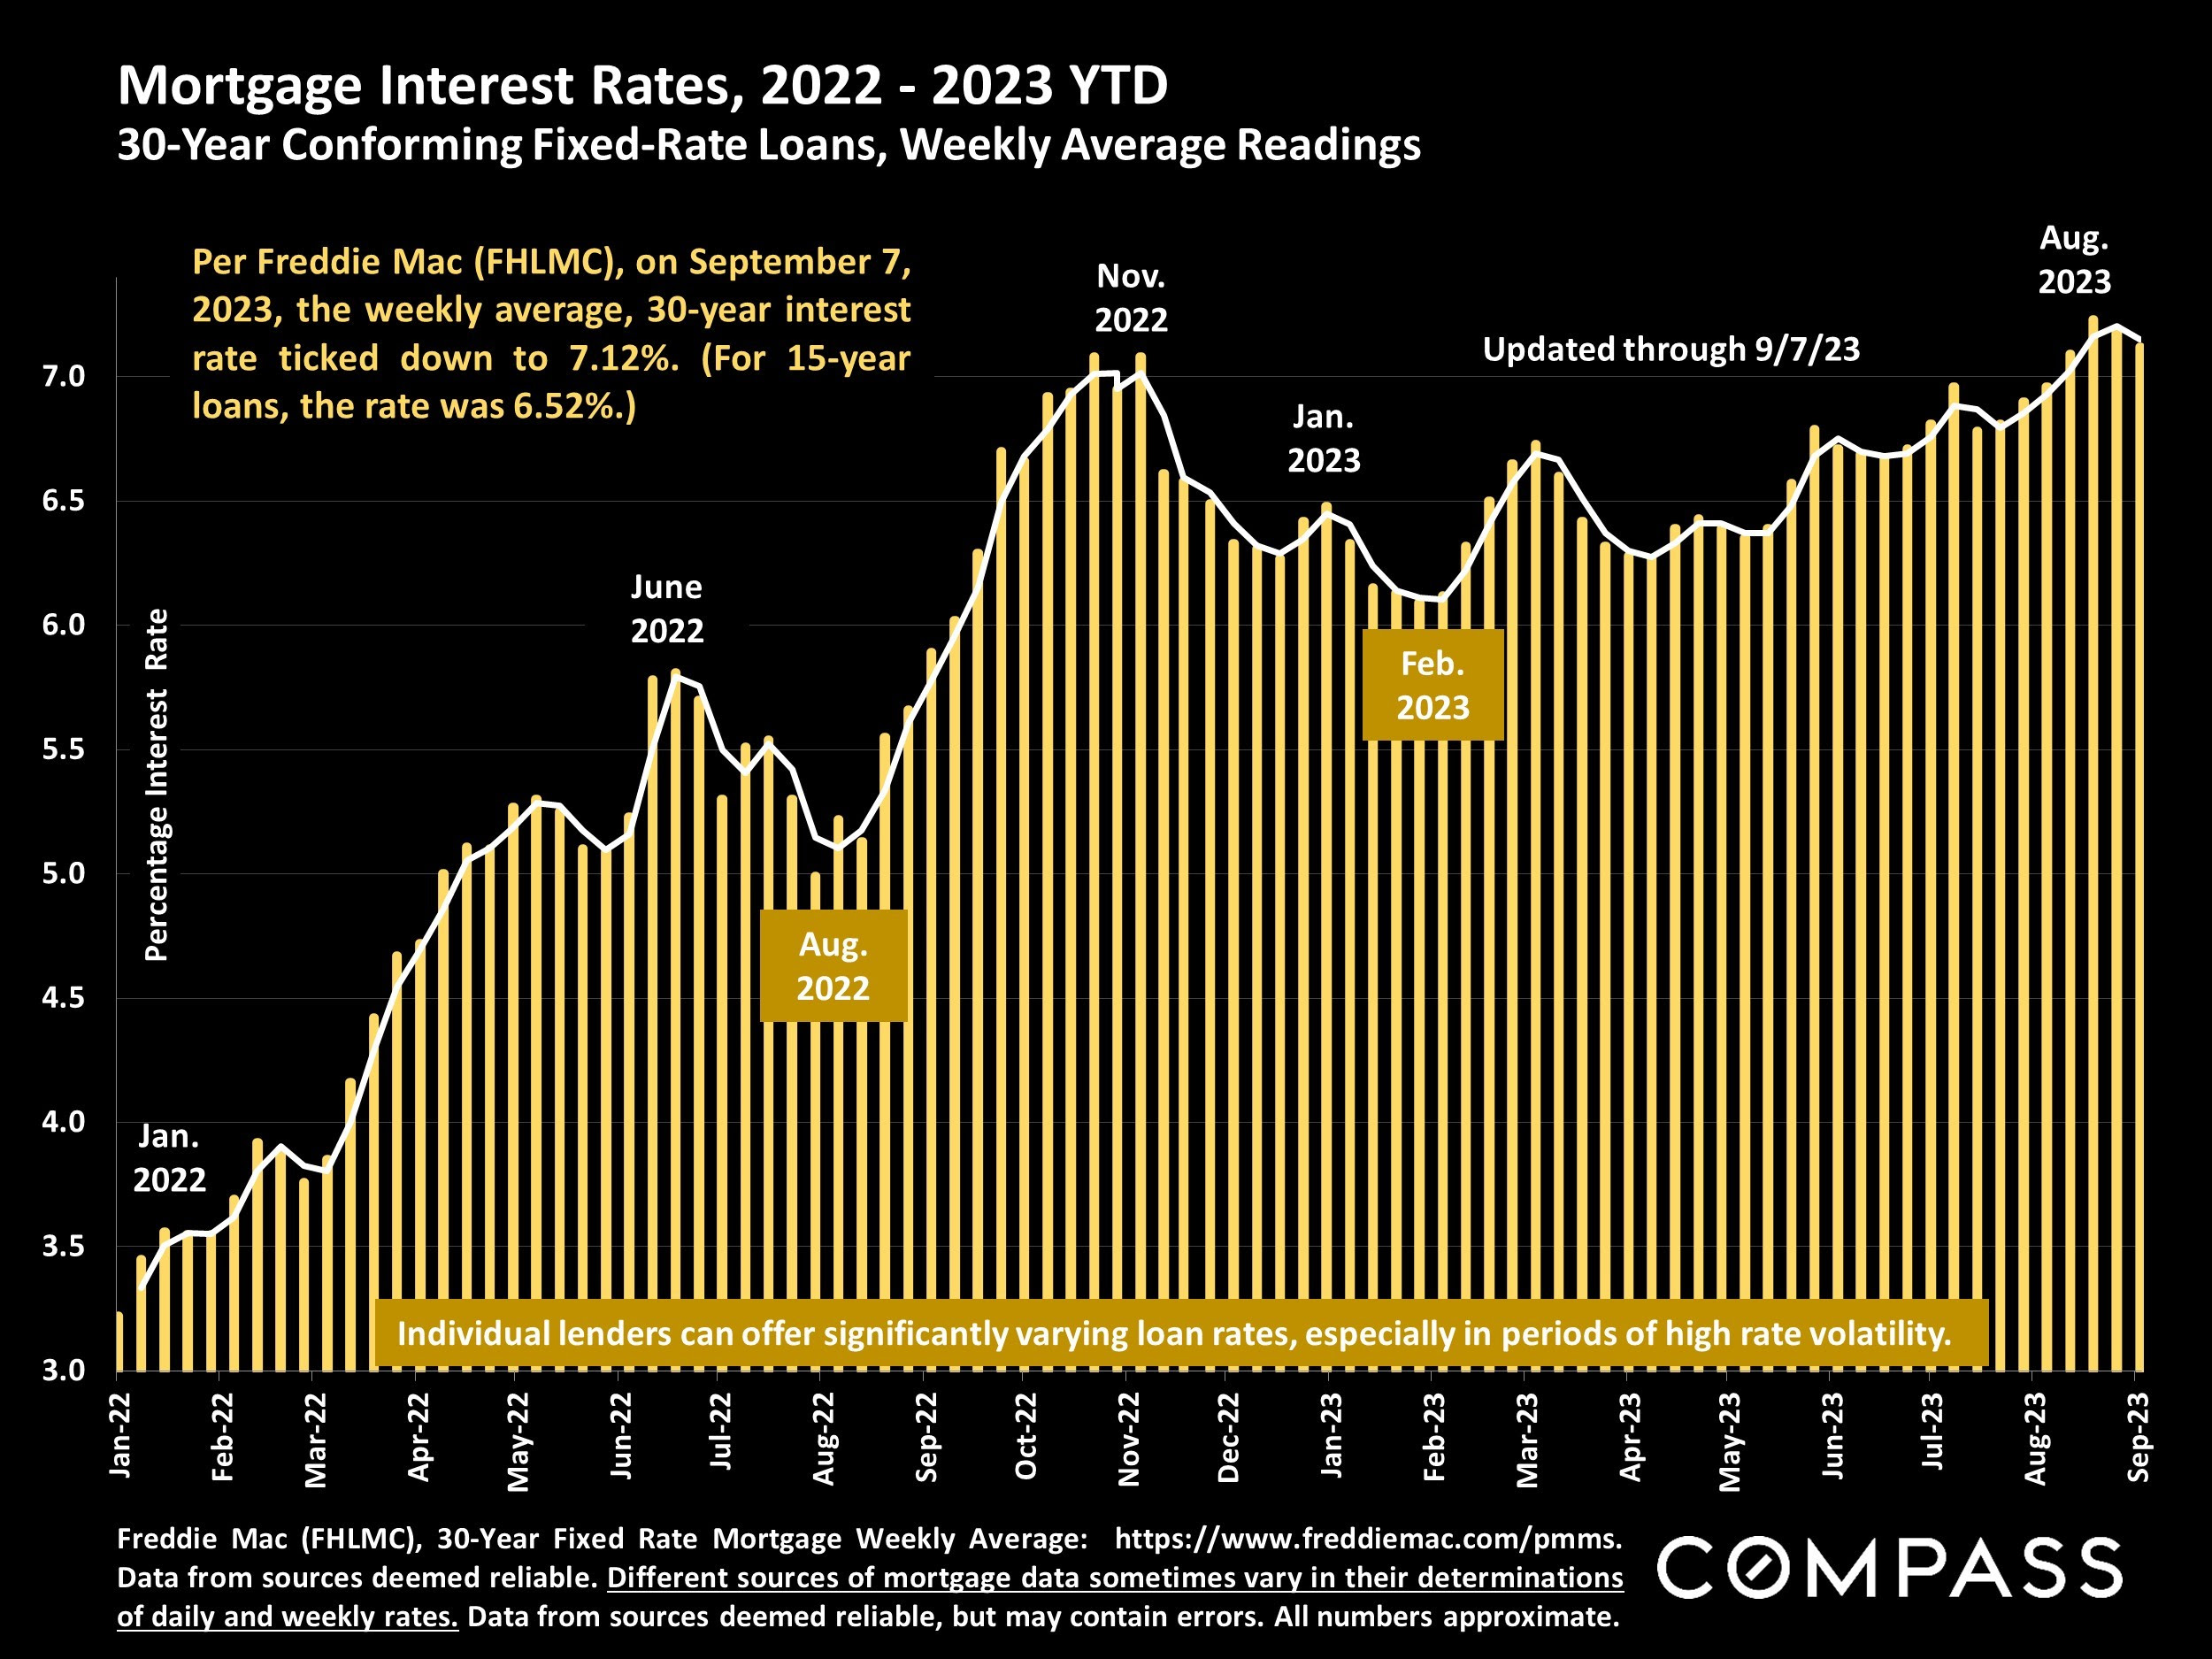
Chart of weekly 30-year mortgage rates from 2022 to September 2023, rising from about 3% to 7.12%.

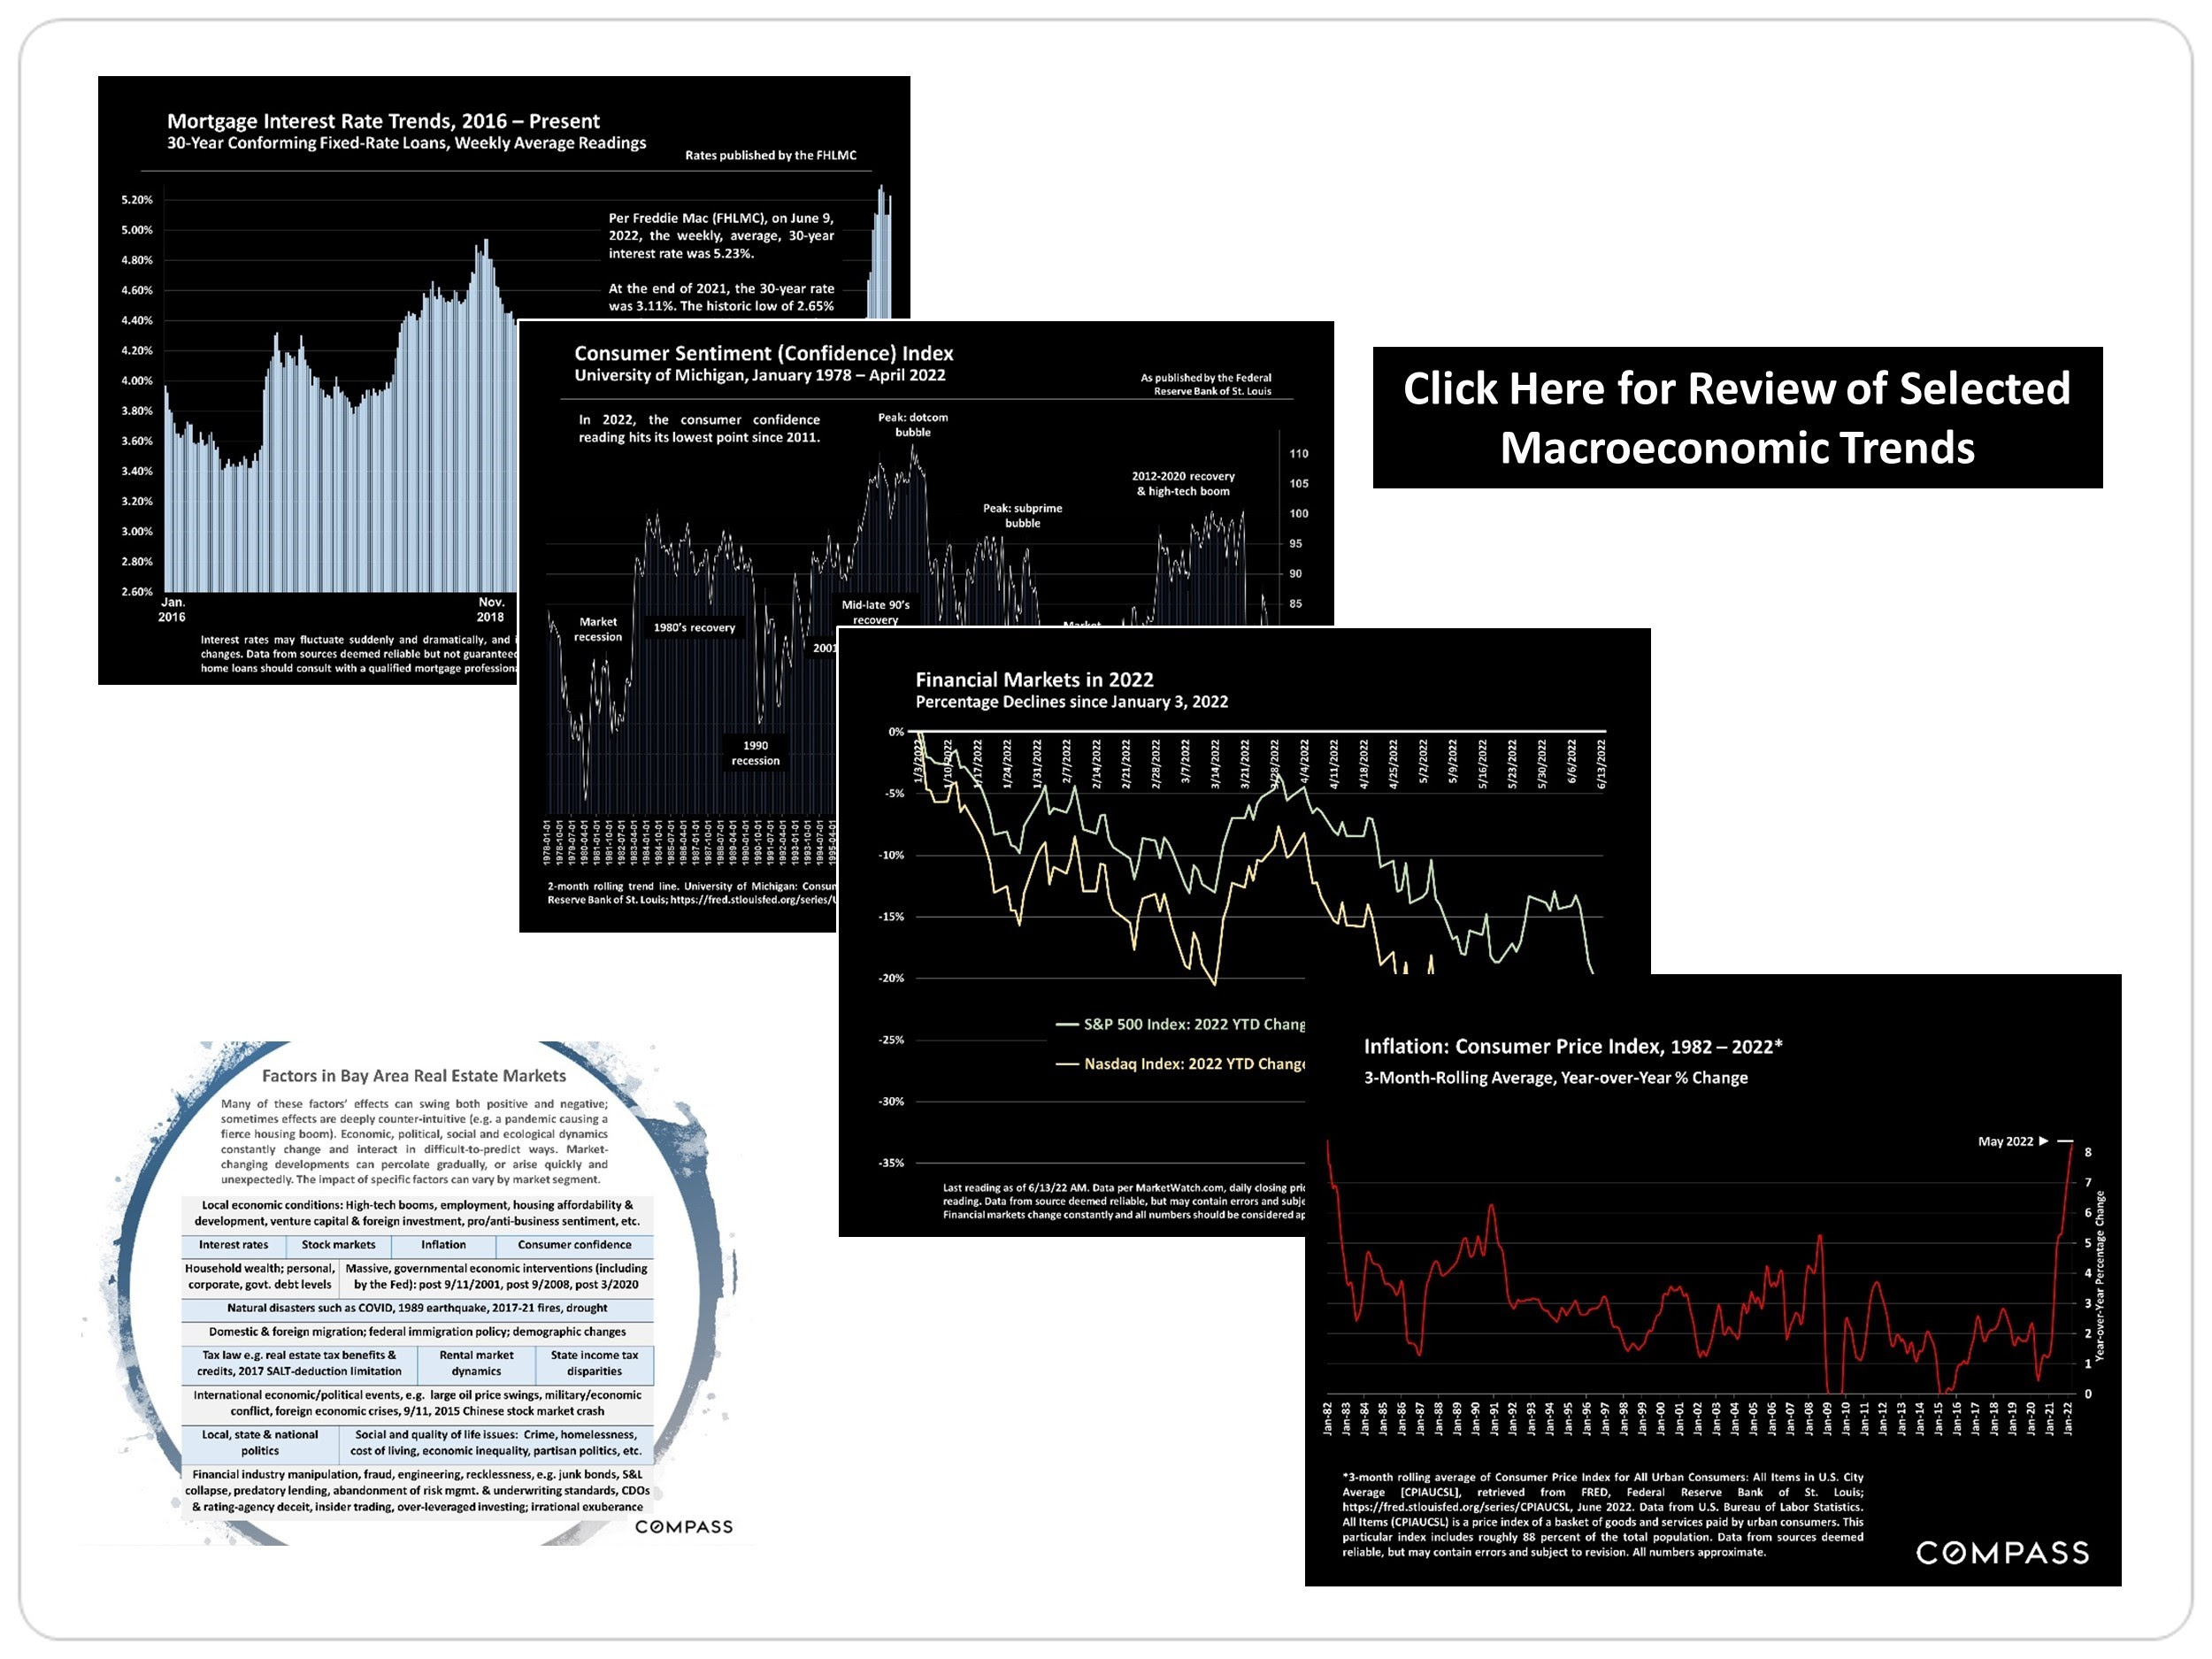
Macroeconomic charts on mortgage rates, consumer confidence, financial markets, inflation, and factors affecting Bay Area real estate.

Work With Jason

Drawing on his decade of experience in finance, investment management, and holistic financial planning, and as a Chartered Financial Analyst ( CFA ® ) charterholder, he leverages his financial acumen and analytical focus to help his clients navigate the sophisticated San Francisco market.
Contact
Follow Us