San Francisco Real Estate Market Update | October 2024

San Francisco Real Estate October 2024 Report cover with Victorian homes, bay water, and the COMPASS wordmark.

October 2024 San Francisco housing market update on interest rates, buyer demand, listings, and seasonal trends.

Chart tracing the federal funds rate since 1981, with annotations on economic events and Federal Reserve actions.

Chart of San Francisco quarterly median house prices, 2012–2024, peaking at $2 million in Q2 2022.

Bar chart of San Francisco condo median sales prices by quarter, 2012–2024; Q3 2024 is $1,147,500.

San Francisco home sales infographic comparing counts, median sizes, and prices by property type.

San Francisco residential market table comparing price segments and property types.

Chart of San Francisco new listings, December 2019–September 2024, showing seasonal peaks and a September 2024 count near 800.

San Francisco monthly active and coming-soon home listings, charted from February 2022 through October 2024.

San Francisco chart of listings accepting offers, August 2021–September 2024, with a September 2024 rebound.

Chart of San Francisco active-listing price reductions from 2018 to September 2024, with October peaks and pandemic period marked.

San Francisco monthly home sales chart through September 2024, with gold bars, seasonal annotations, and market commentary.

Chart of San Francisco luxury condo and co-op sales since 2018, showing a pandemic-era peak and data through September 2024.

Chart of San Francisco $5 million-plus home sales from 2018 to September 2024, with a pandemic-era peak.

Bar chart of San Francisco home sales over list price by quarter, 2018–2024, with market-event annotations.

Chart comparing San Francisco house and condo sale prices to original list prices by quarter, 2018–2024.

Chart comparing San Francisco quarterly days on market for condos and houses from 2019 to 2024.

Chart shows insurance difficulties increasing across California property locations from 2023 to 2024, highest for vacation homes at 51%.

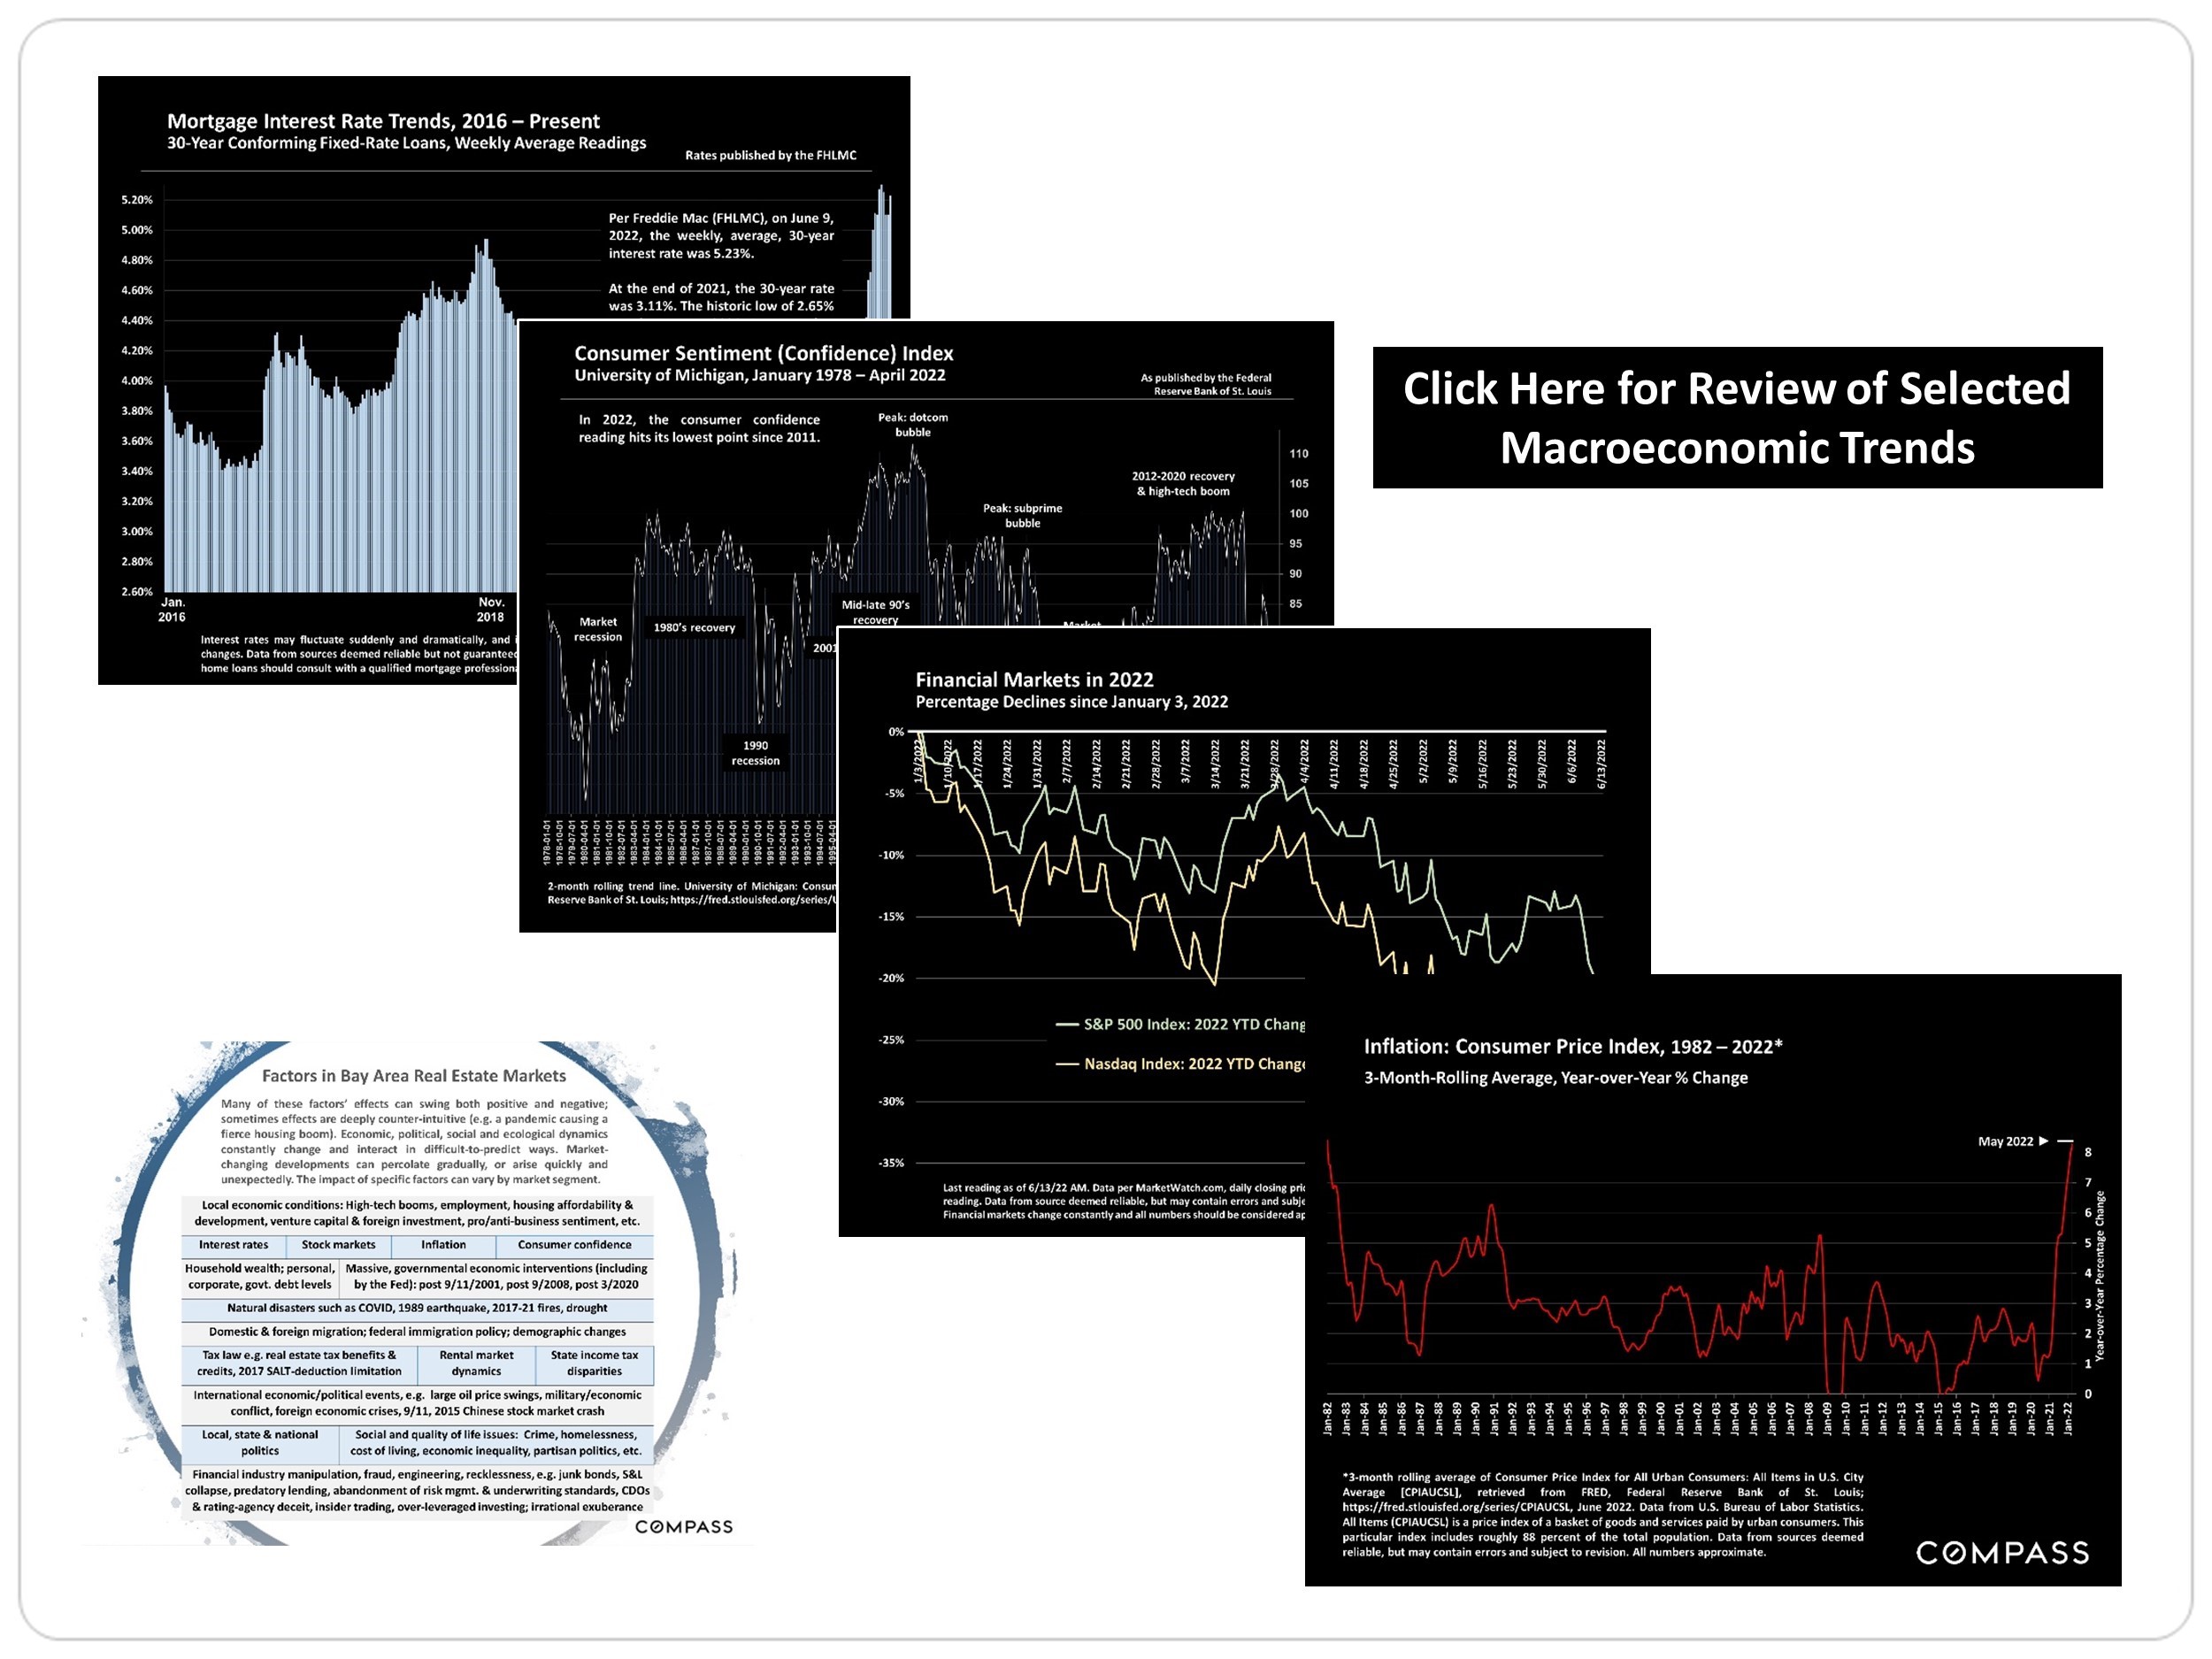
Economic charts on mortgage rates, consumer sentiment, markets, and inflation alongside a Bay Area real estate factors infographic.

Source: Compass


Work With Jason

Drawing on his decade of experience in finance, investment management, and holistic financial planning, and as a Chartered Financial Analyst ( CFA ® ) charterholder, he leverages his financial acumen and analytical focus to help his clients navigate the sophisticated San Francisco market.
Contact
Follow Us