San Francisco Real Estate Market Update | October 2023

Economic indicators have been challenging since the fall selling season began: Interest rates continued to rise through early October and stock markets generally continued to fall from mid- summer, YTD highs. Markets remain volatile and hard to predict, often reacting negatively to positive economic news (such as employment numbers) as they wait for new inflation numbers and try to parse the posible reaction of the Fed. Any definitive impacts on real estate of these recent developments, should they continue, won't substantially show up until Q4 data begins to become available, and, of course, volatility also means that indicators can turn around quickly.


San Francisco real estate October 2023 report cover with a city panorama and Compass branding.
San Francisco market report summarizing Q3 2023 housing trends and the California housing forecast for 2024.
Chart of San Francisco monthly new listings, December 2019–September 2023, with seasonal September peaks.
San Francisco monthly home sales chart, January 2019–September 2023, with green bars and seasonal annotations.
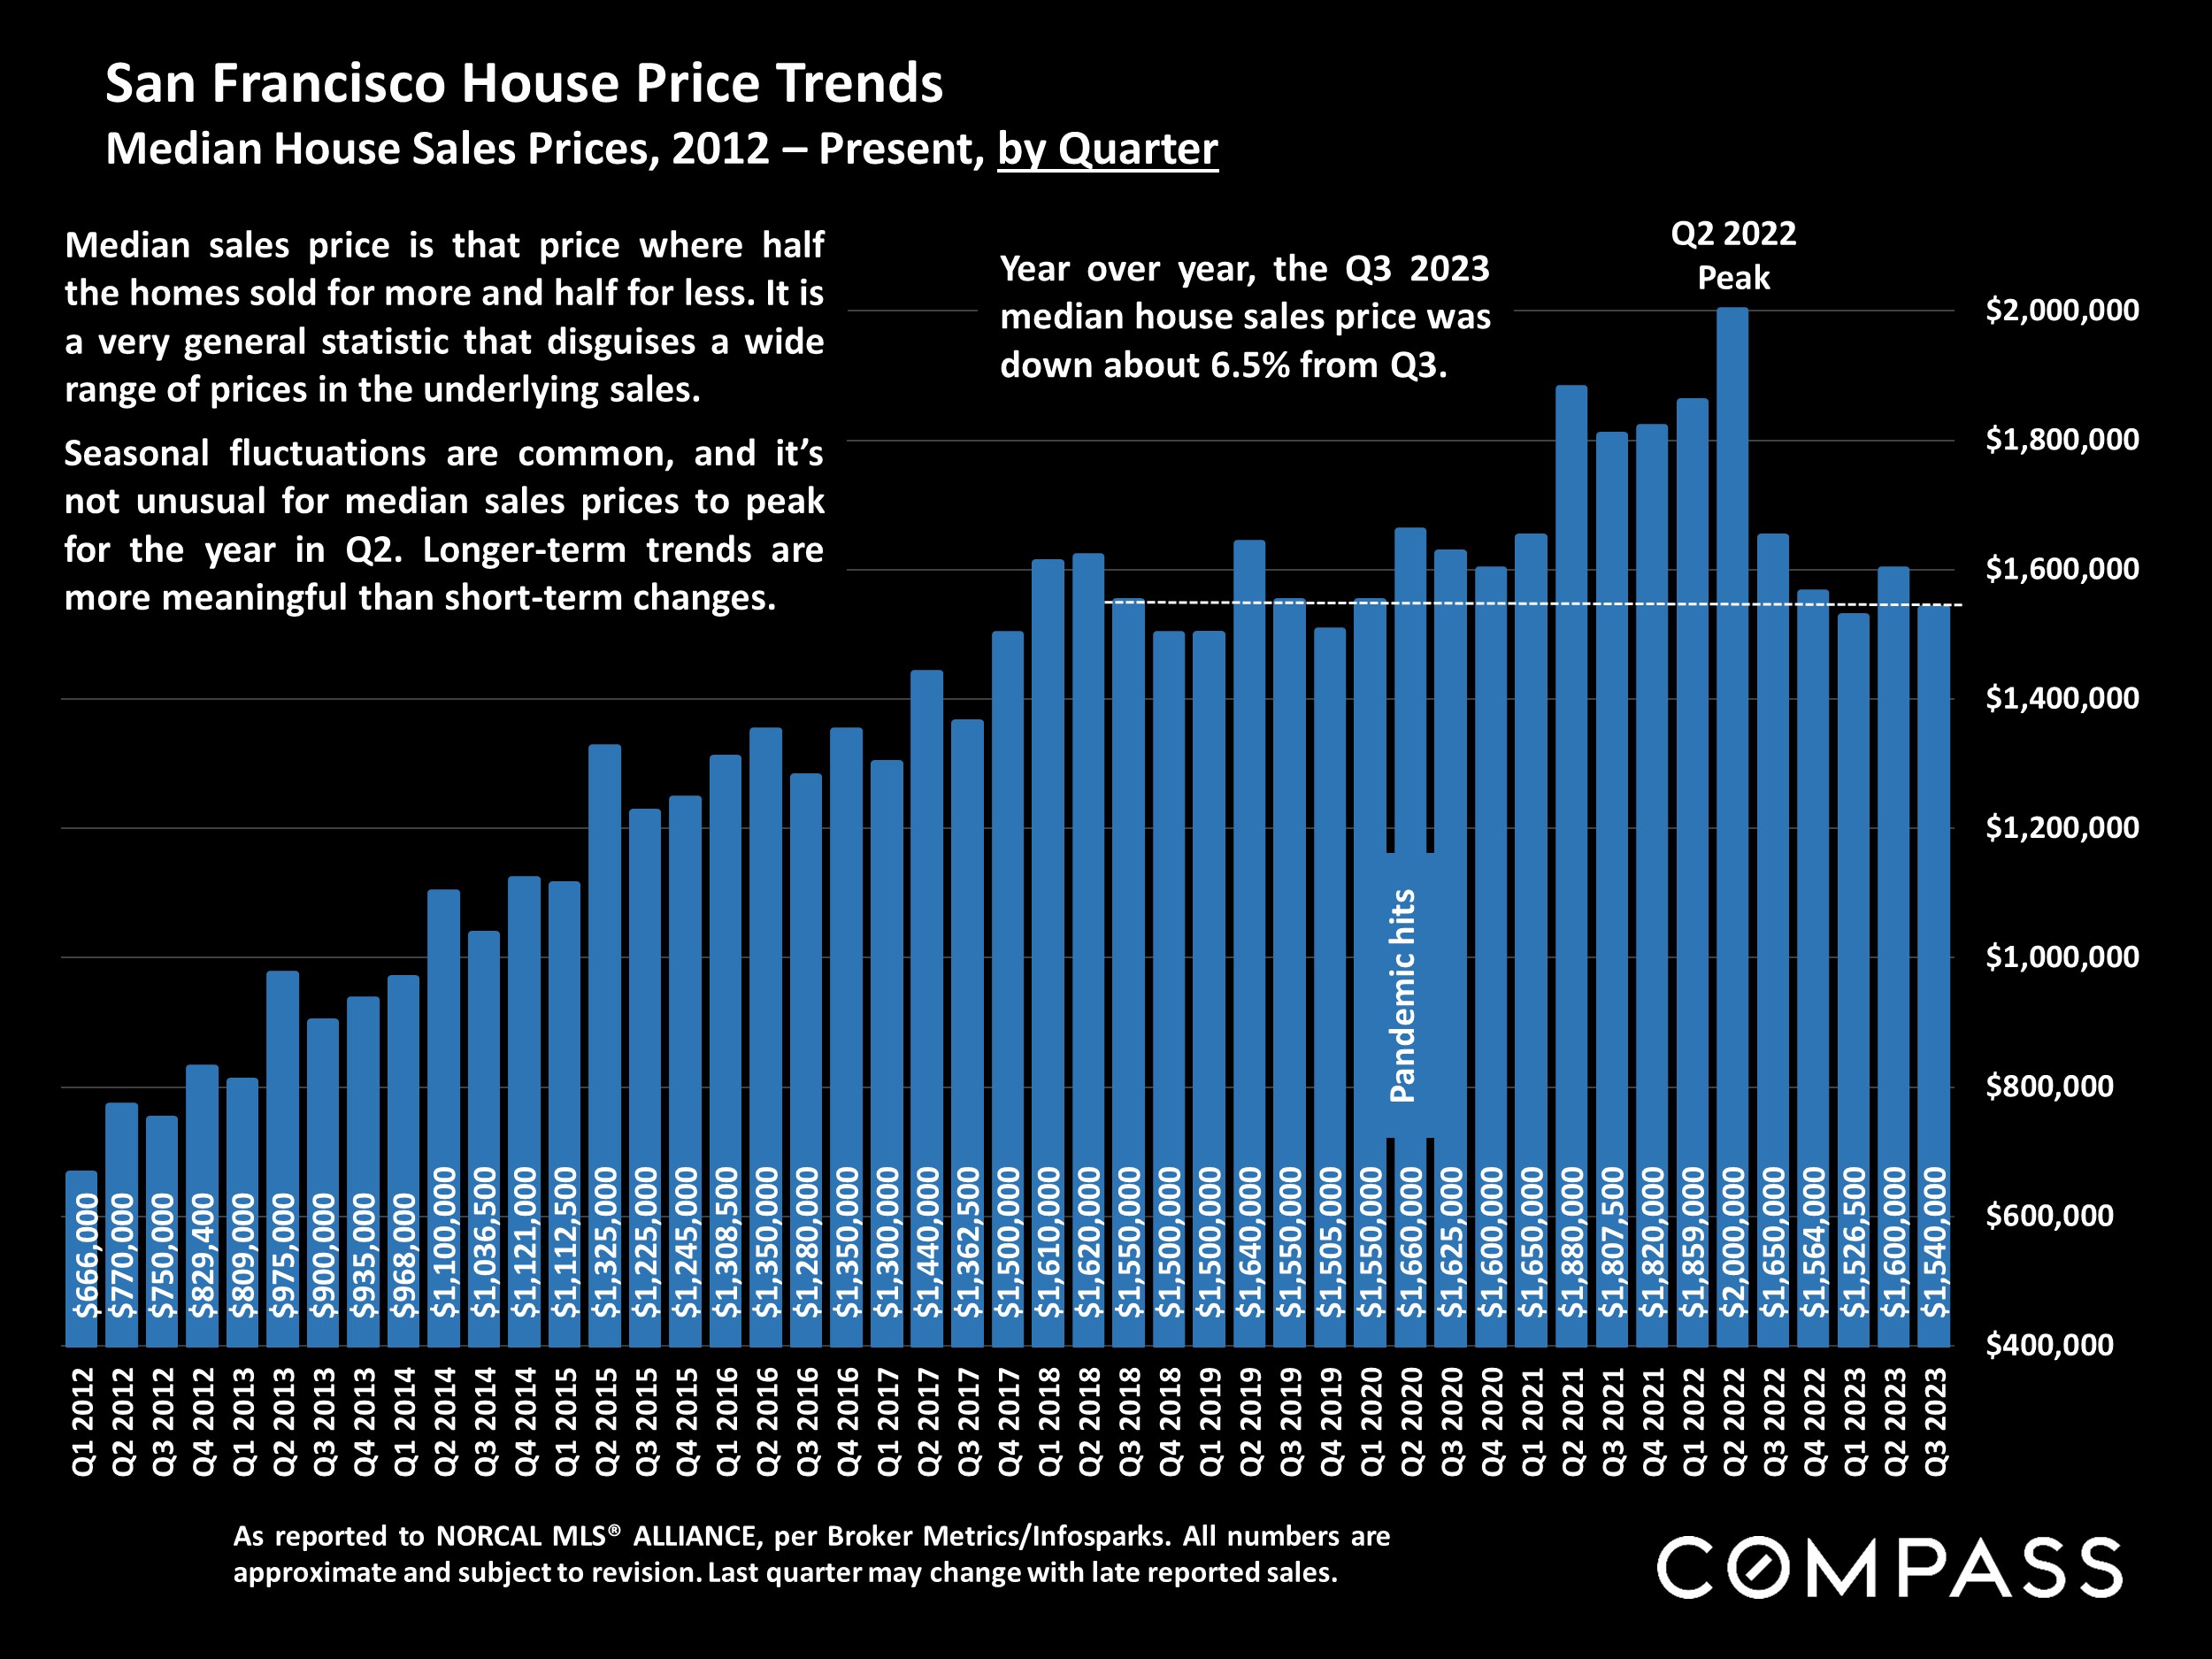
Chart of San Francisco quarterly median house prices, peaking at $2 million in Q2 2022 and declining by Q3 2023.
Chart of San Francisco quarterly median condo prices from 2012 to Q3 2023, peaking near $1.3 million in Q2 2022.
San Francisco residential market table comparing sales and listing metrics by price range and property type.
San Francisco home sales infographic with stacked bars by Realtor District and a numbered district map.
Bar chart comparing quarterly median house sale prices across four San Francisco district groups, Q3 2020–Q3 2023.
Chart of quarterly median house prices in four San Francisco district groups, Q3 2020–Q3 2023.
Chart comparing Q3 2023 three-bedroom house prices and median sizes across 11 Greater Bay Area counties.
Bar chart comparing San Francisco condo median sale prices across three district groups, Q3 2020–Q3 2023.
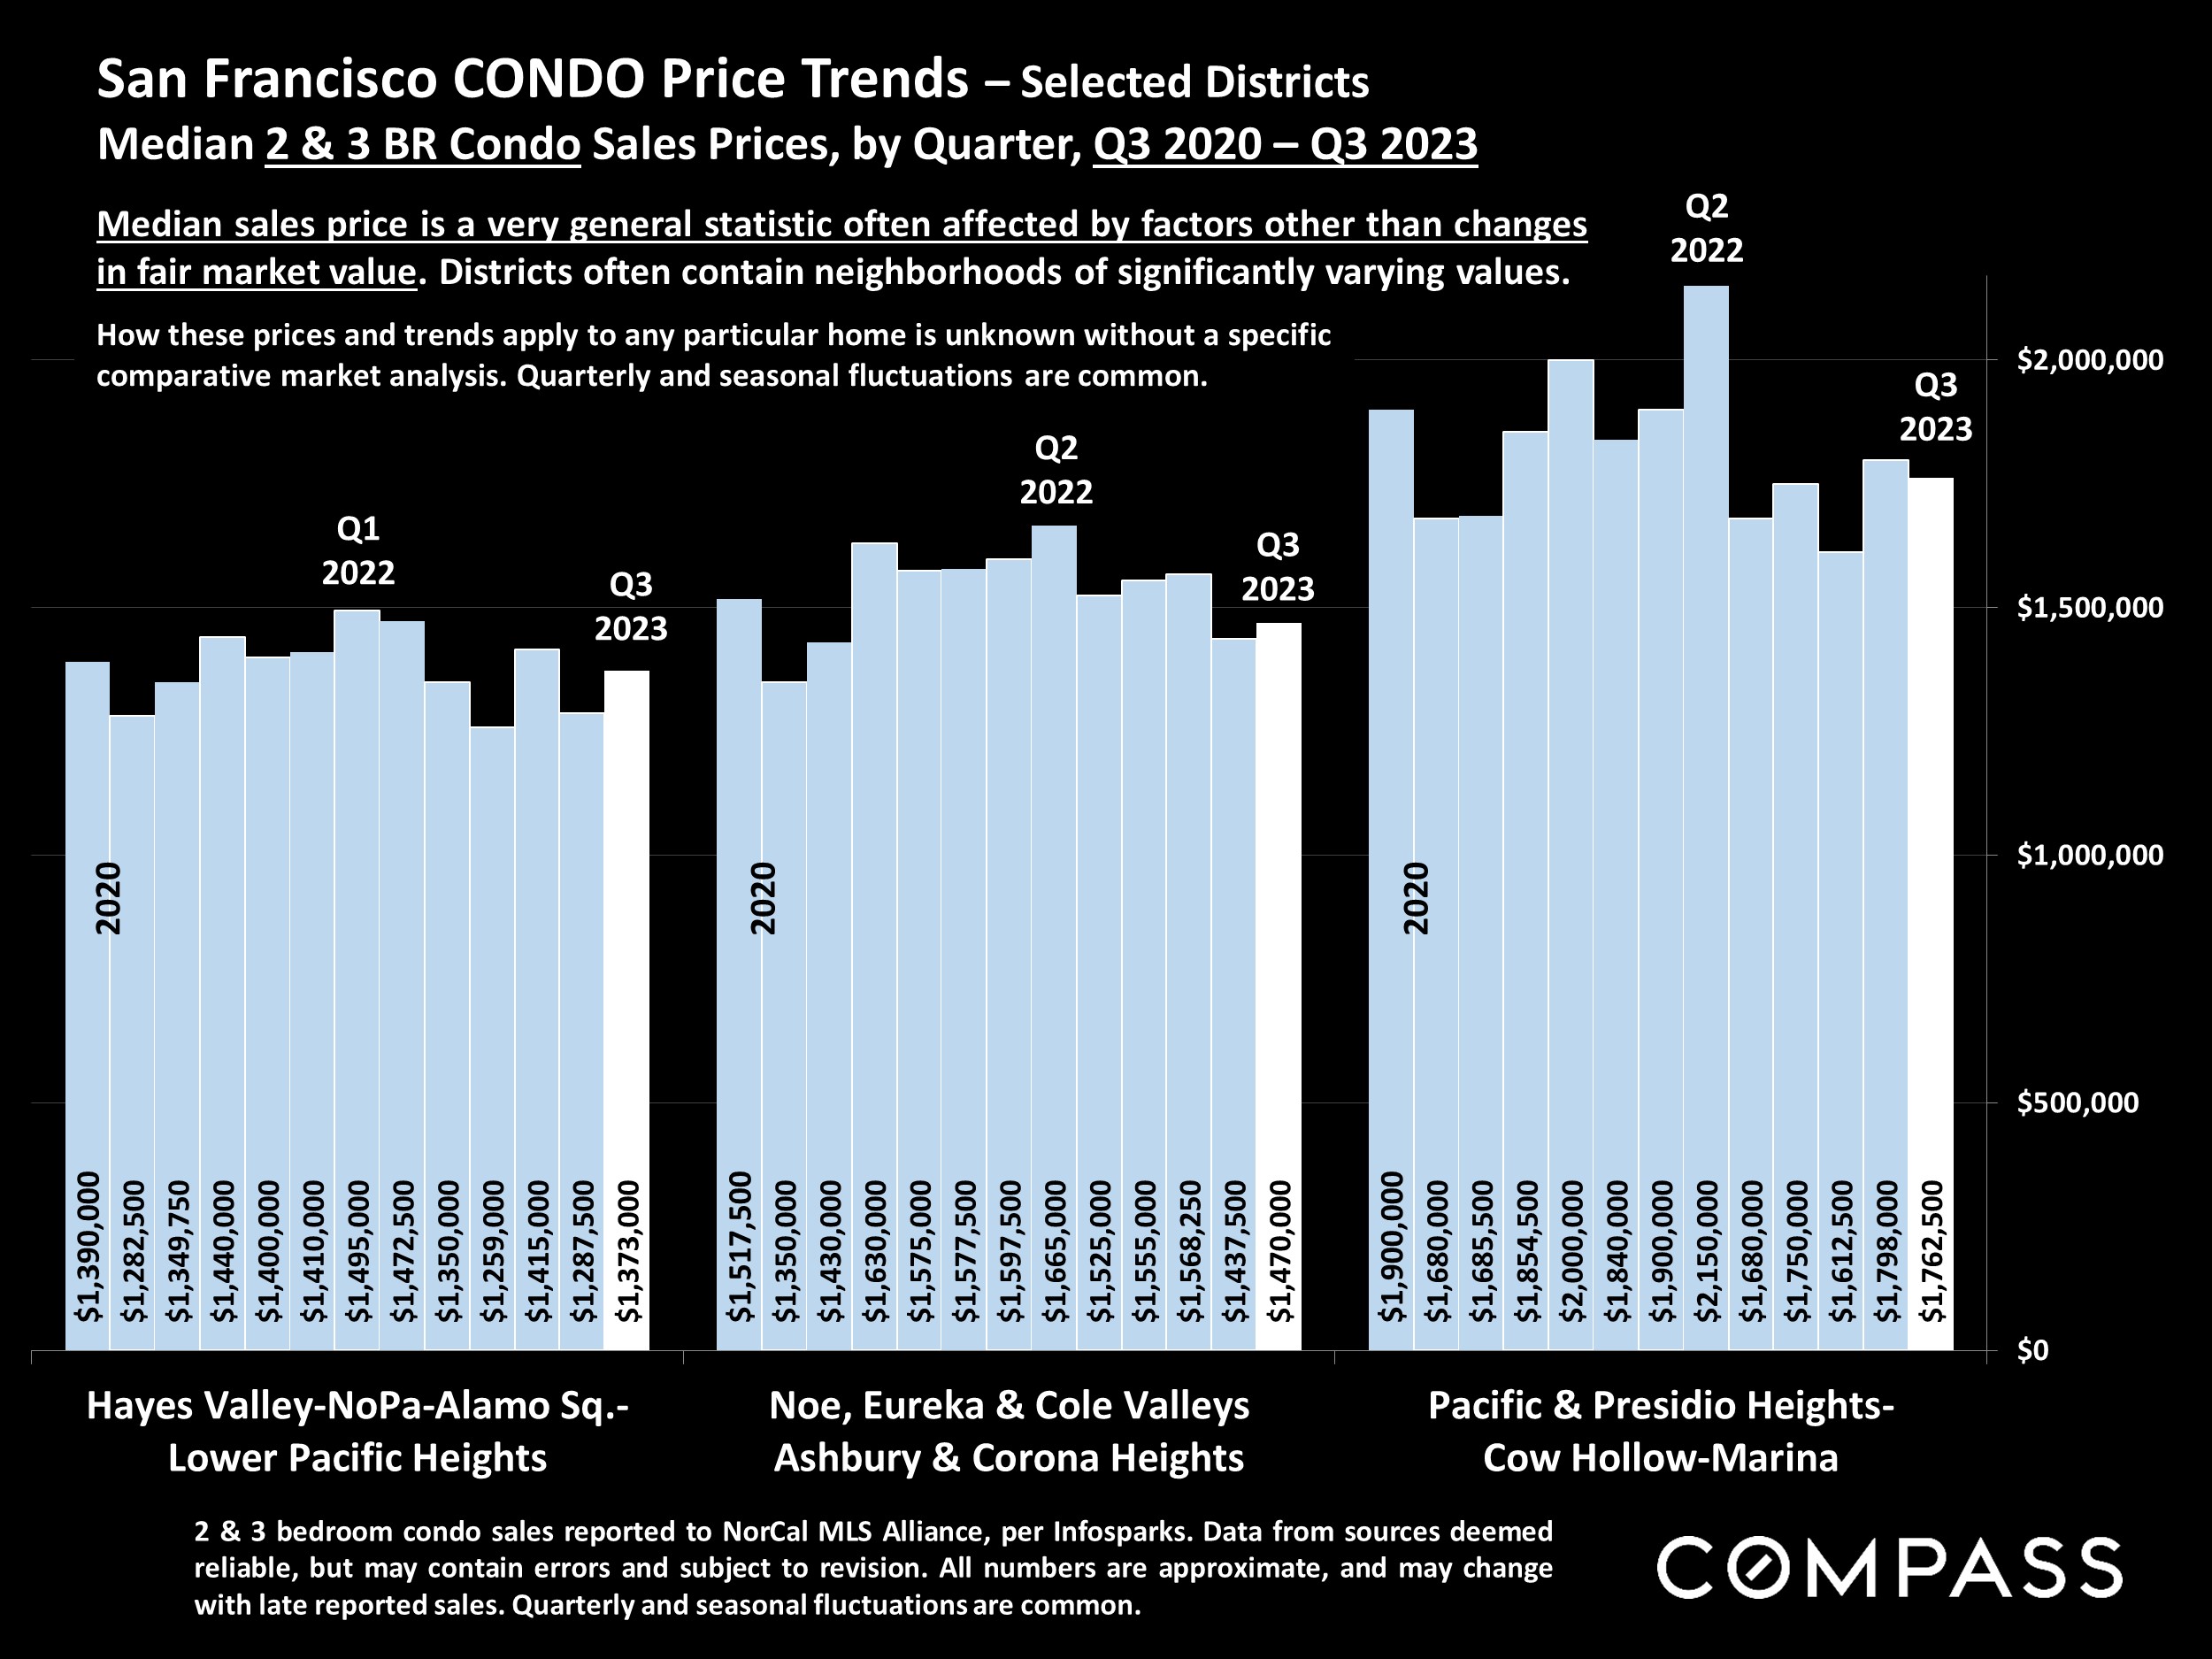
Bar chart comparing quarterly median two- and three-bedroom condo prices across three San Francisco district groups, Q3 2020–Q3 2023.
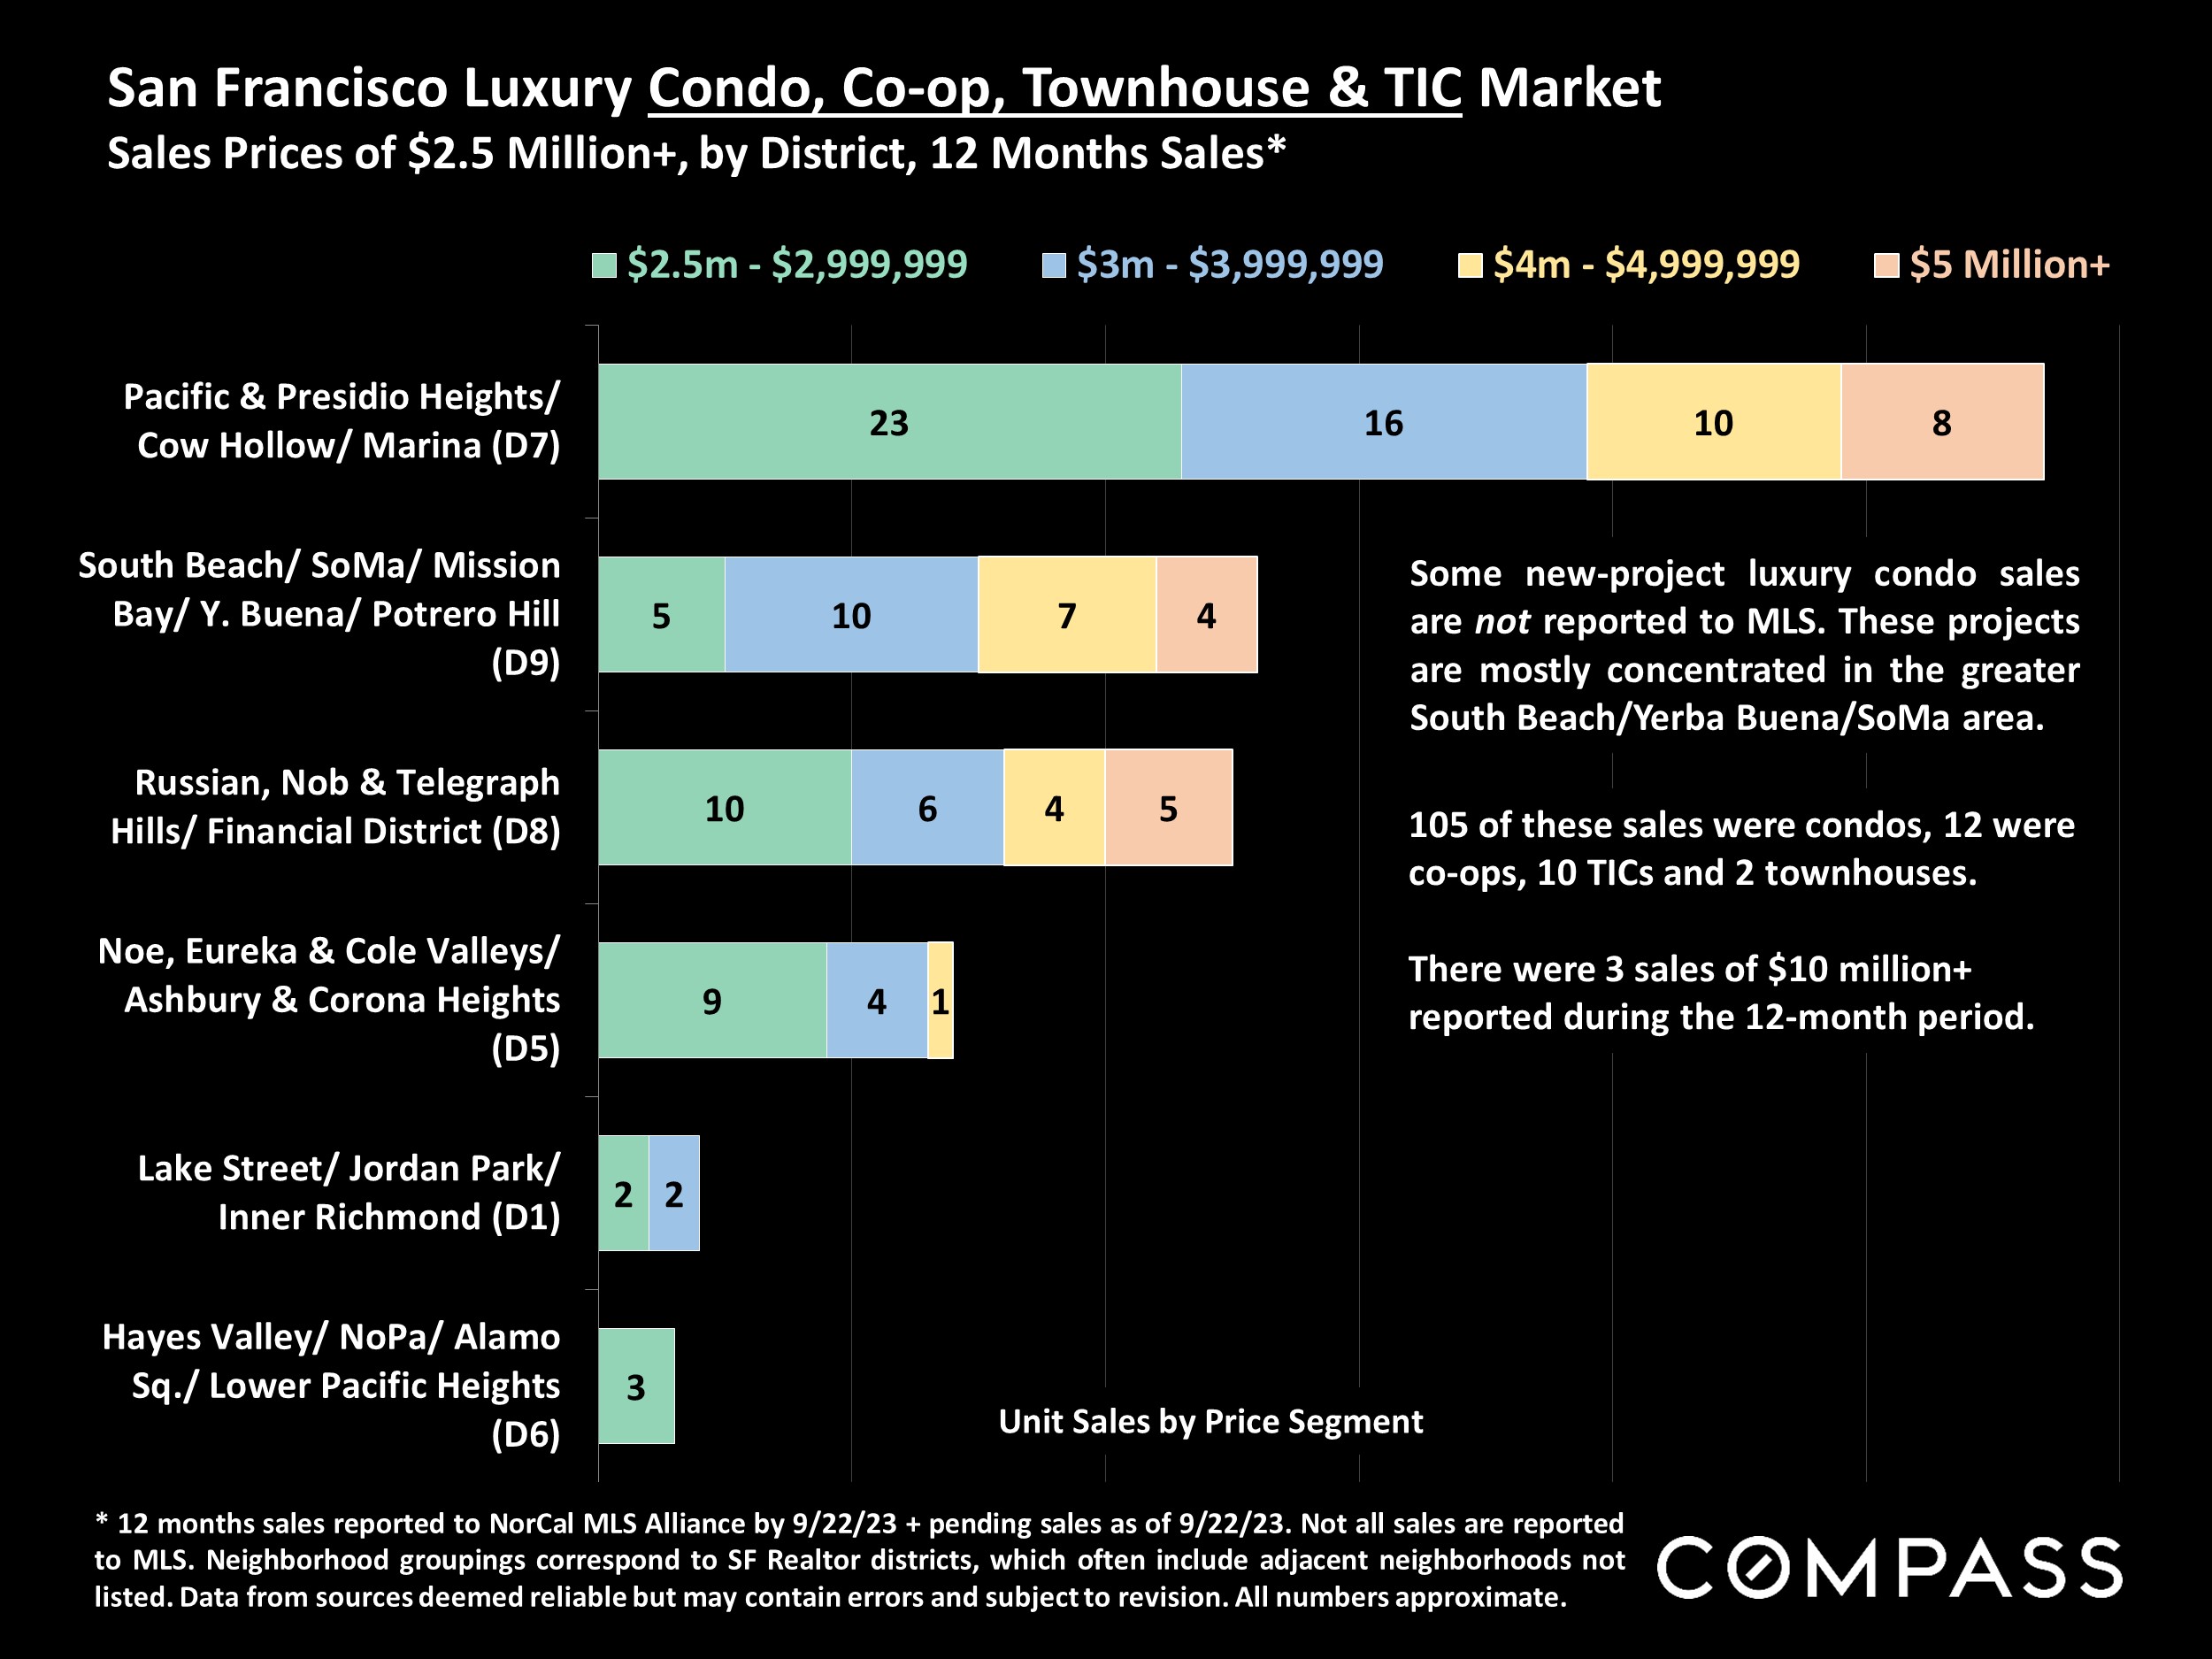
San Francisco luxury home sales chart by district and price segment, with 12-month counts and market notes.
Chart of San Francisco luxury home sales by district and price segment; Pacific Heights area has the most sales.
Chart of San Francisco active listings, showing 1,471 in October 2023 after a rise from January’s 752.
Chart of San Francisco pending listings, January 2019–September 2023, with seasonal peaks and a January 2023 low.
San Francisco monthly active-listing price reductions, shown in a bar chart from 2018 to 2023.
Bar chart comparing monthly San Francisco home sales over $3 million from January 2019 through September 2023.
Table of highest reported 2023 home sale prices across selected Bay Area markets, from Woodside at $44.5 million to Oakland at $5 million.
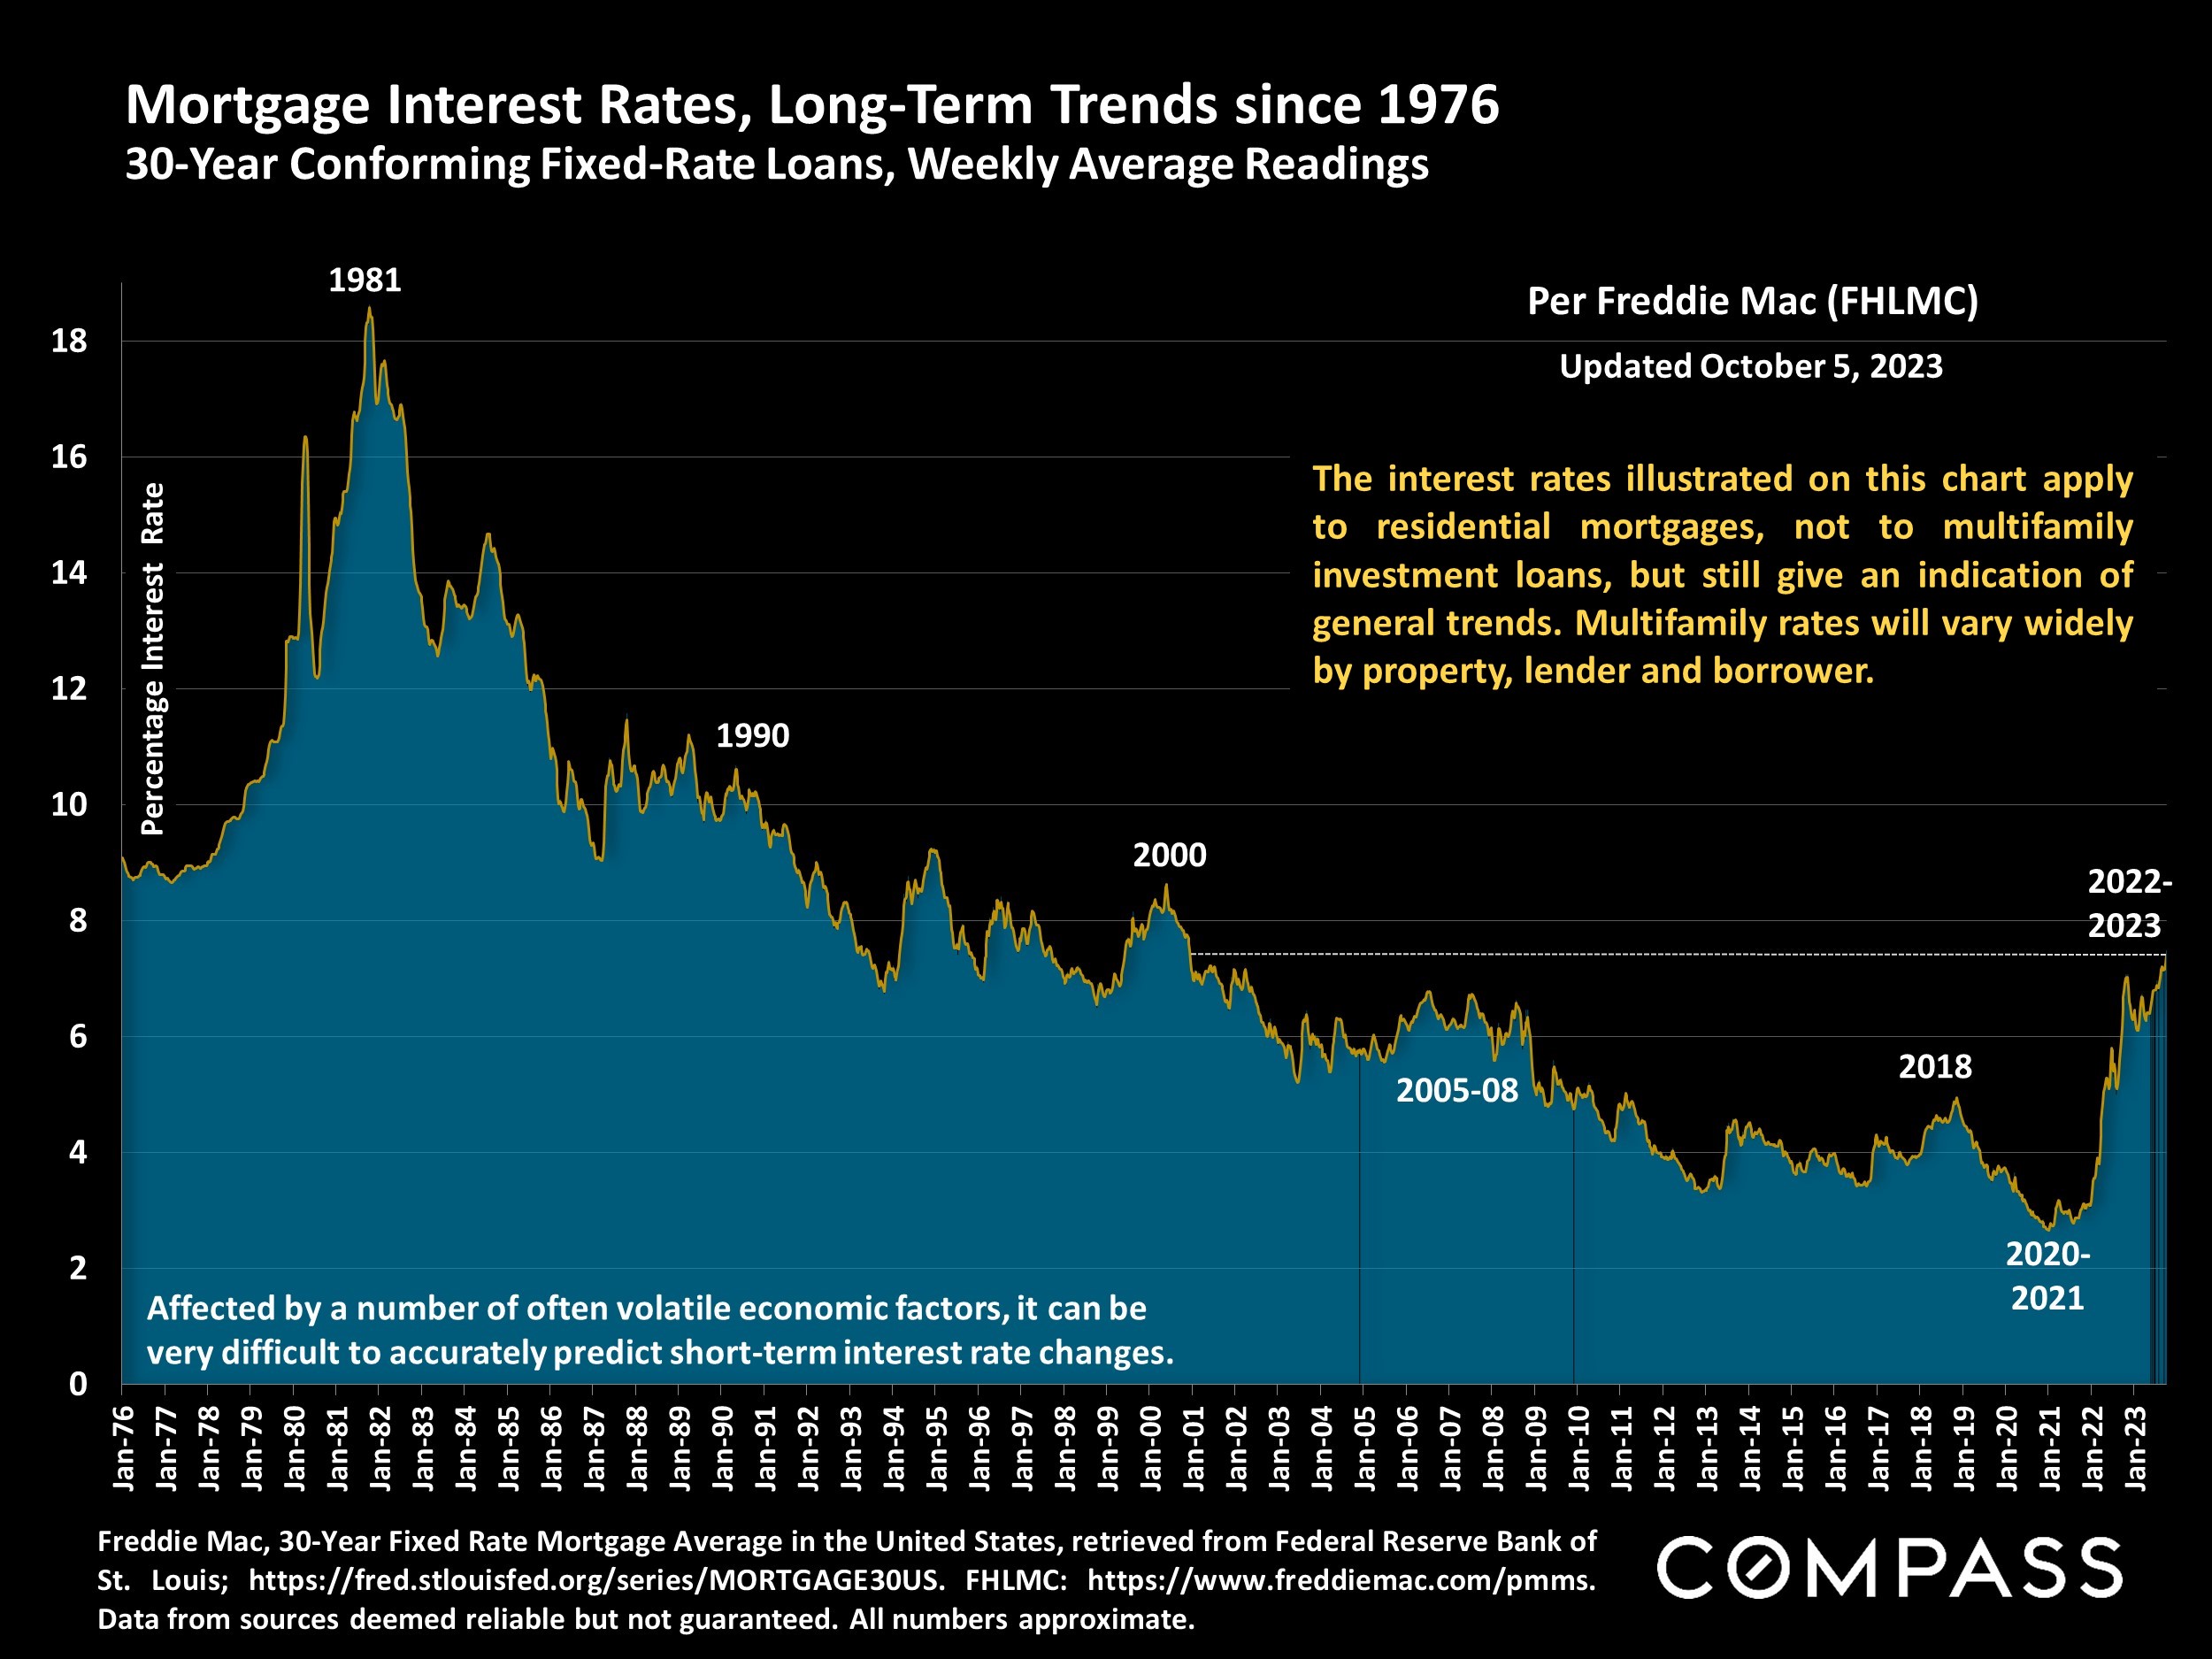
Chart of U.S. 30-year mortgage rates from 1976 to 2023, peaking in 1981 and rising sharply after 2021.
San Francisco census infographic summarizing housing, income, employment, education, birthplace, and languages with percentages.
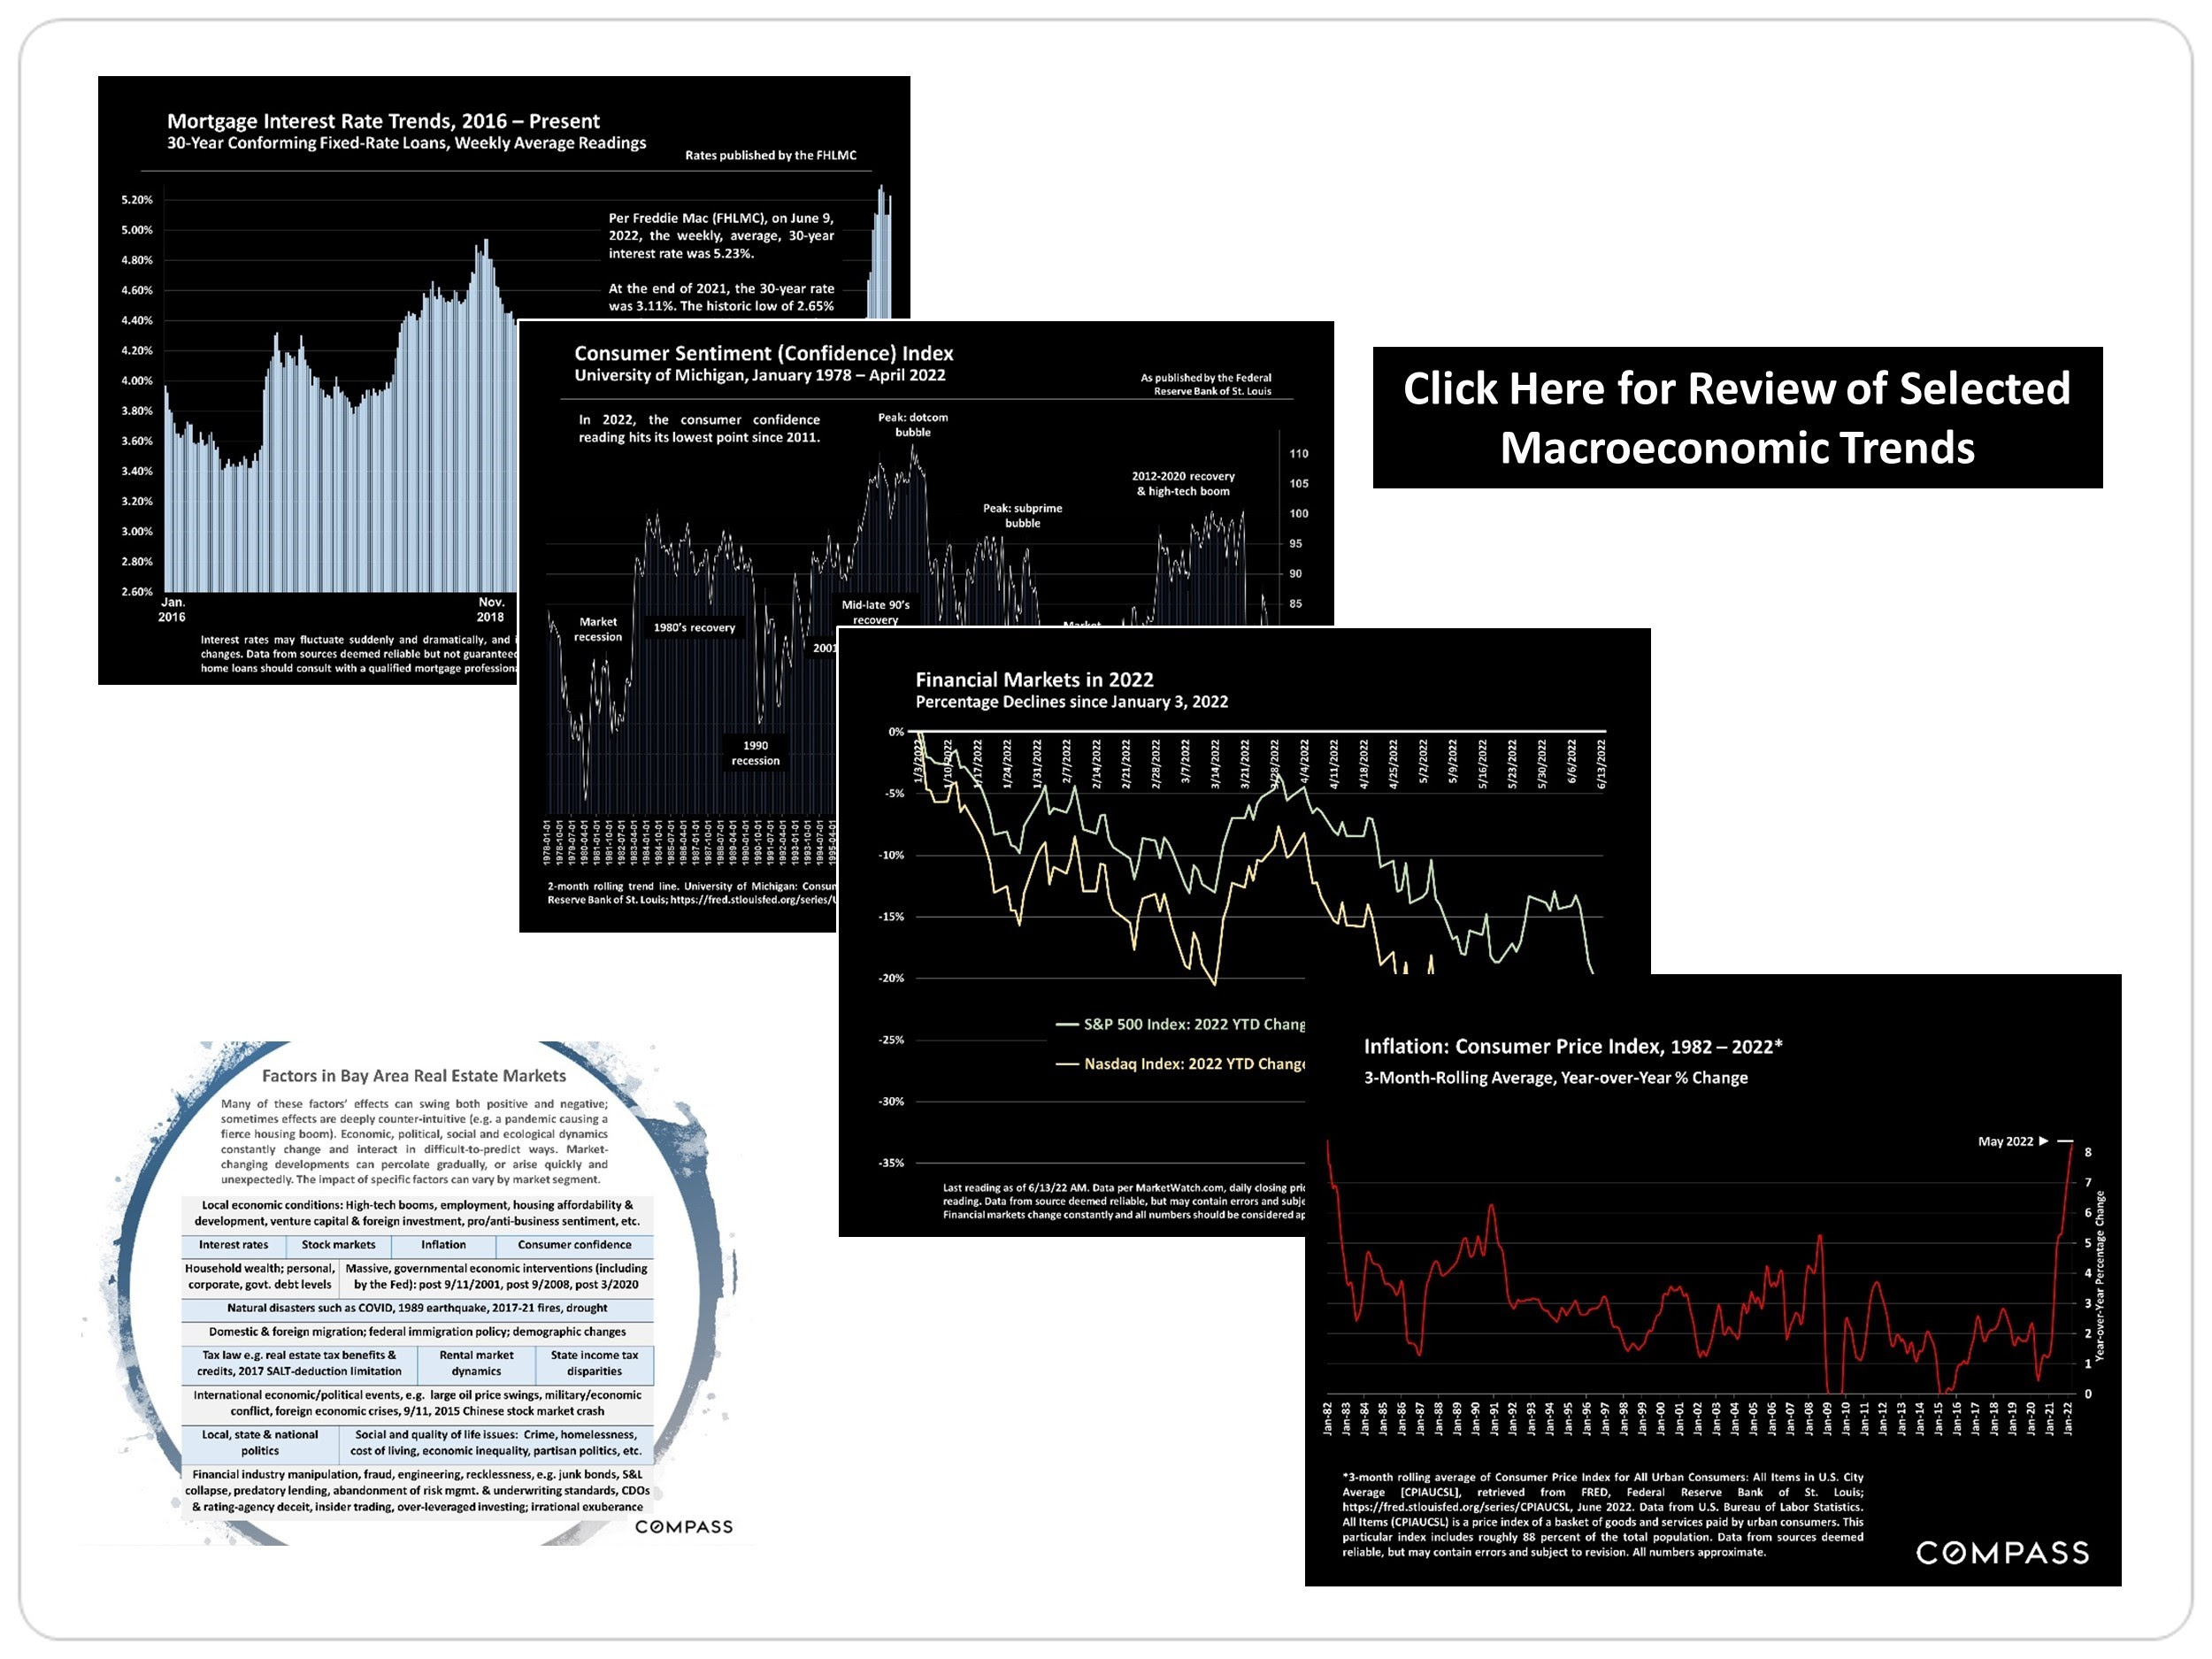
Macroeconomic charts on mortgage rates, consumer confidence, financial markets, inflation, and factors affecting Bay Area real estate.

Work With Jason

Drawing on his decade of experience in finance, investment management, and holistic financial planning, and as a Chartered Financial Analyst ( CFA ® ) charterholder, he leverages his financial acumen and analytical focus to help his clients navigate the sophisticated San Francisco market.
Contact
Follow Us