San Francisco Real Estate Market Update | June 2023

A review of house and condo prices, appreciation rates, supply and demand, overbidding, time and market, luxury home sales and macroeconomic factors pertinent to the San Francisco real estate market.

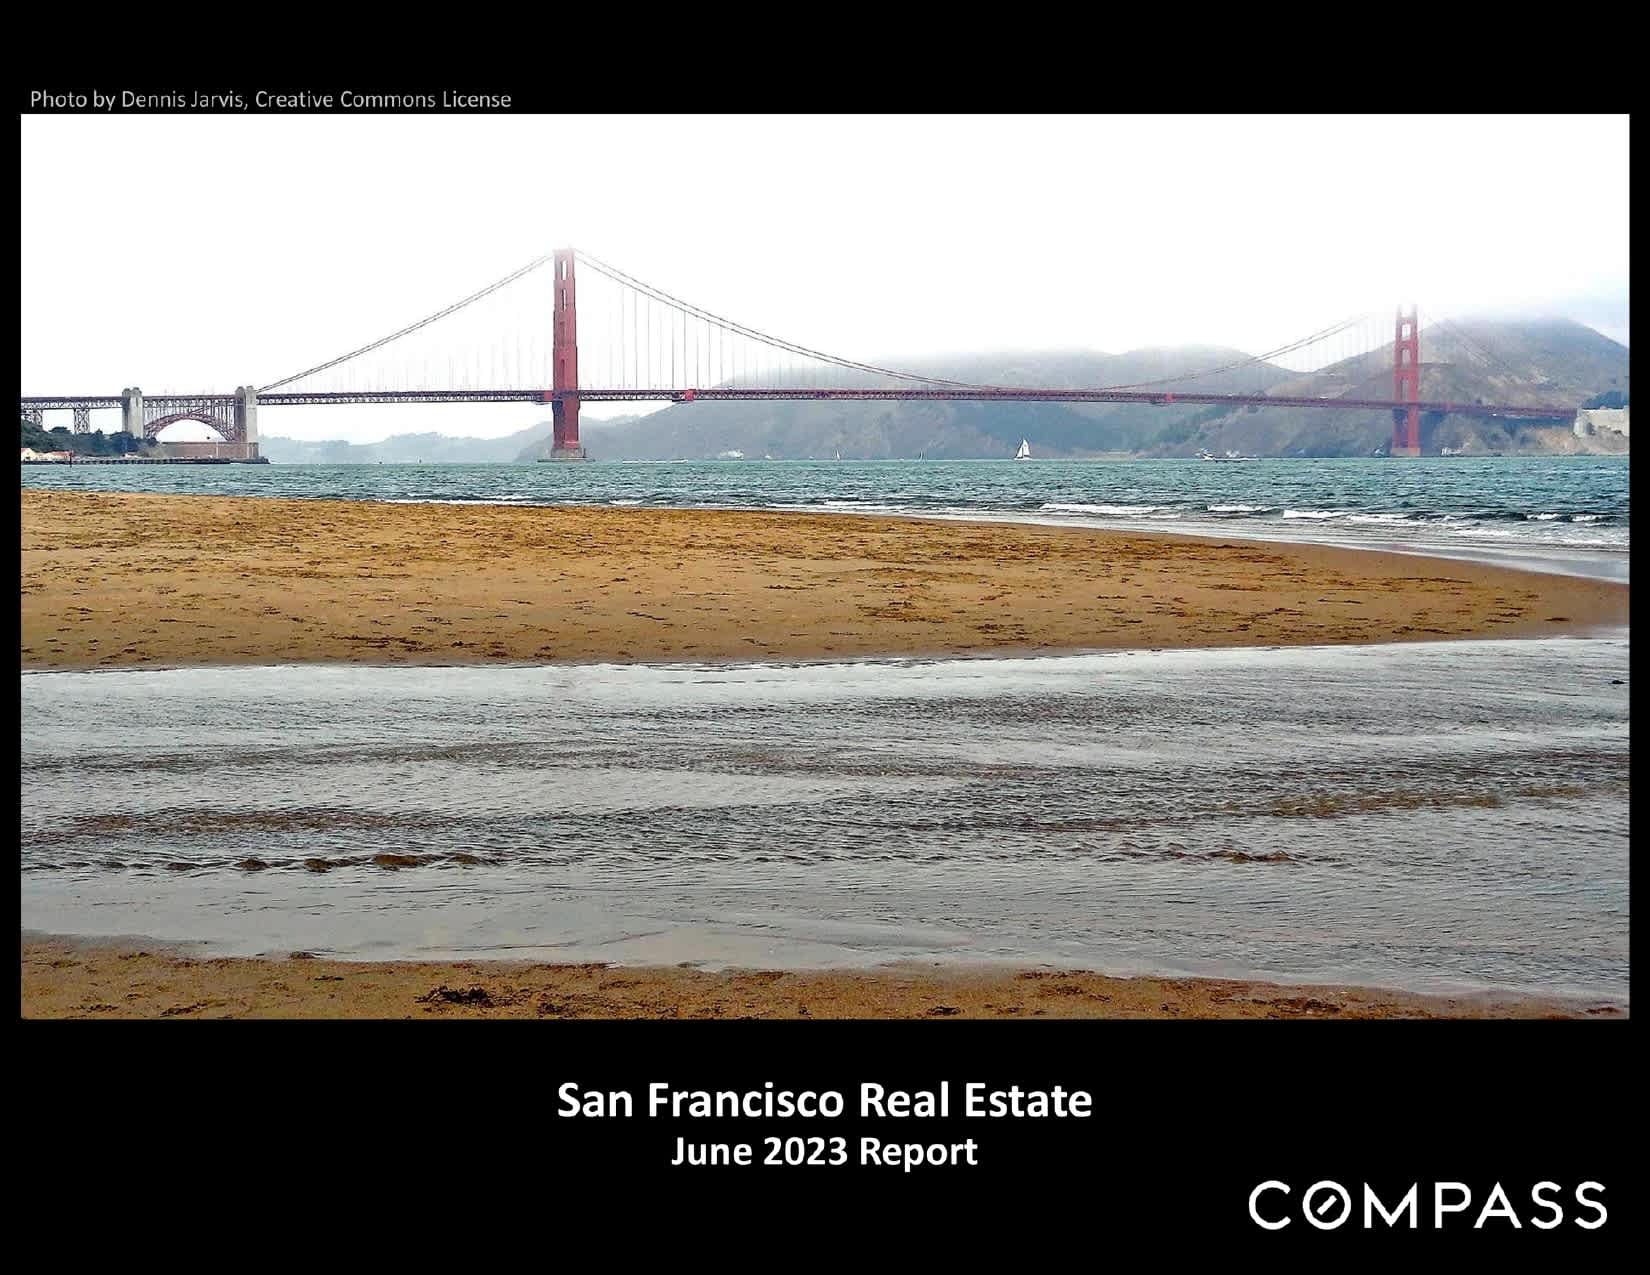
June 2023 San Francisco Real Estate Report, featuring the Golden Gate Bridge and COMPASS branding.

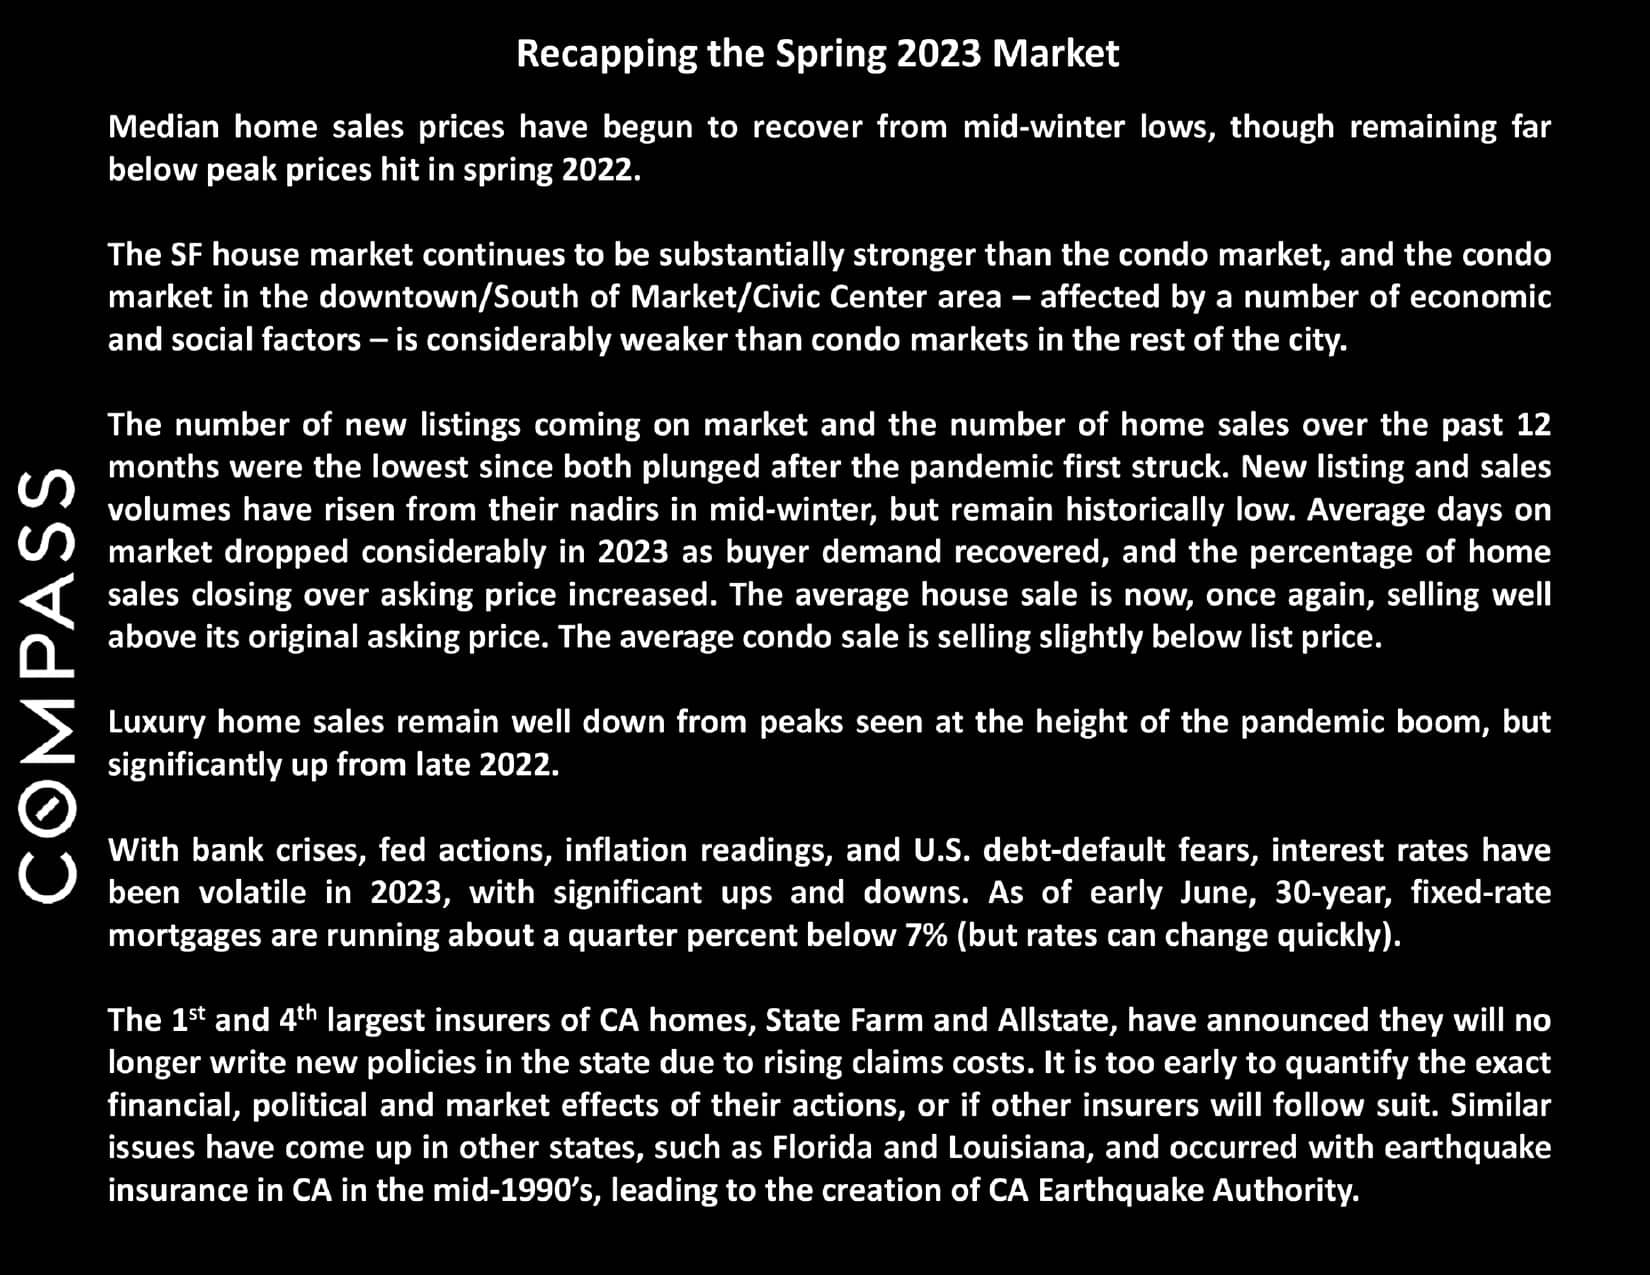
Spring 2023 San Francisco market recap covering home prices, sales, mortgage rates, and insurance.

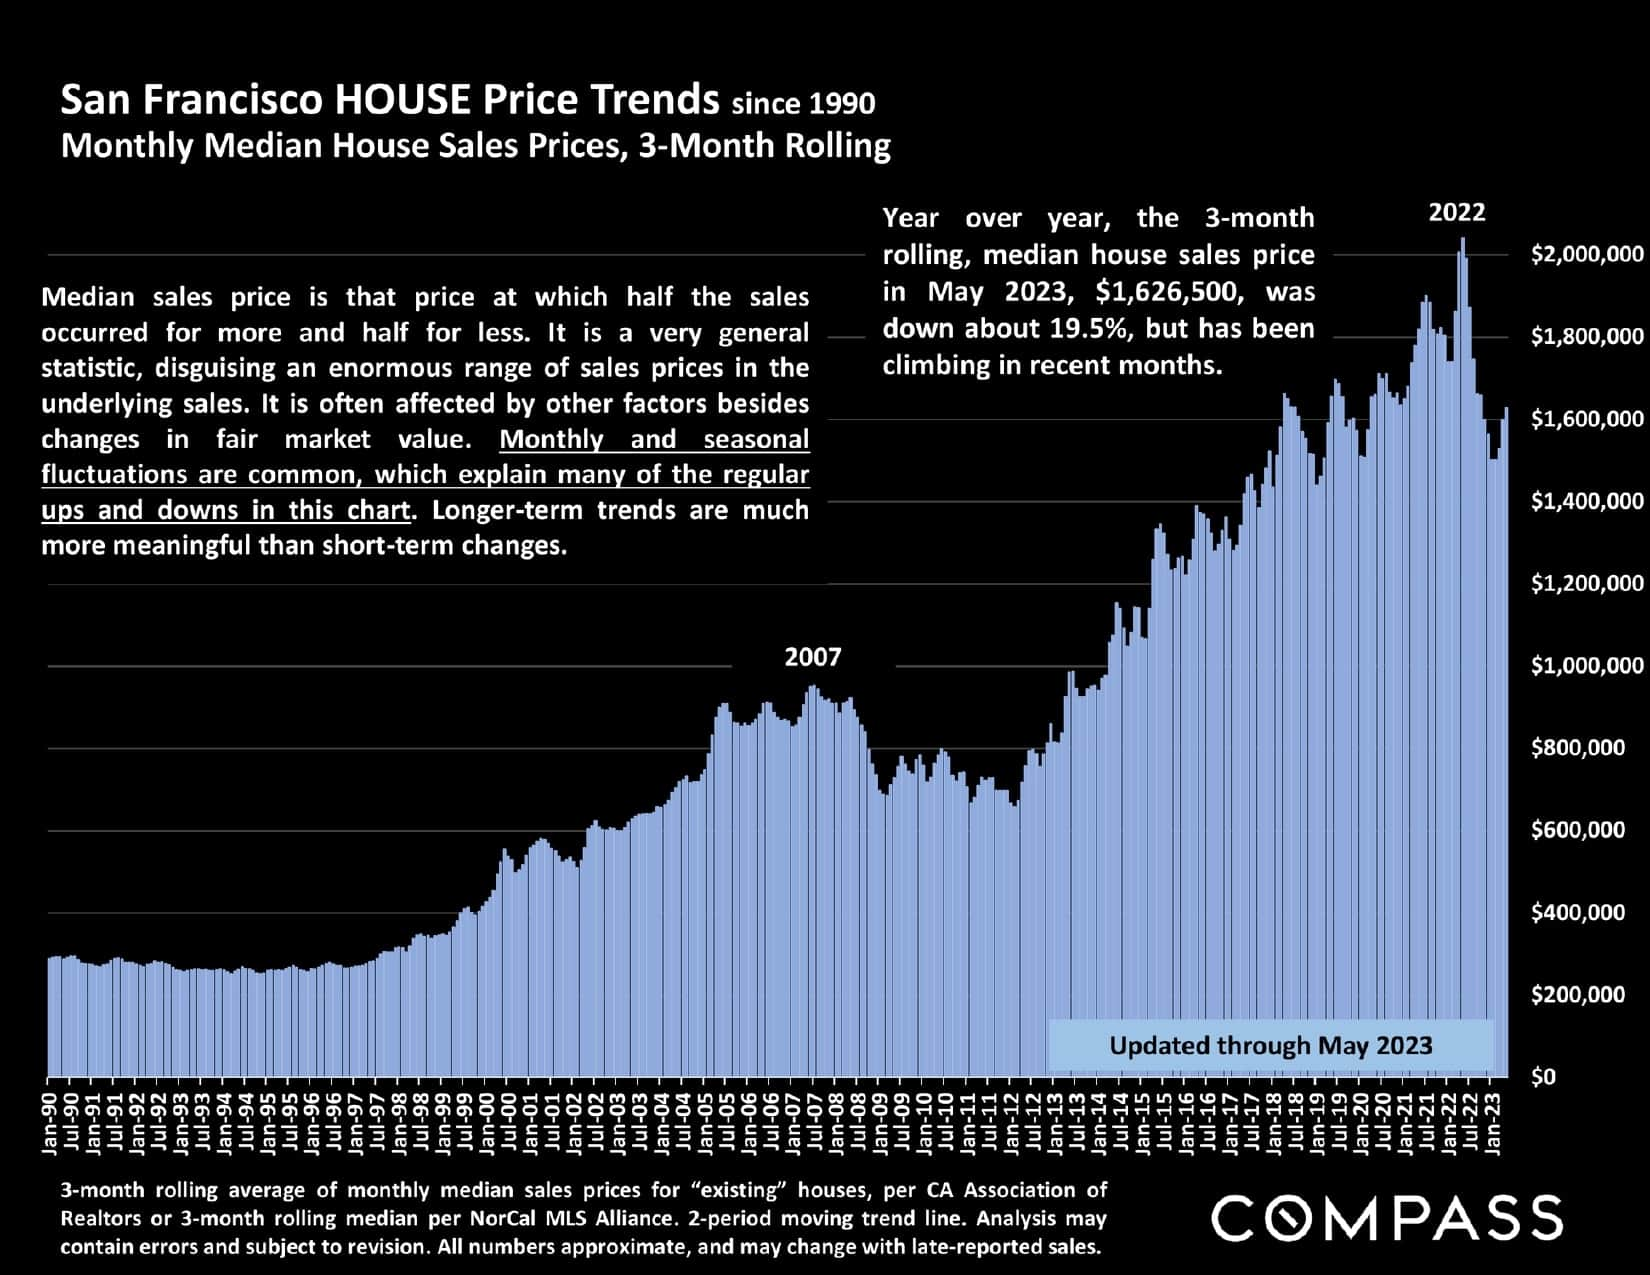
Chart of San Francisco median house prices from 1990 to May 2023, peaking near $2 million in 2022.

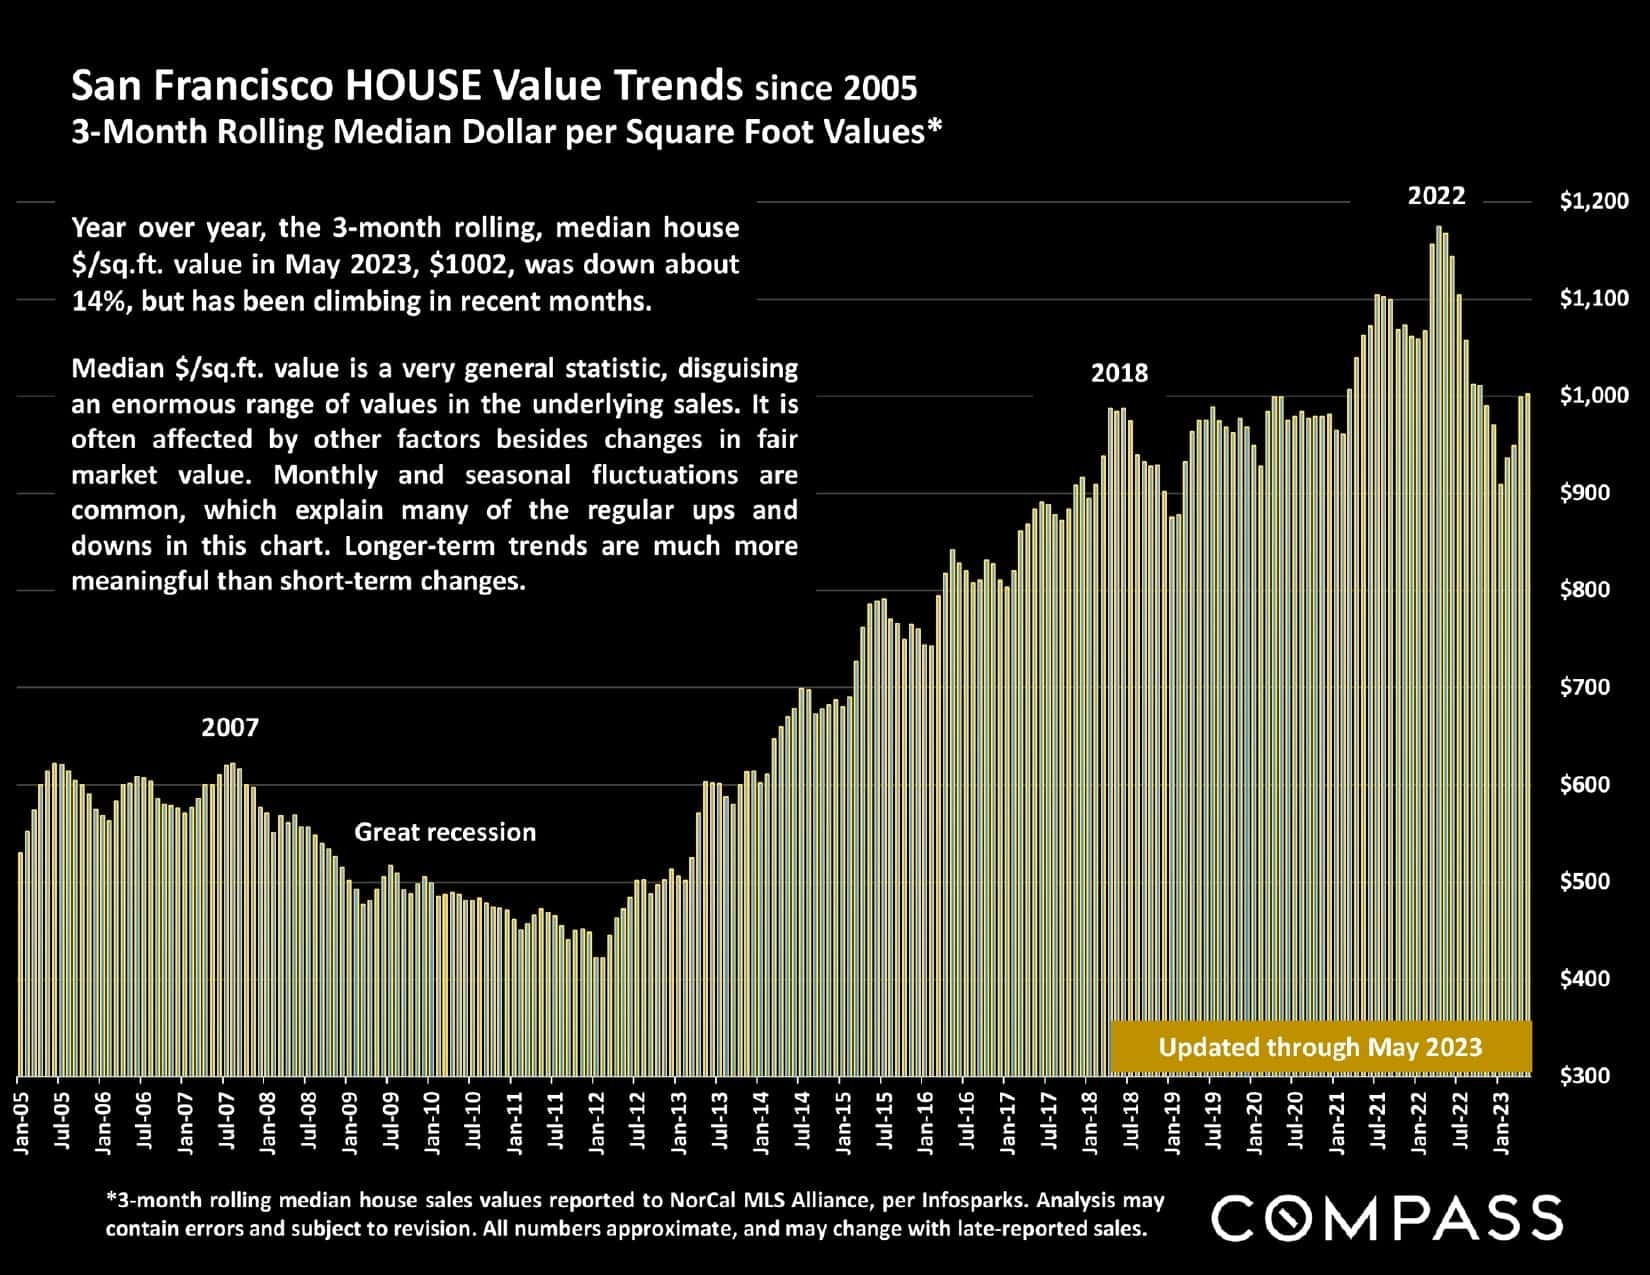
Chart of San Francisco median house values per square foot from 2005 to 2023, with a recession-era decline and later rise.

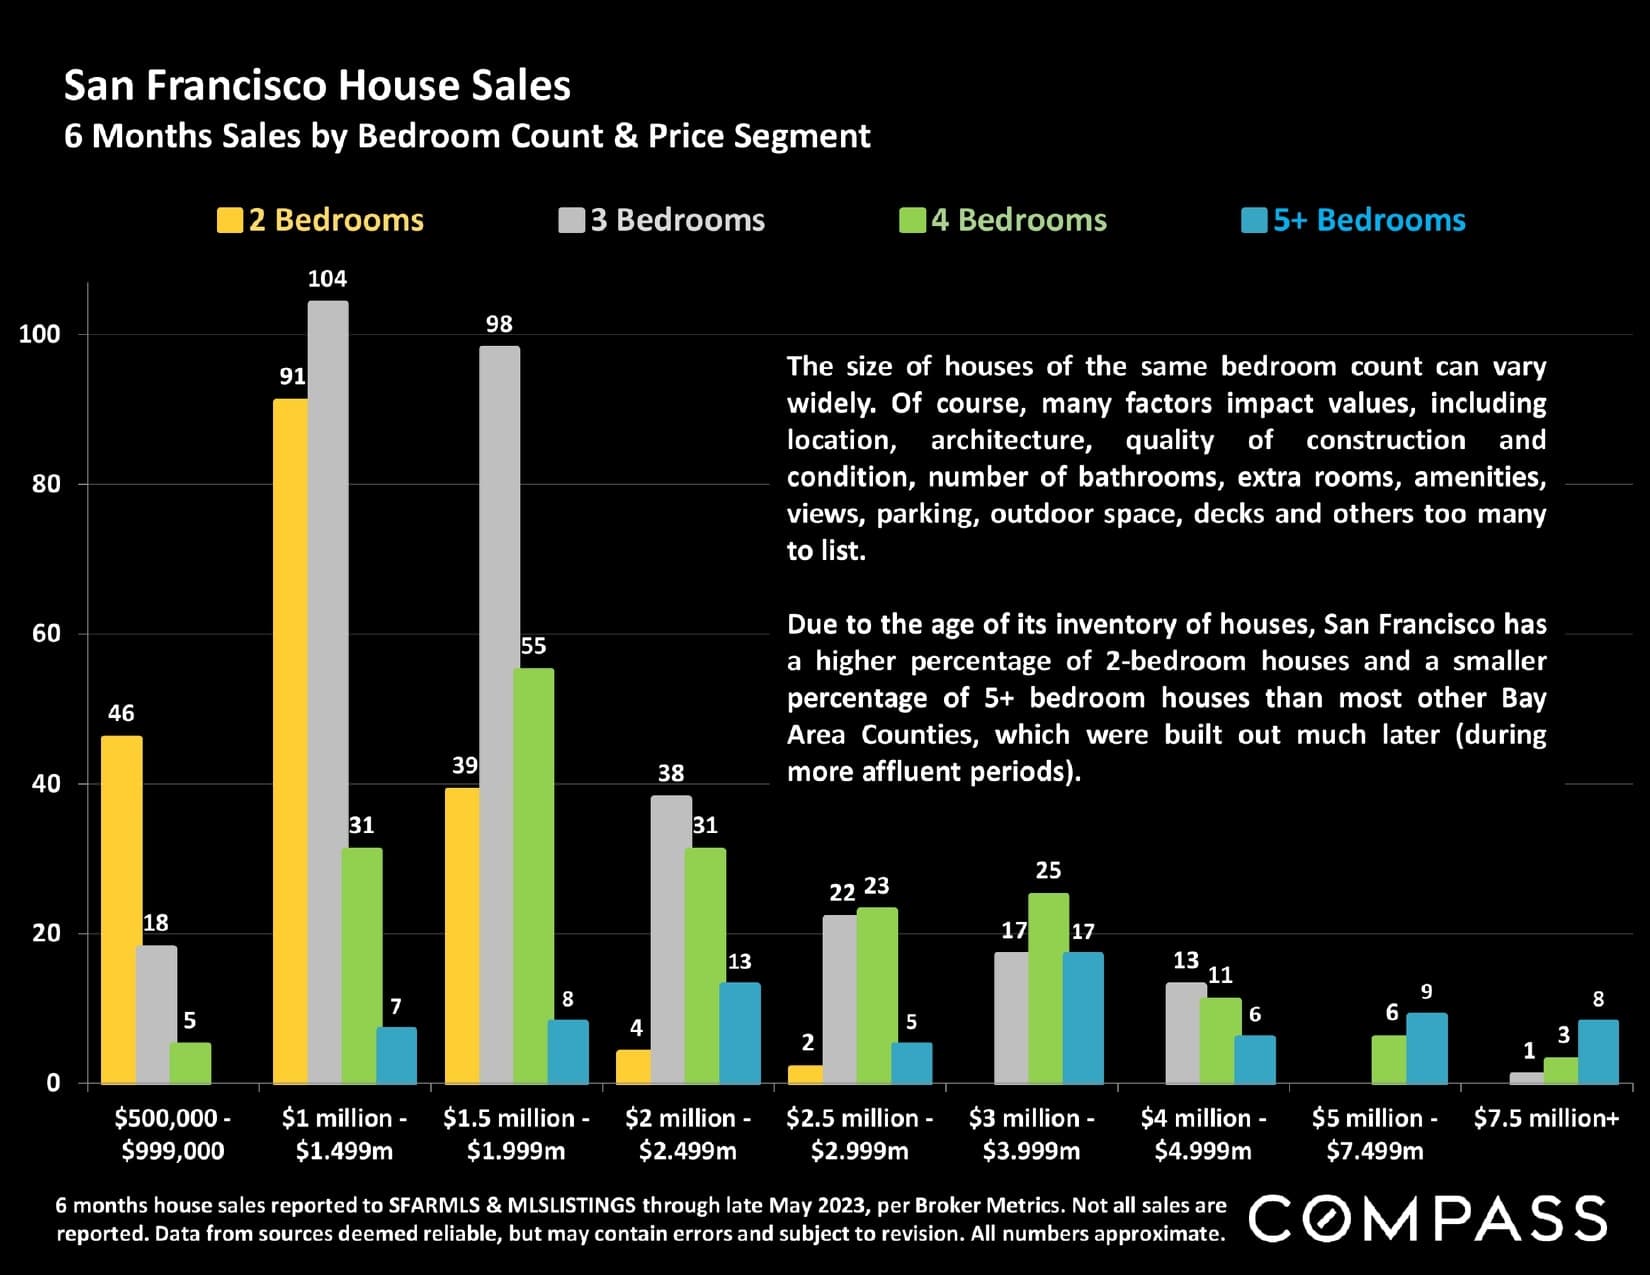
Chart comparing six months of San Francisco house sales by bedroom count across nine price ranges.

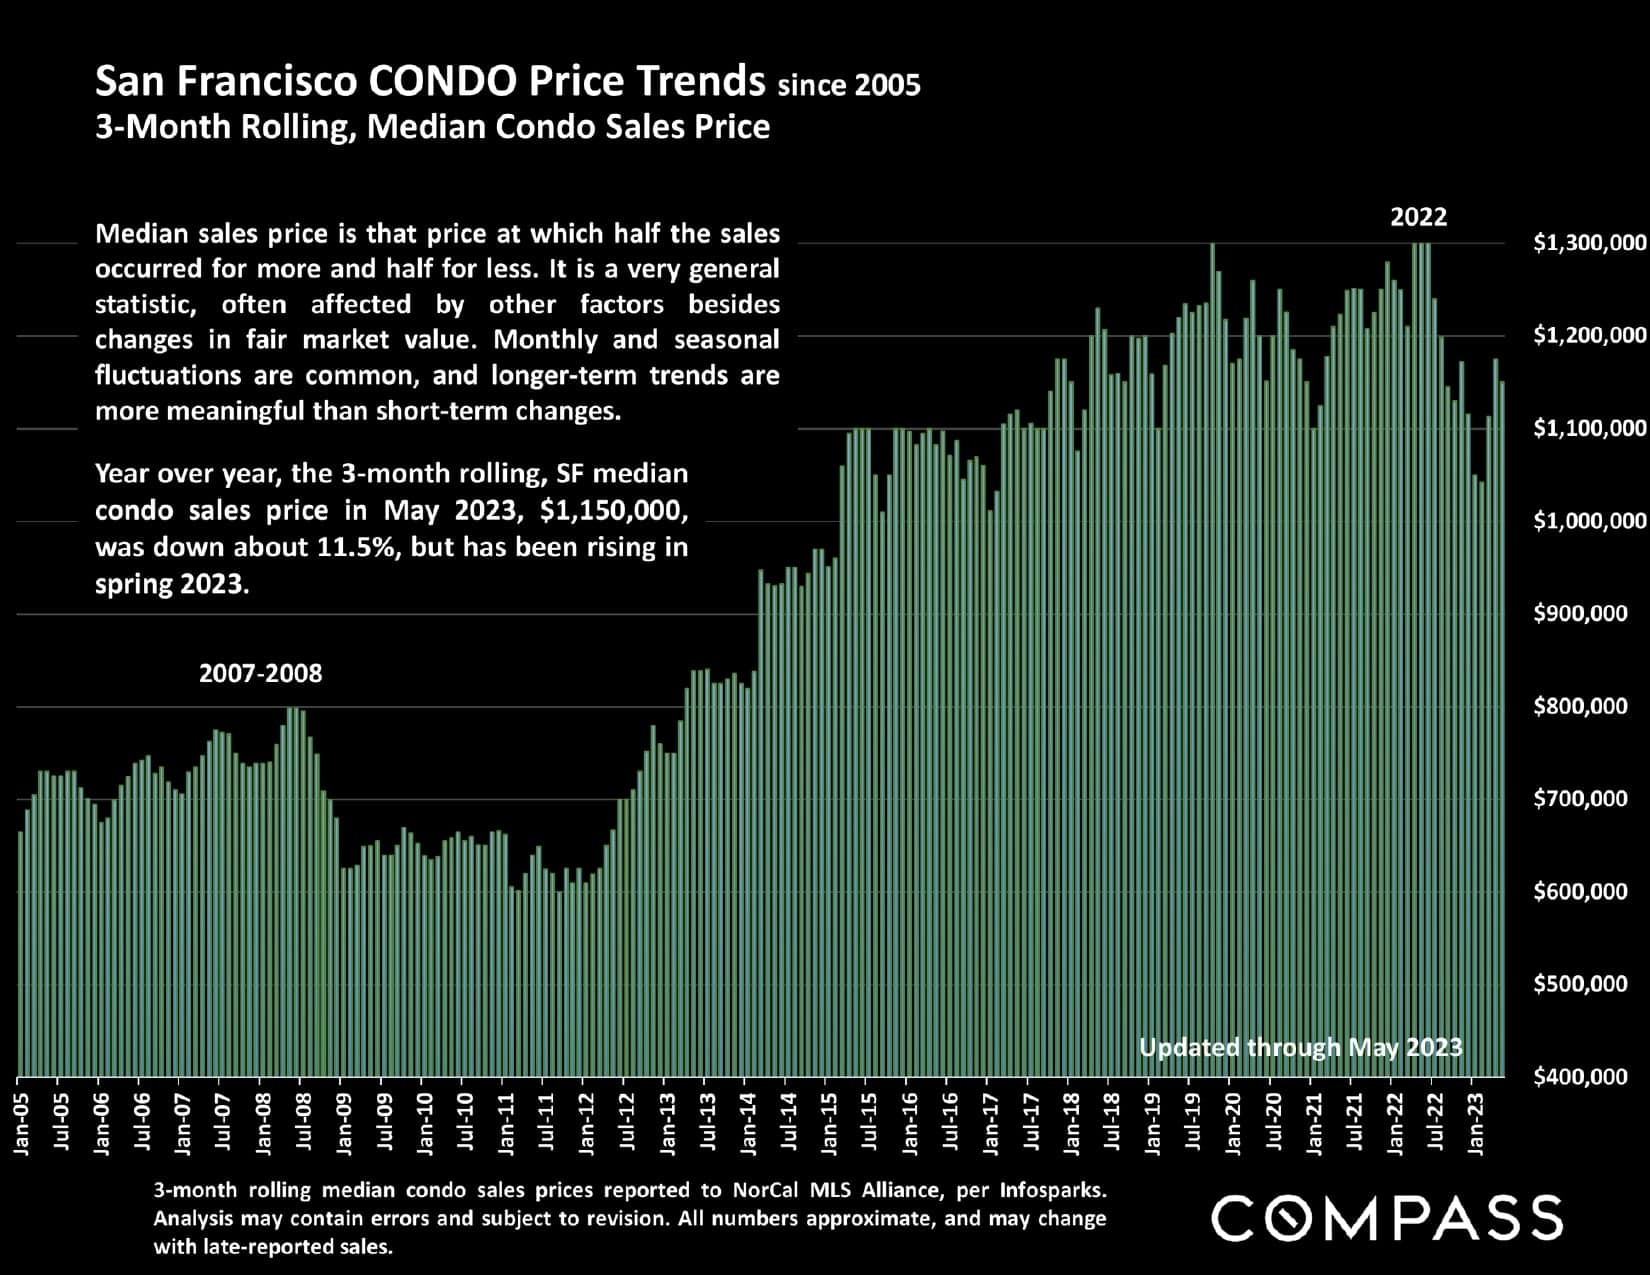
Chart of San Francisco median condo prices since 2005, showing a May 2023 median of $1.15 million.

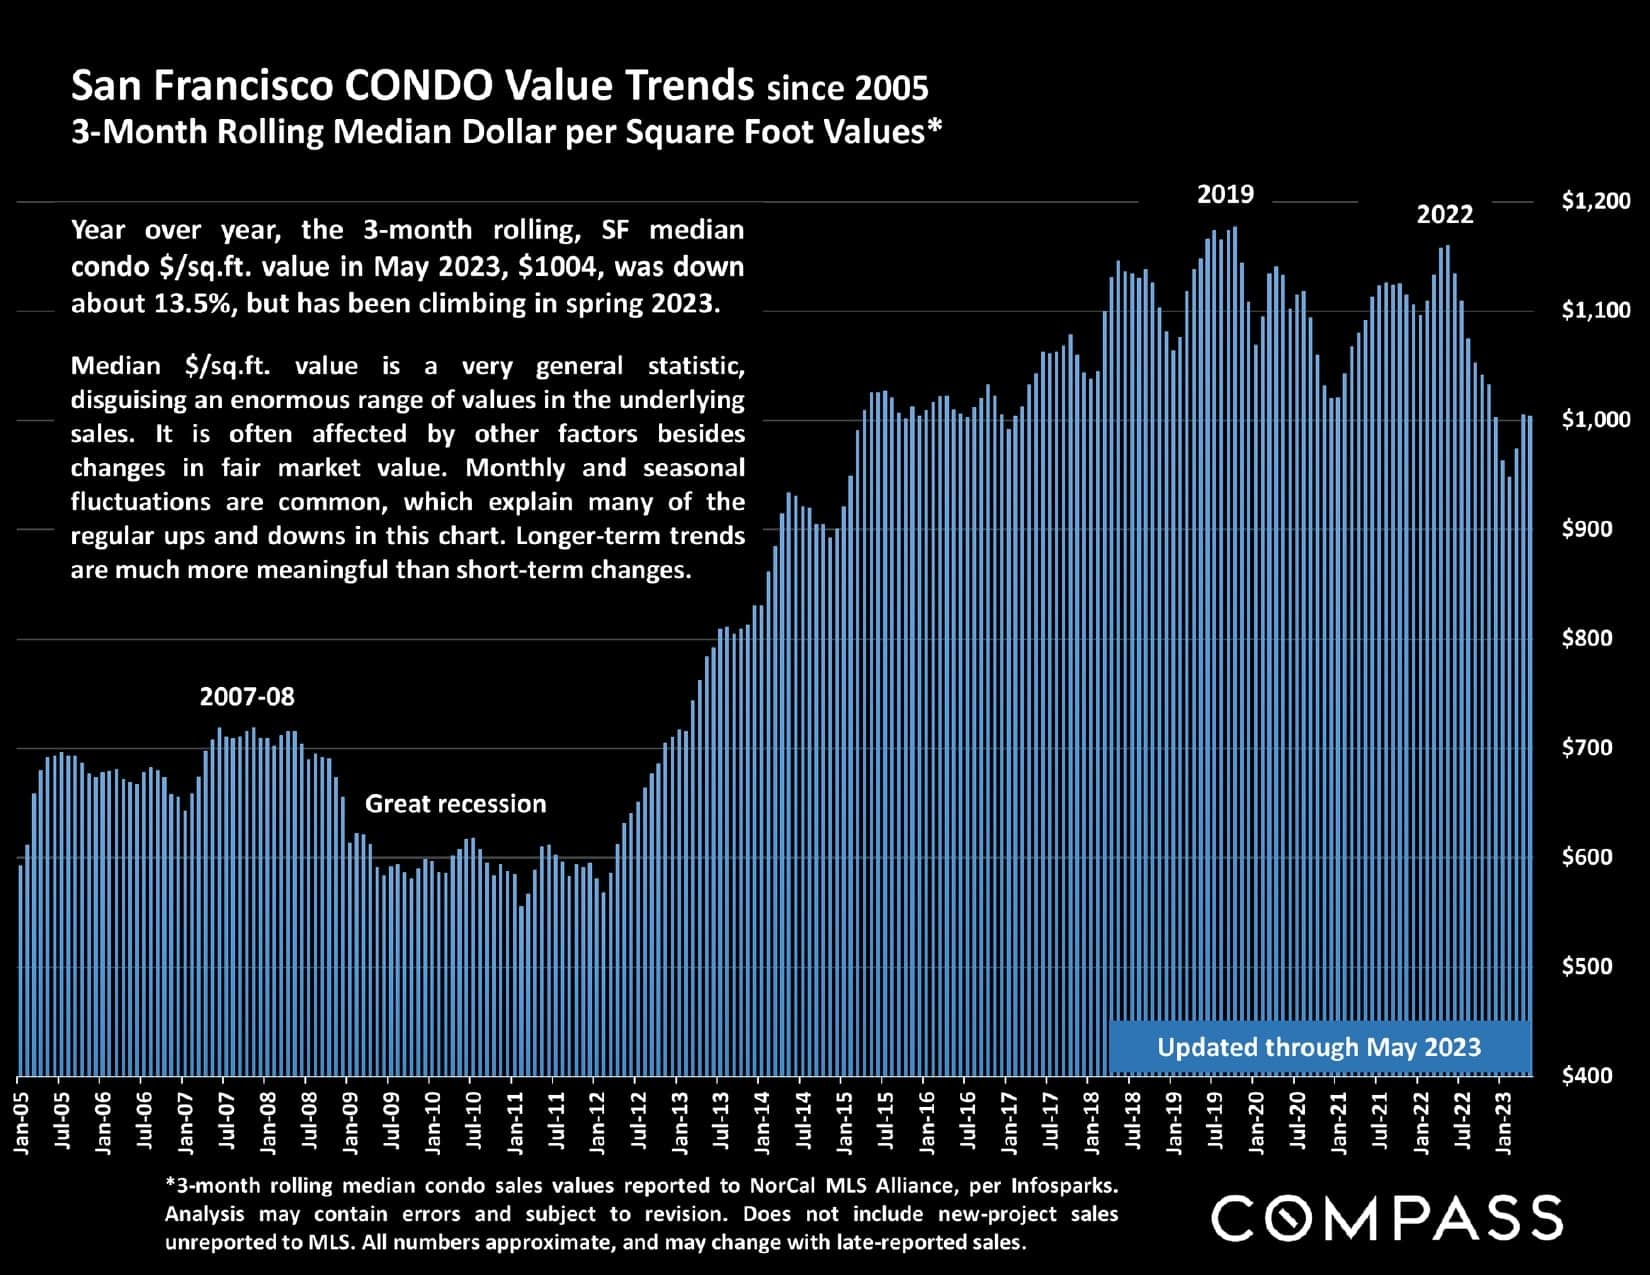
Chart of San Francisco condo values per square foot from 2005 to 2023, with a May 2023 median of $1,004.

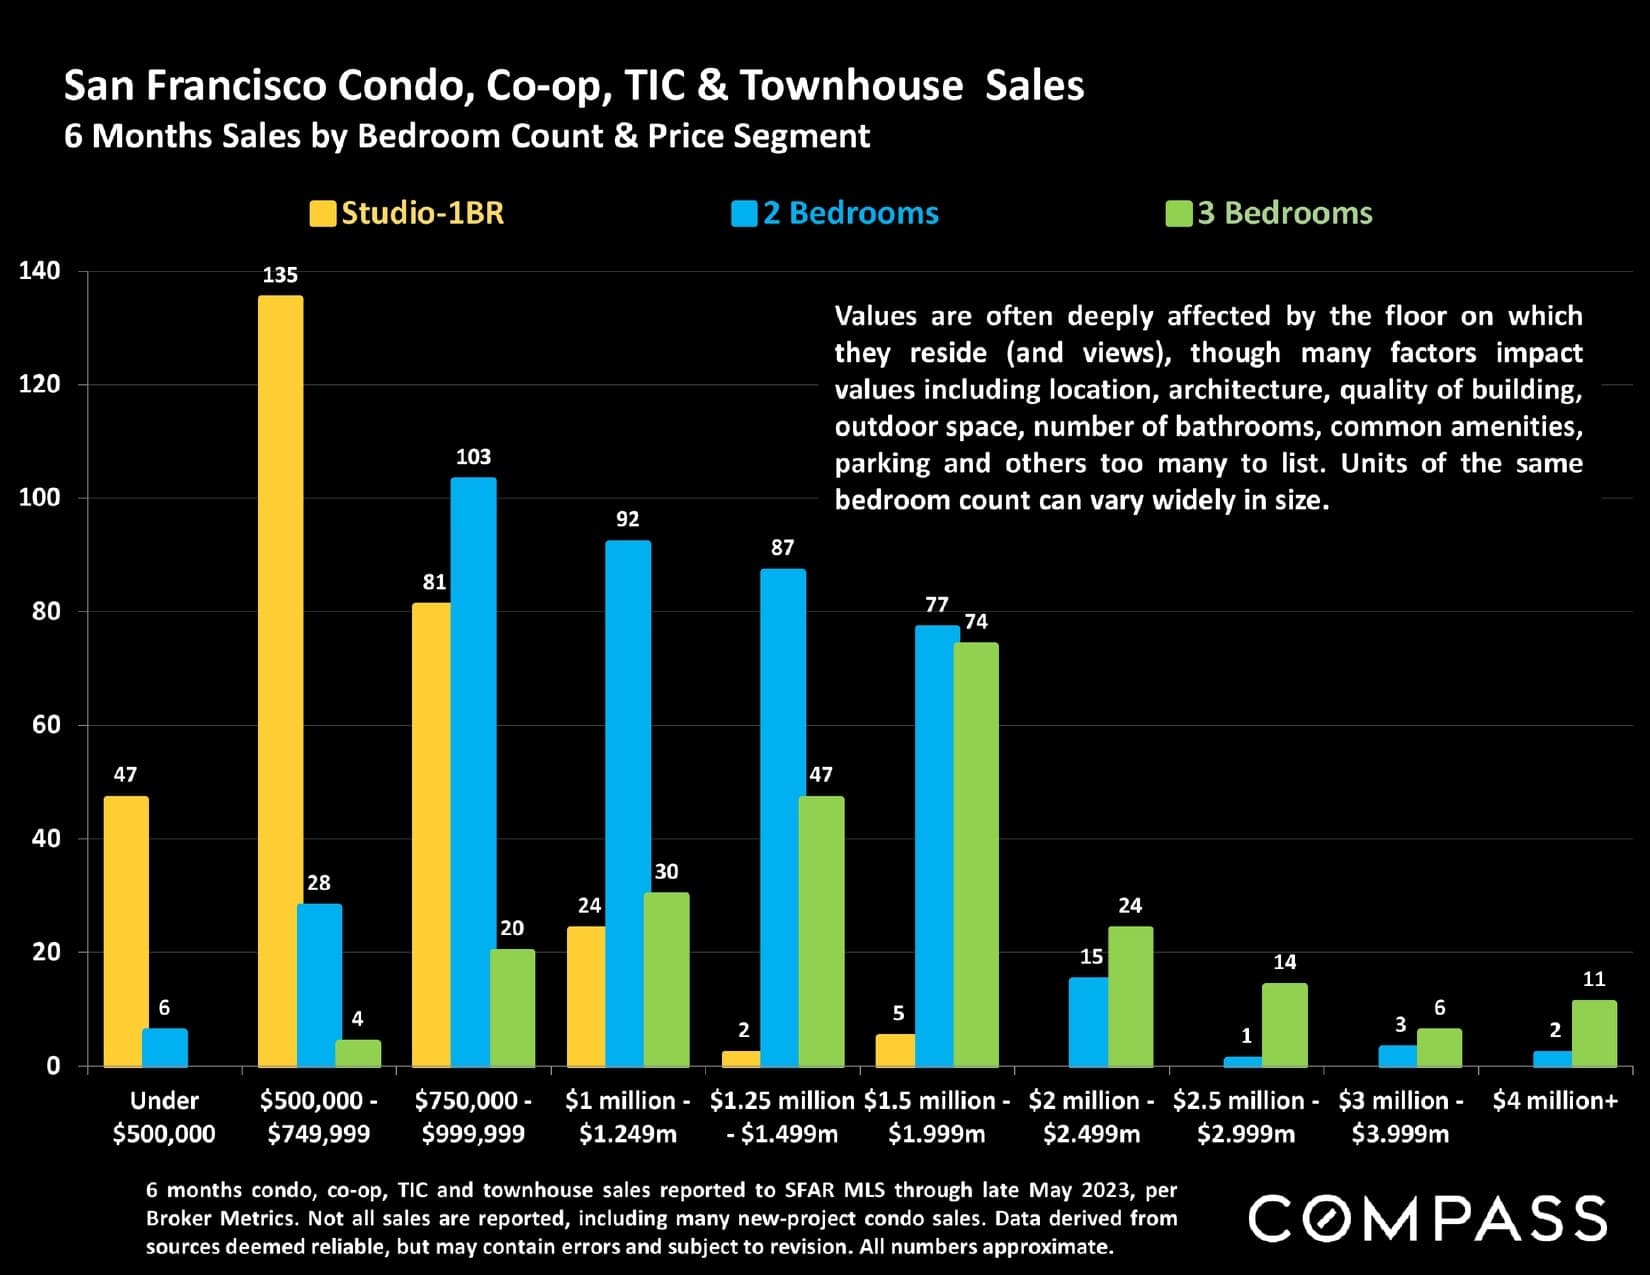
Chart compares six months of San Francisco home sales by bedroom count and price range.

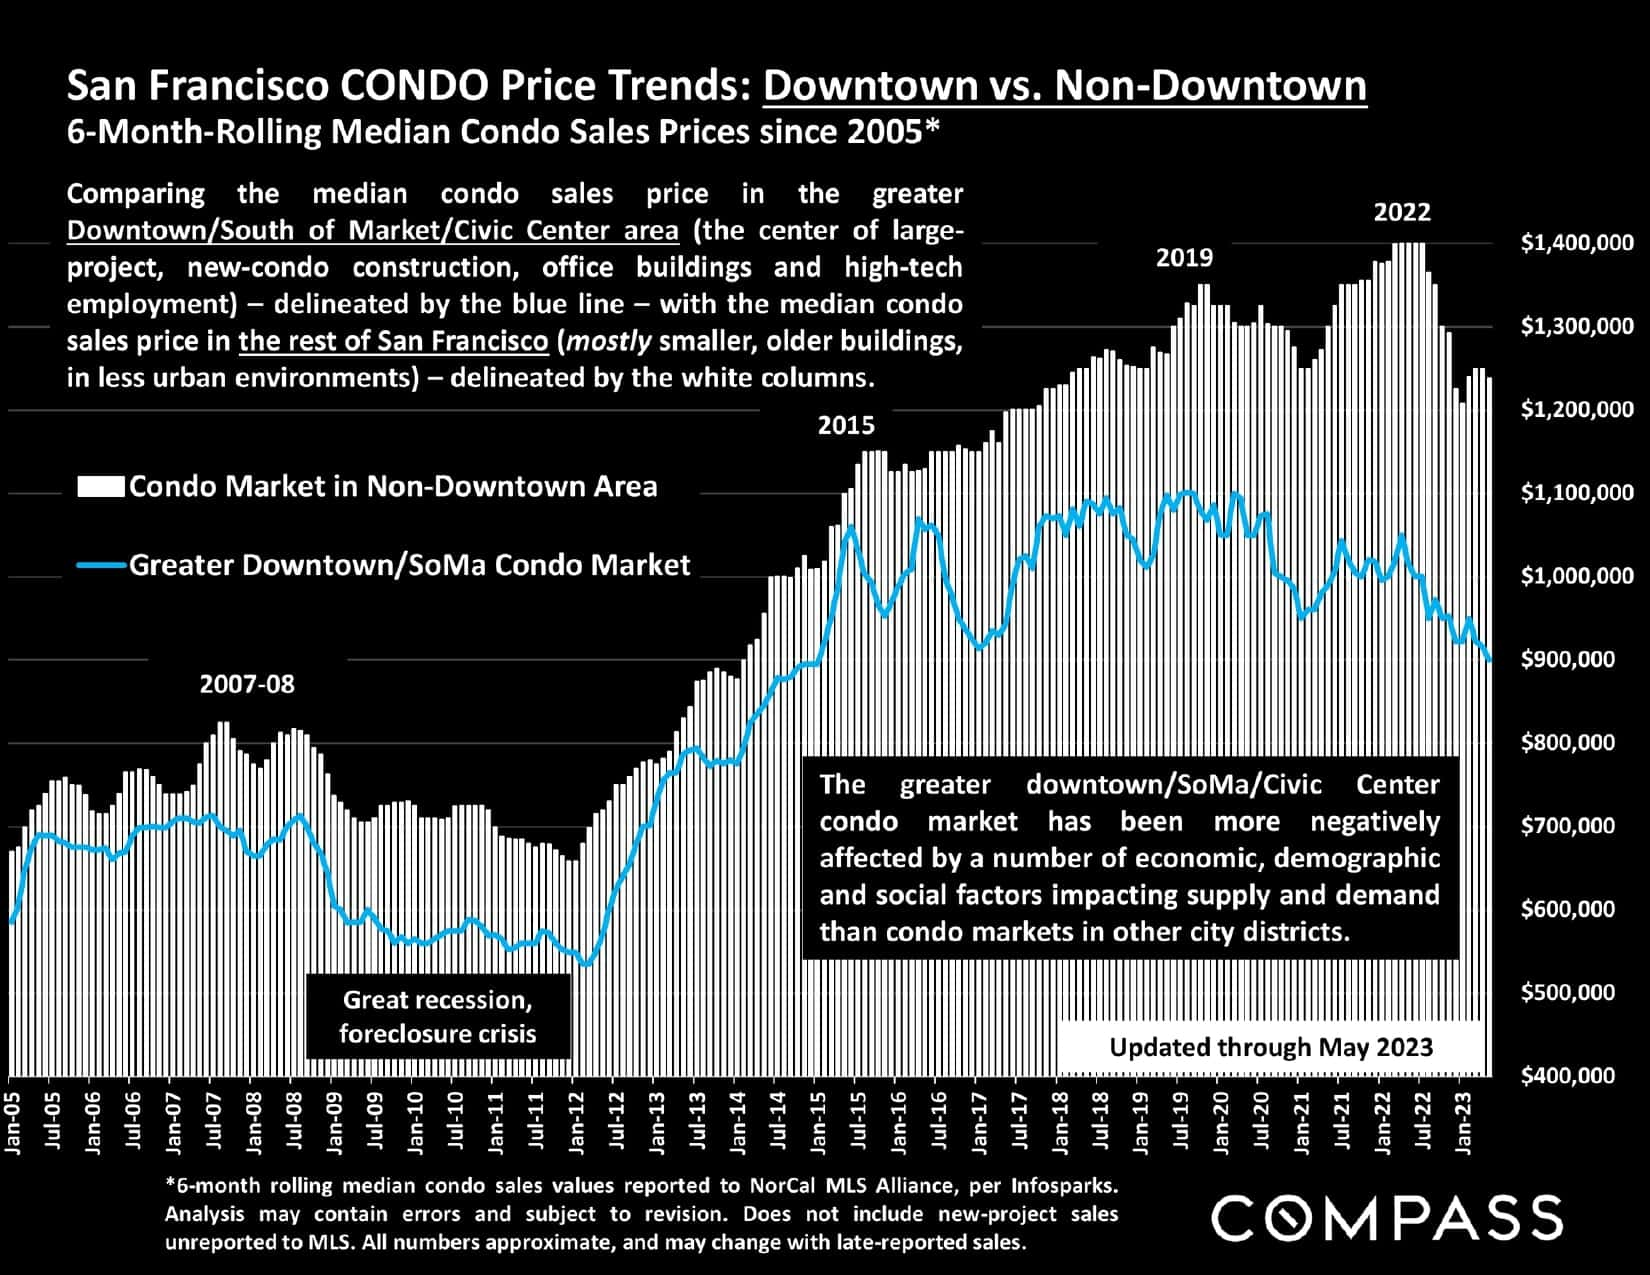
Chart compares San Francisco downtown and non-downtown median condo prices from 2005 through May 2023.

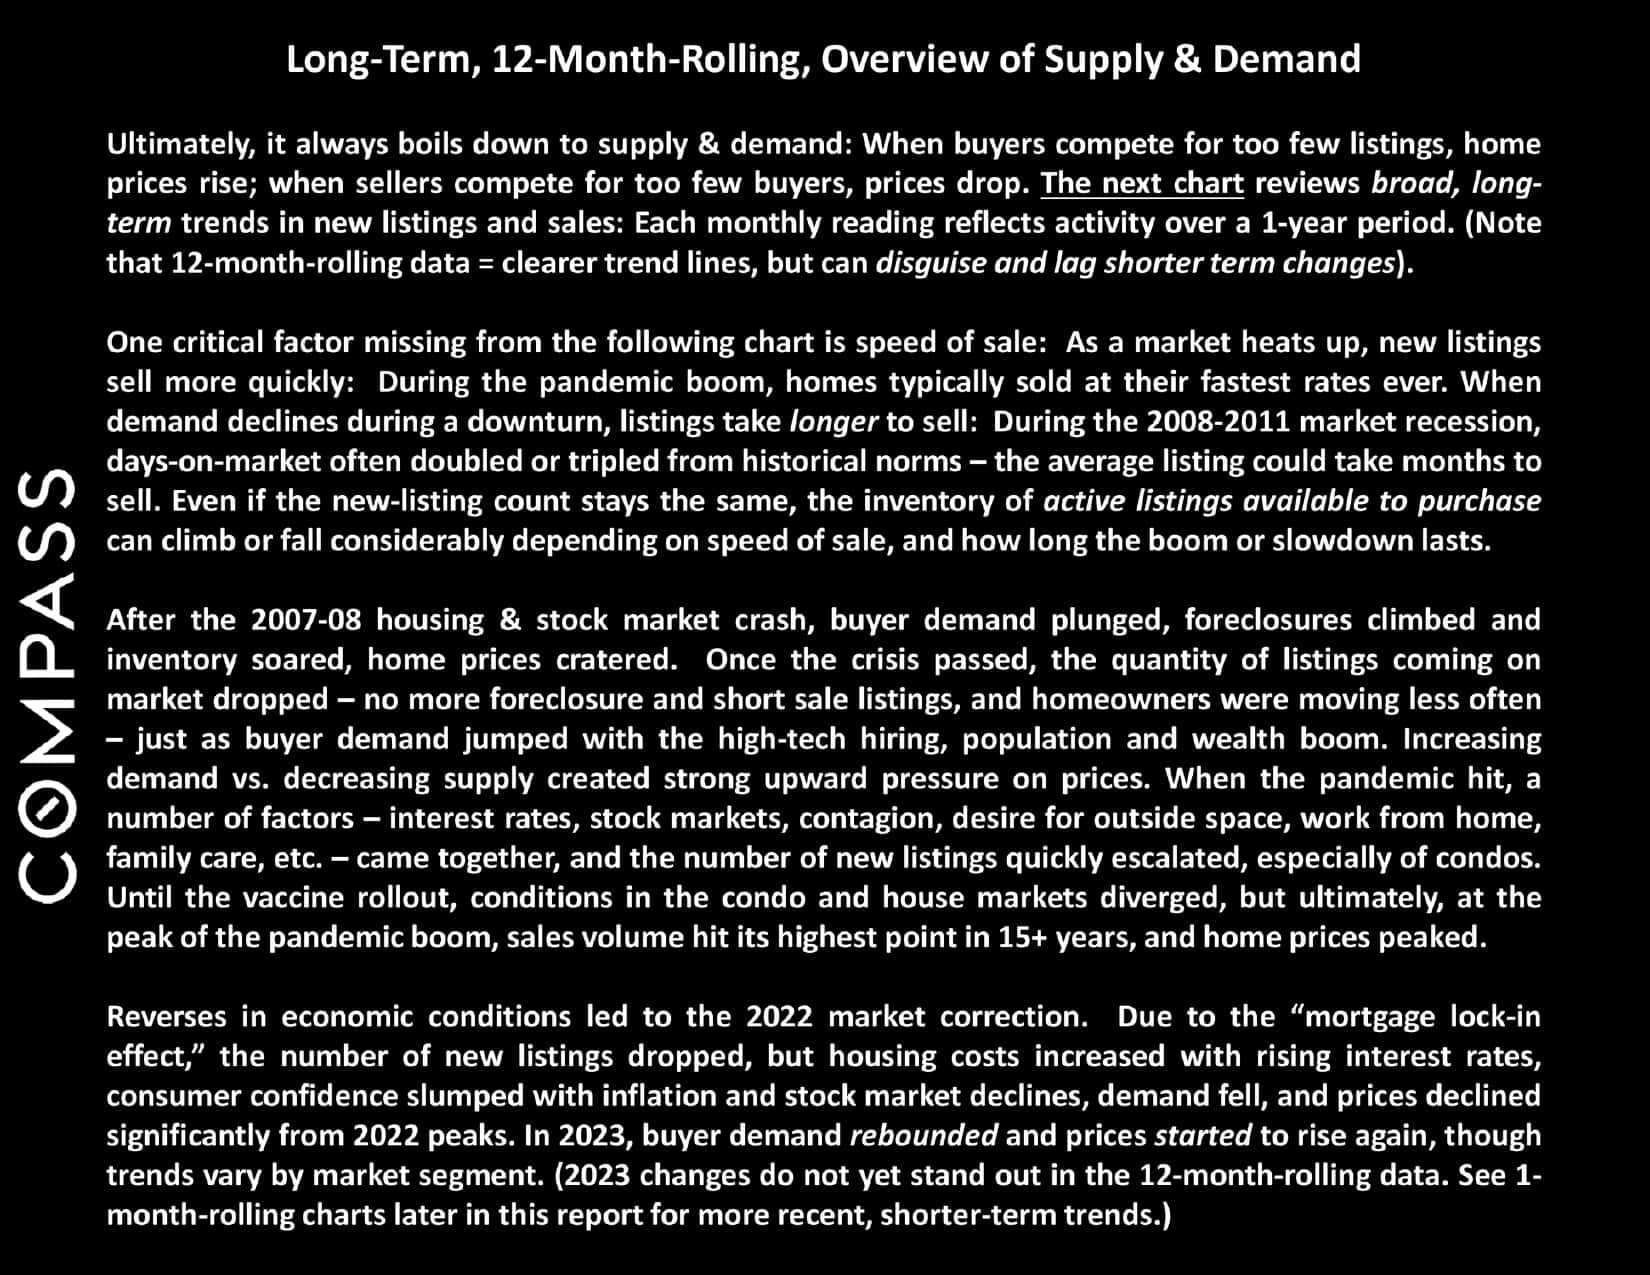
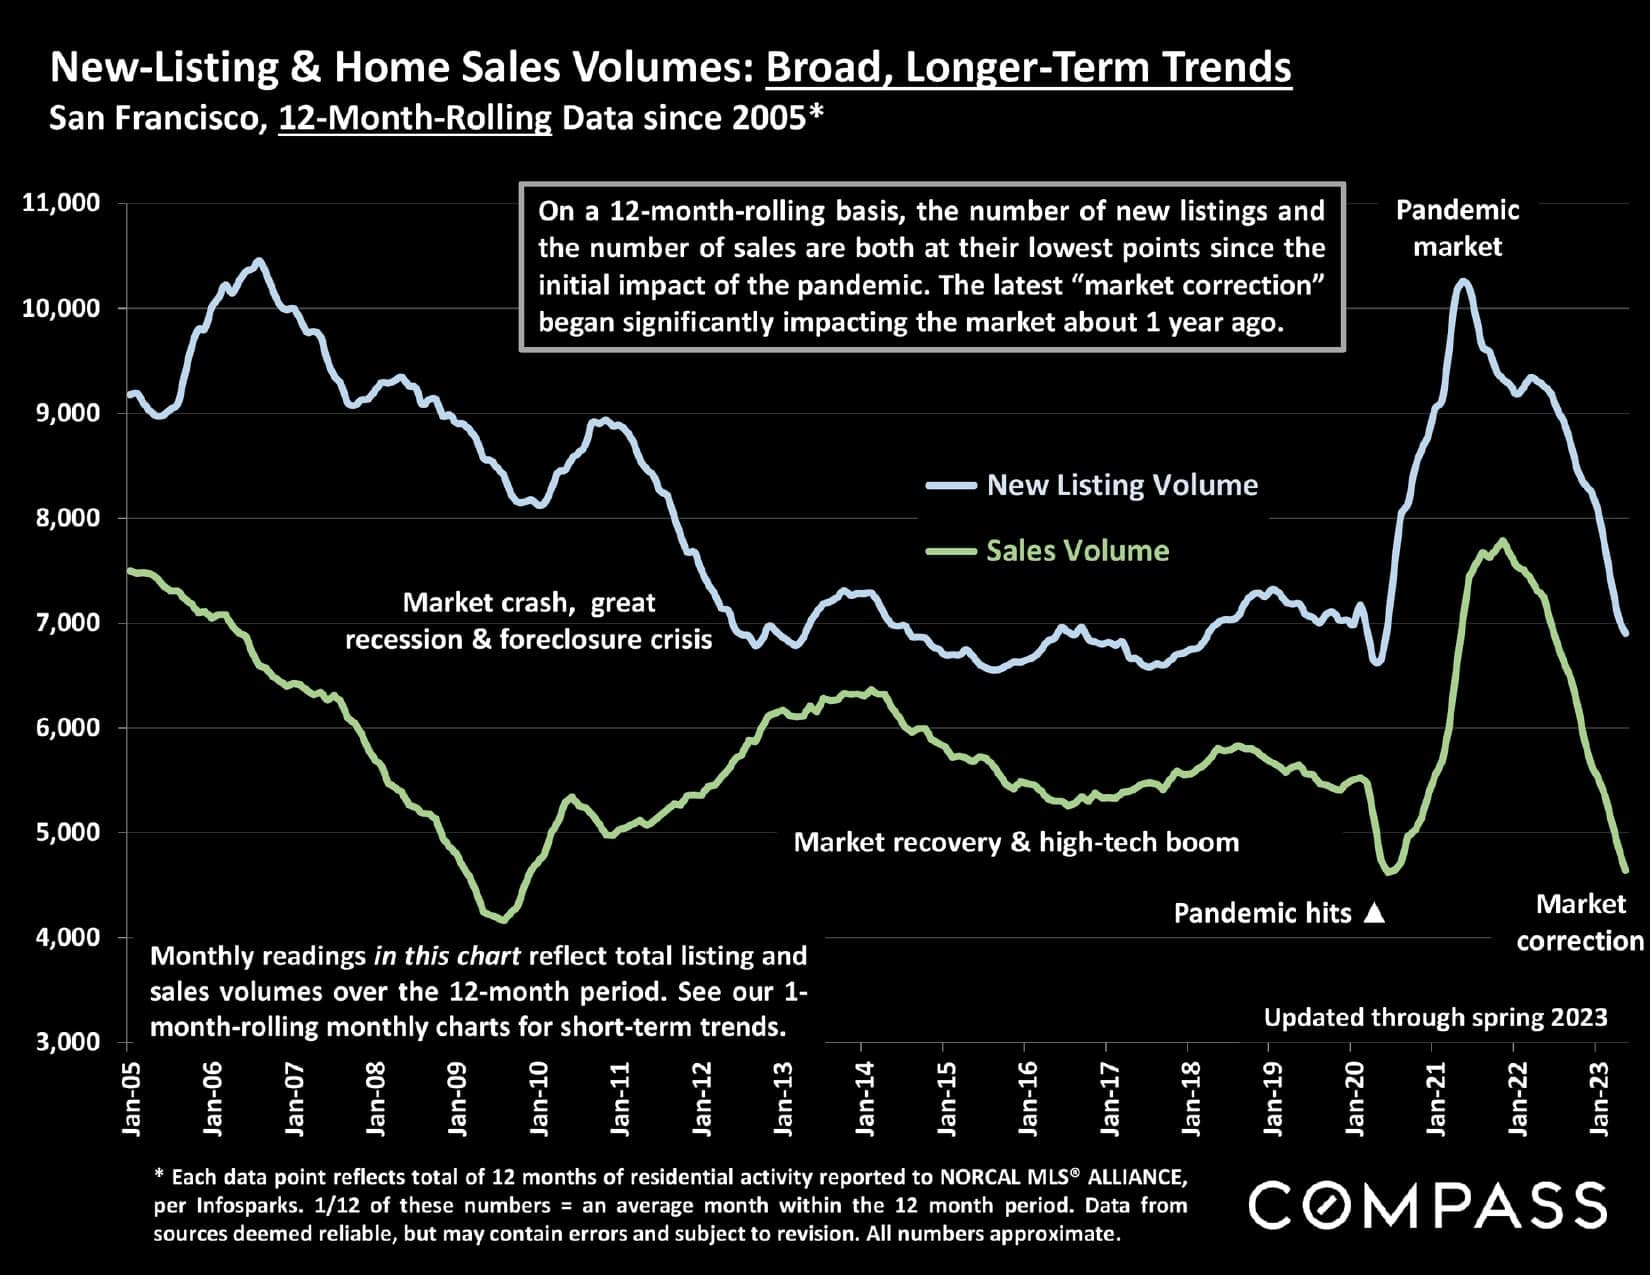
Supply and demand market overview describing listing trends, historical downturns, and the 2023 rebound.

Chart of San Francisco new listings and home sales from 2005 to 2023, with annotated market trends.

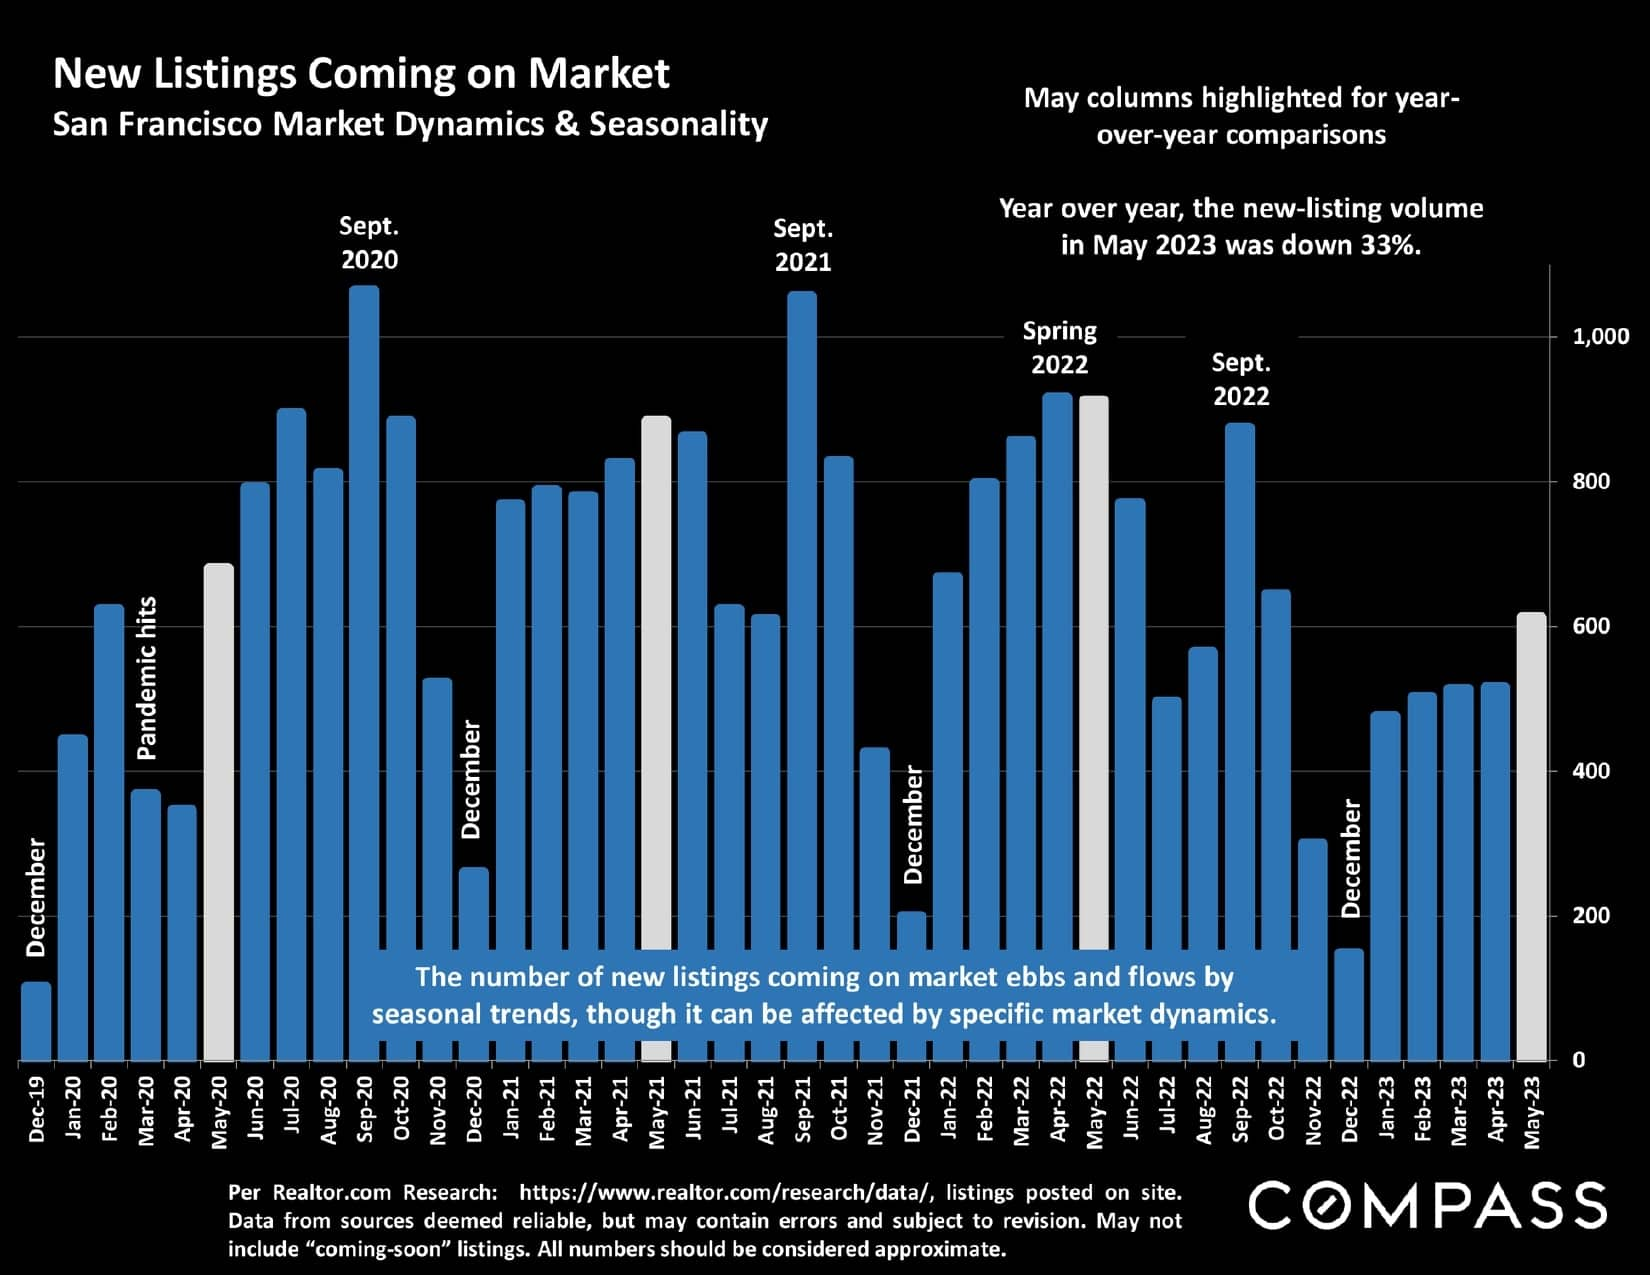
Bar chart of San Francisco new listings through May 2023, showing a 33% year-over-year decline.

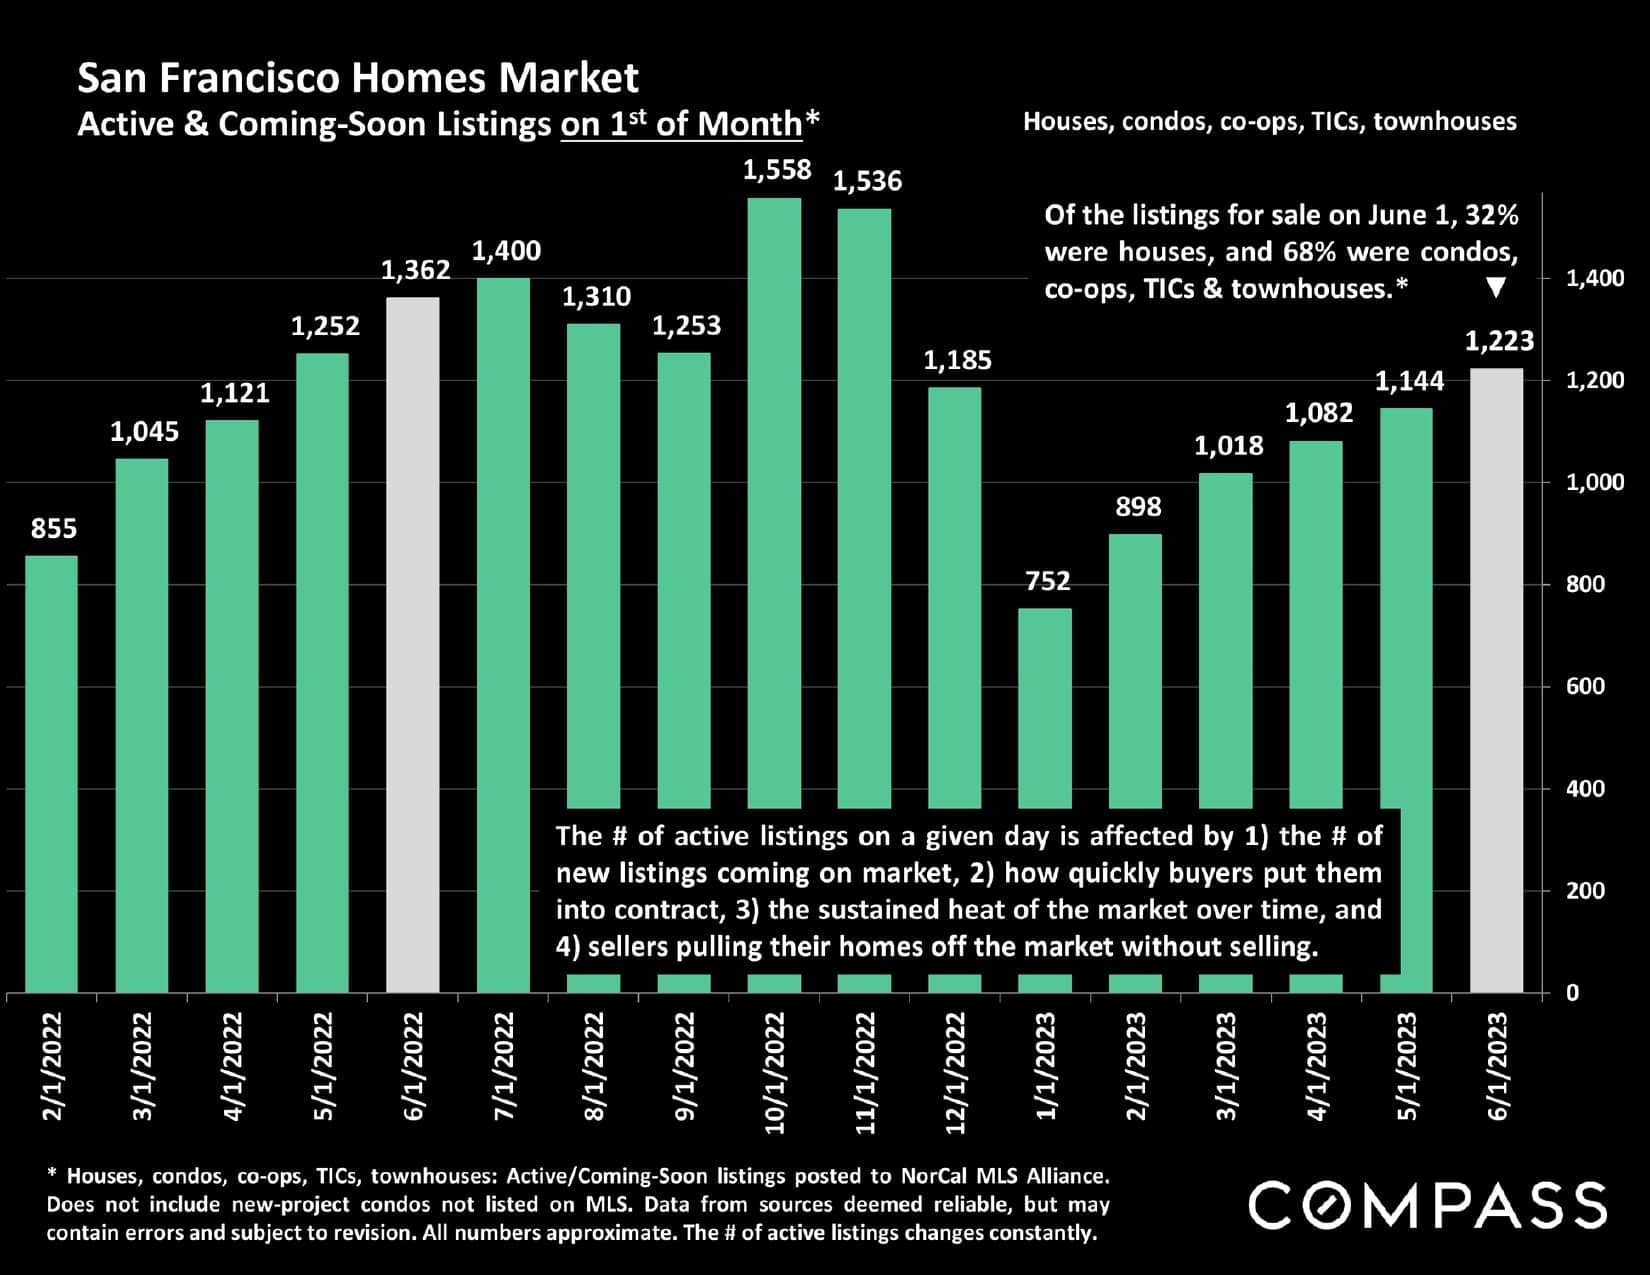
Bar chart of San Francisco active and coming-soon listings, February 2022–June 2023, with monthly counts.

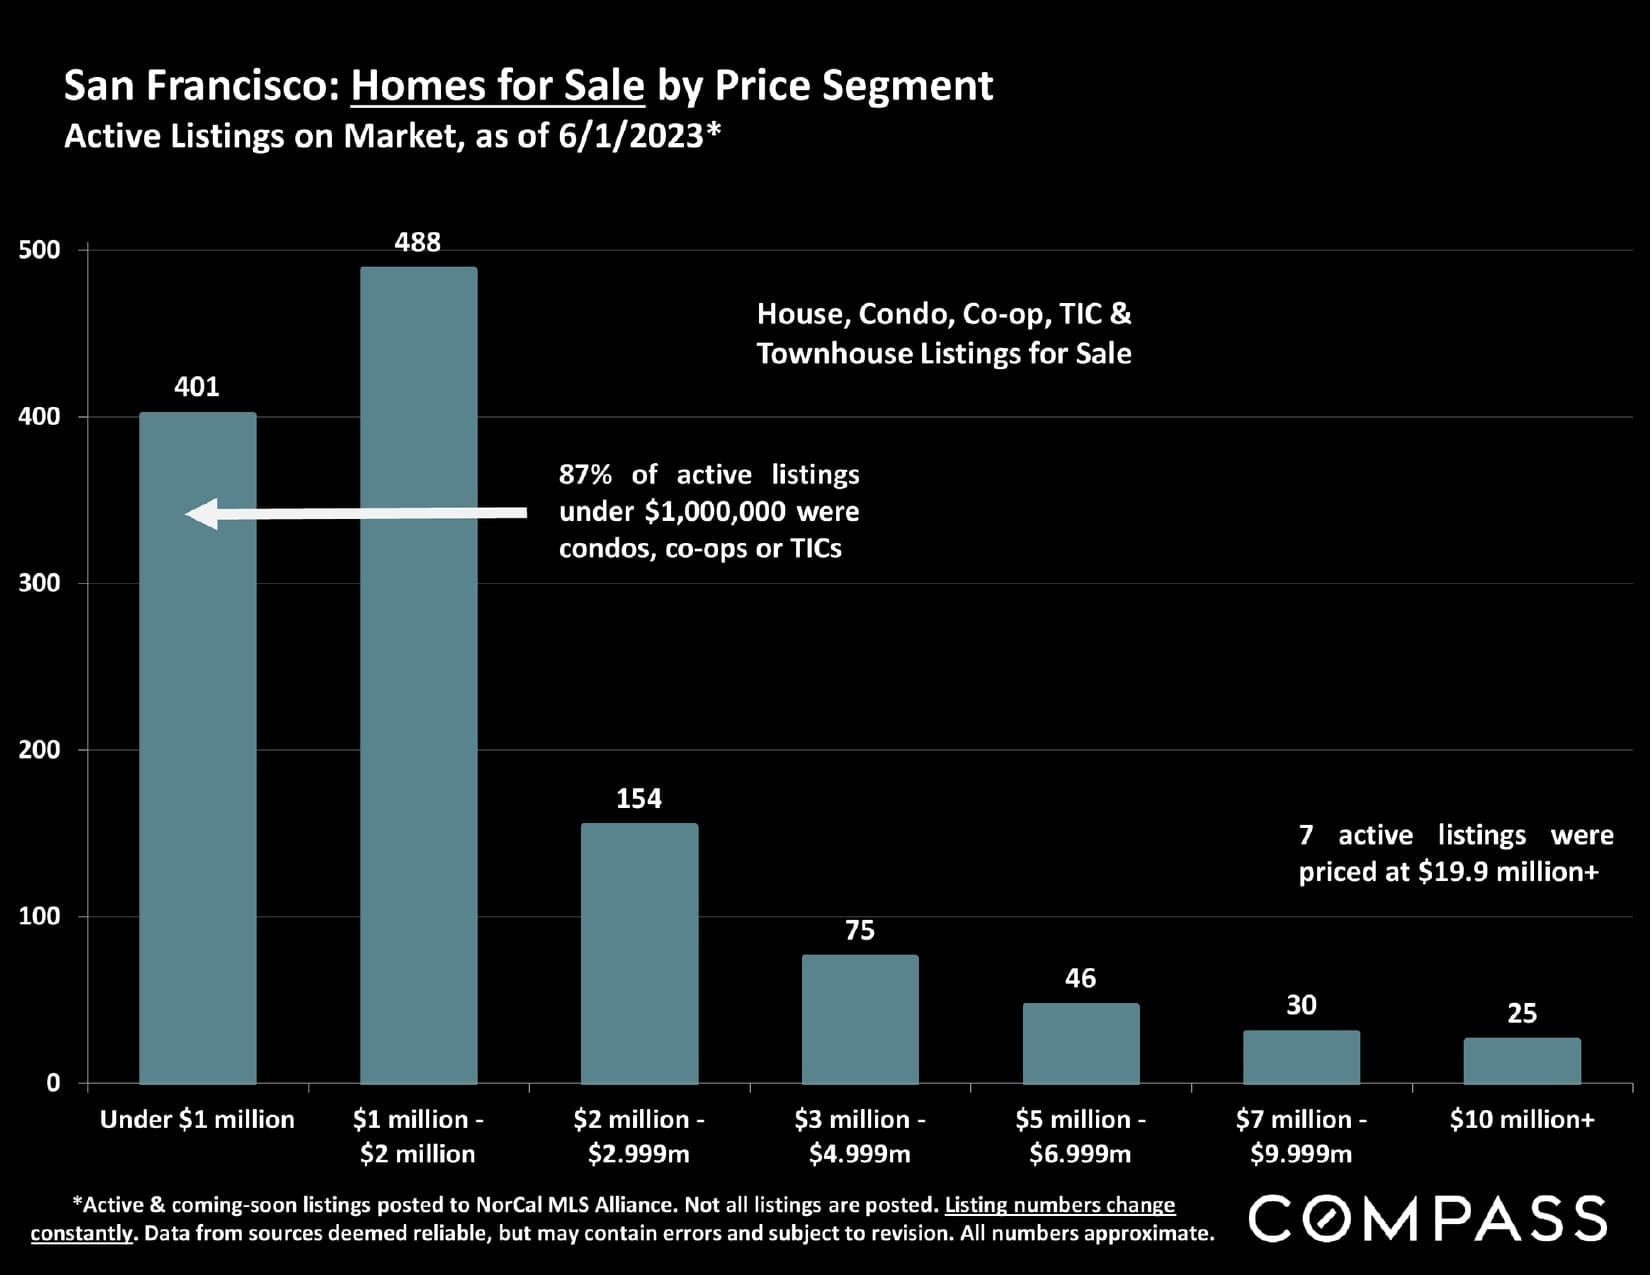
San Francisco active listings by price segment as of June 2023, with counts shown in a bar chart.

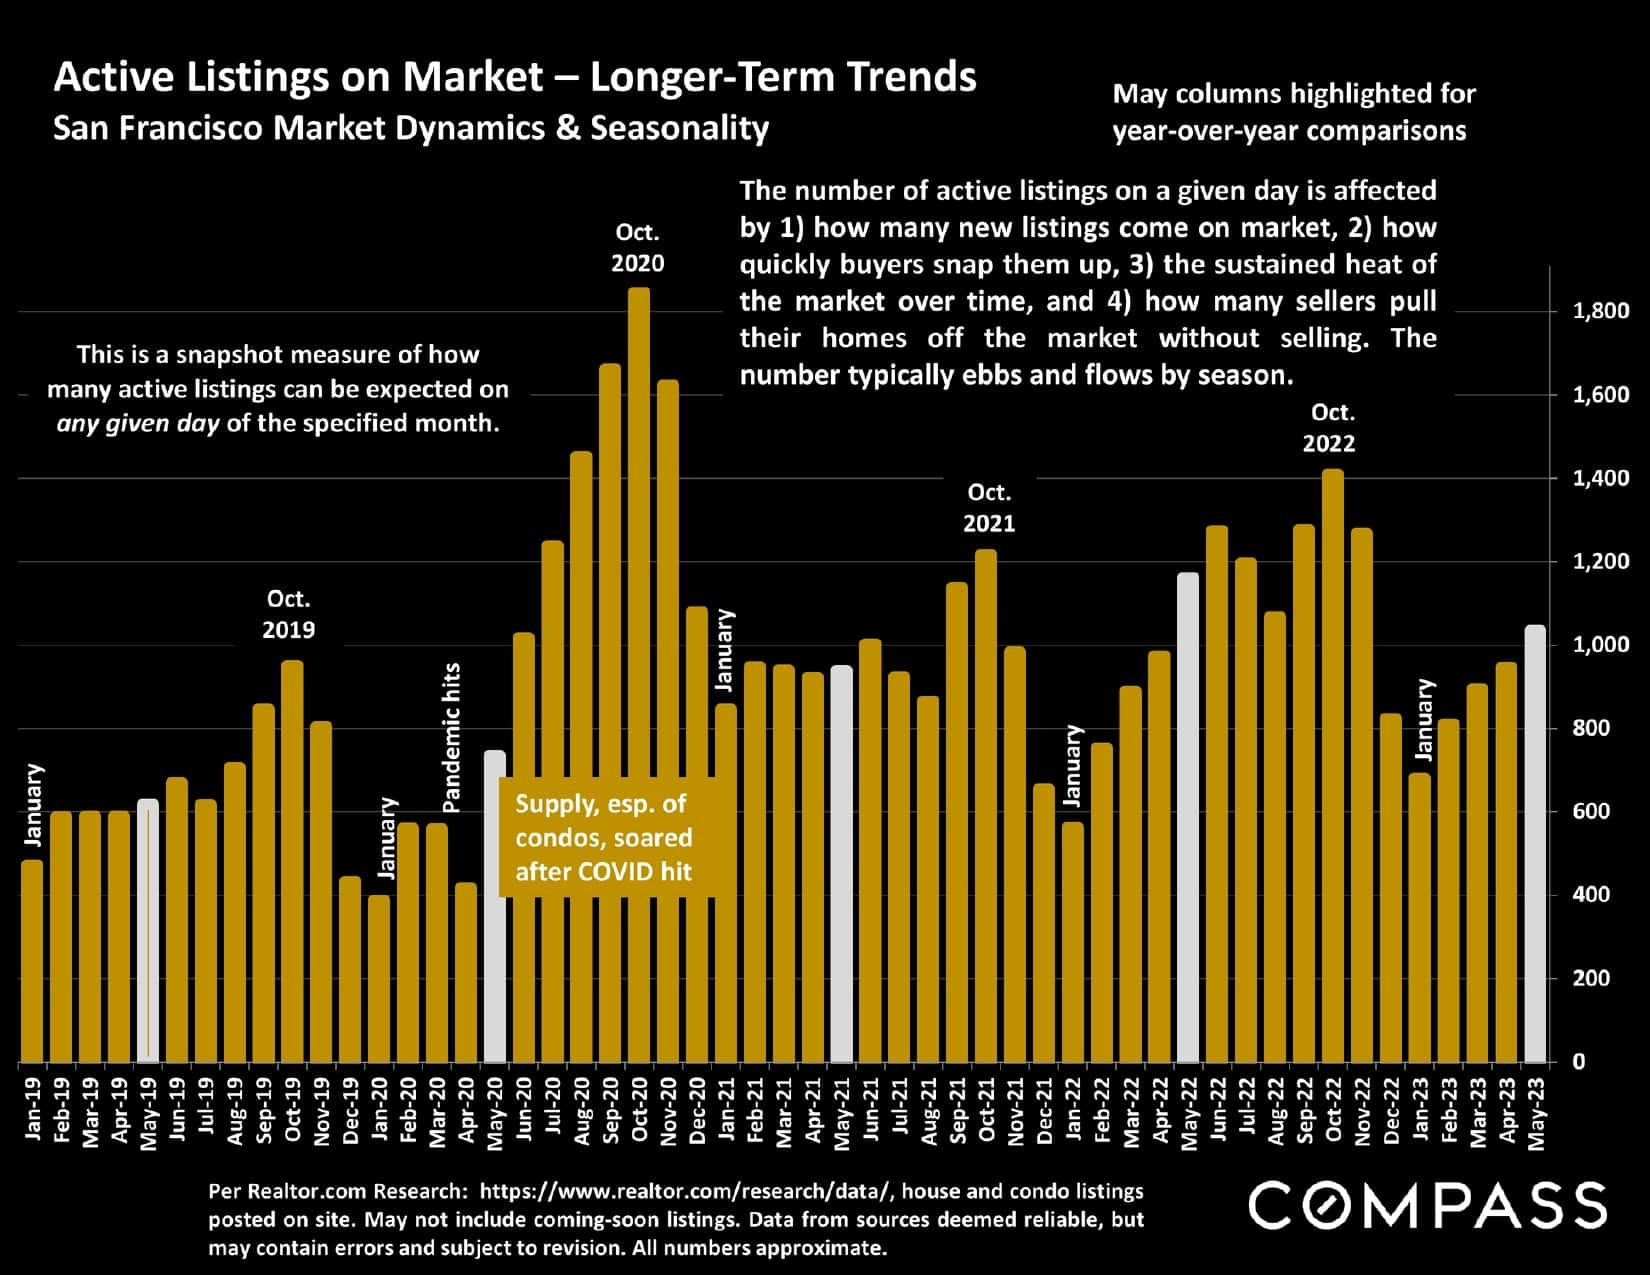
Chart of San Francisco active listings, January 2019–May 2023, peaking in October 2020.

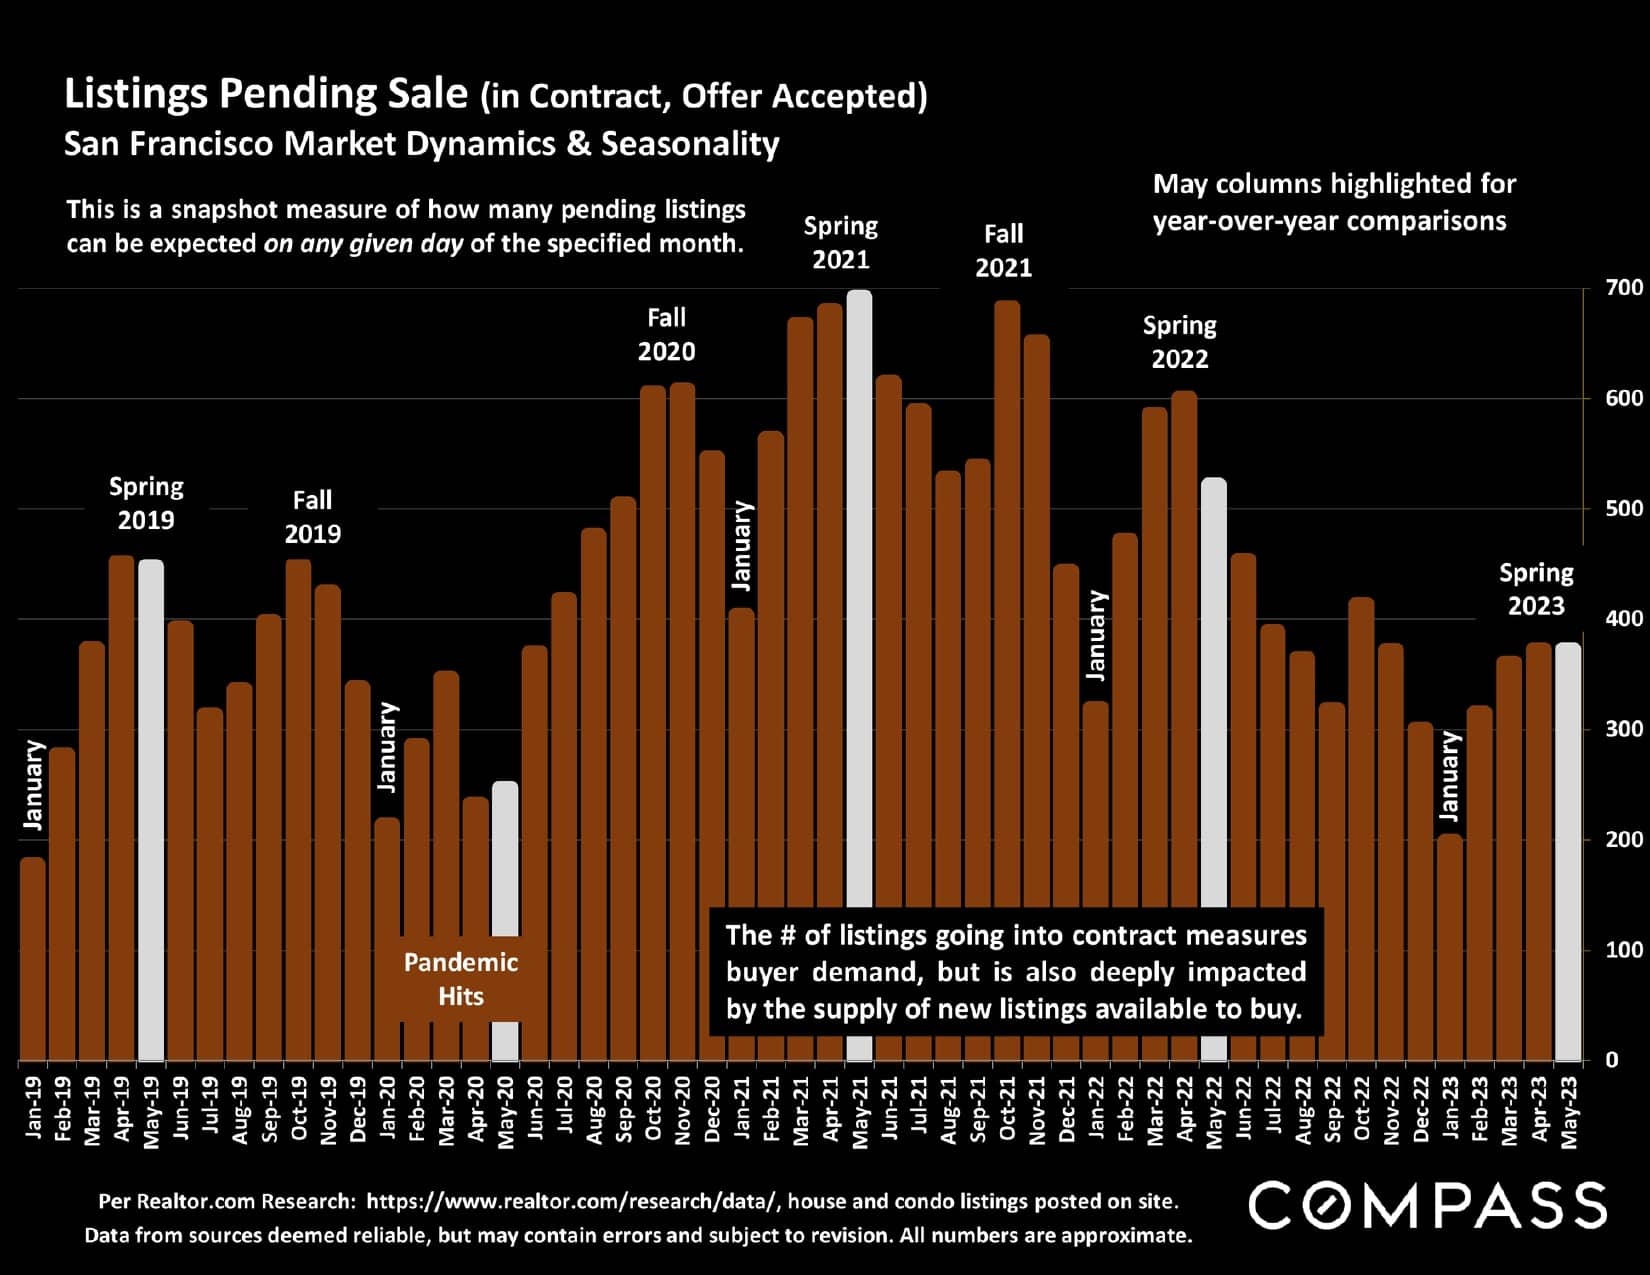
Chart of San Francisco pending listings, January 2019–May 2023, with May year-over-year comparisons highlighted.

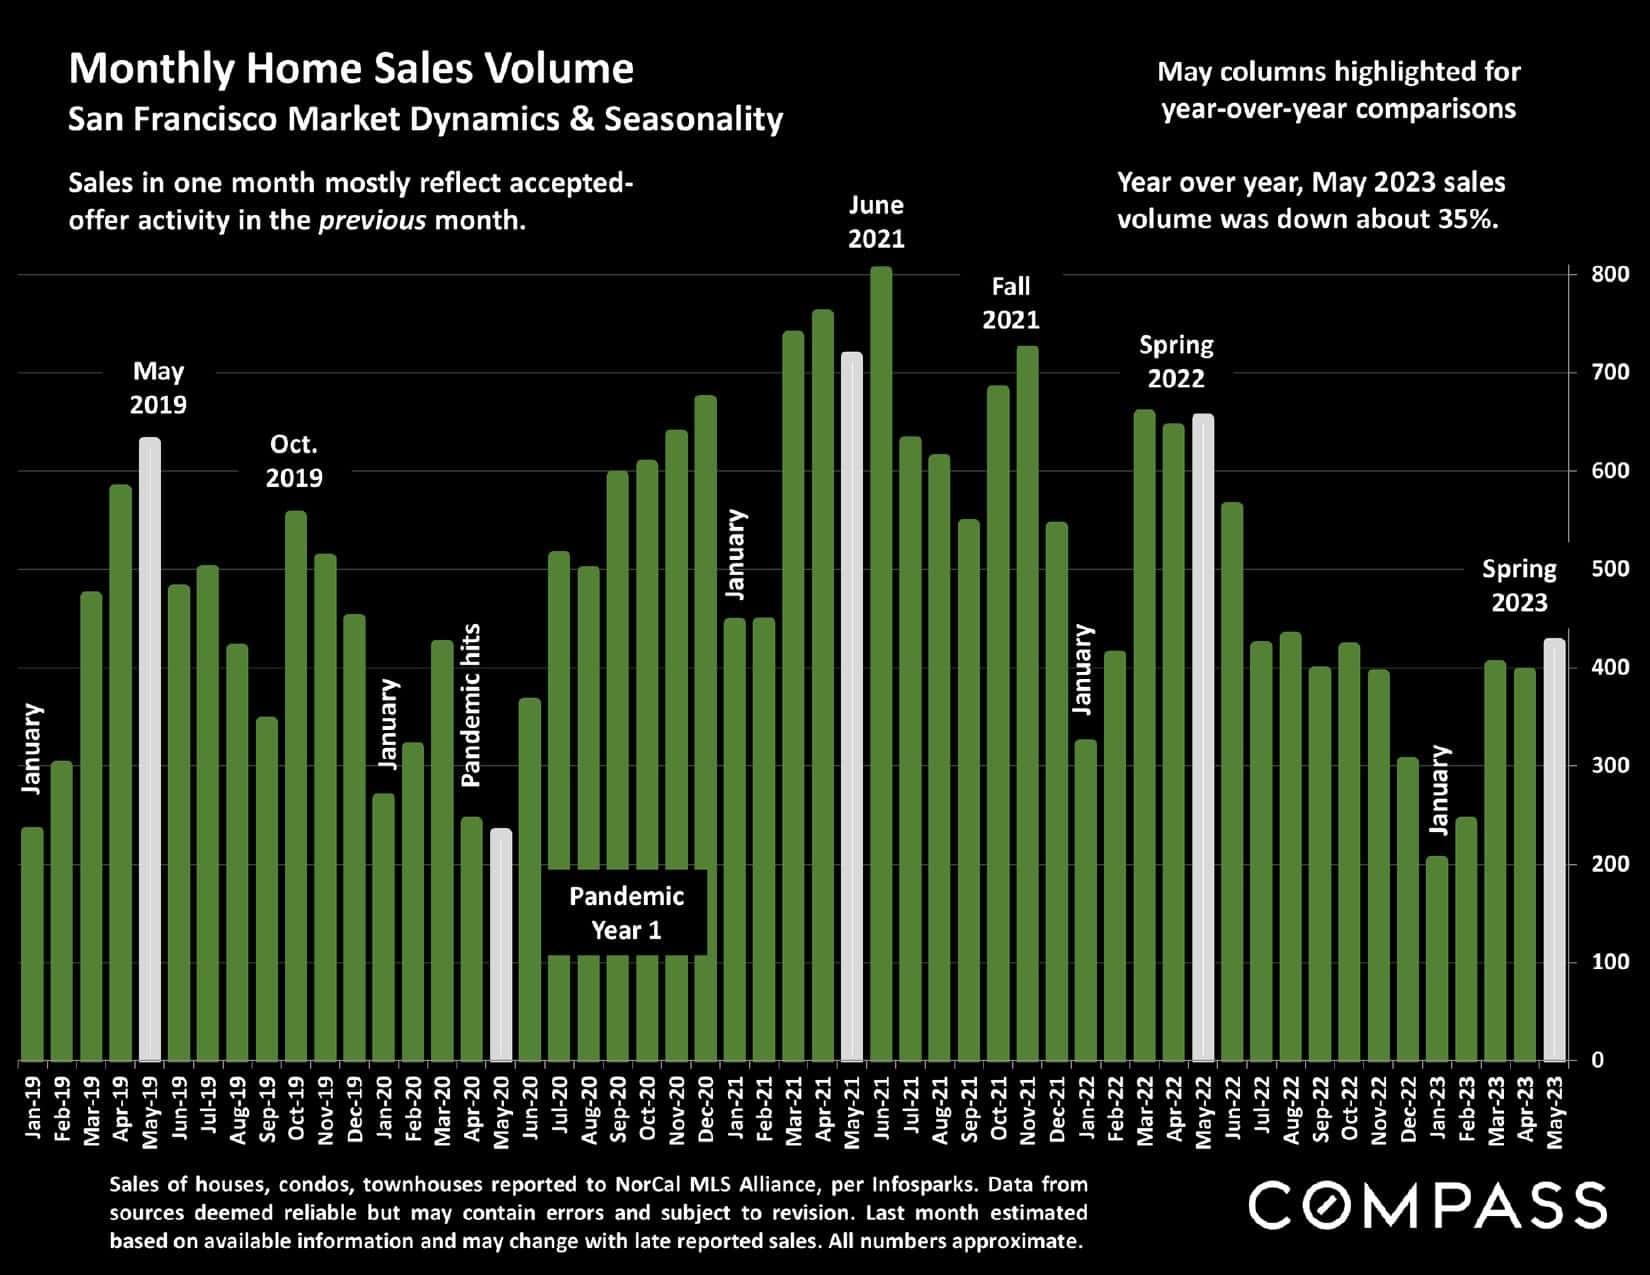
Chart of monthly San Francisco home sales, with May comparisons highlighted and sales volume down about 35% year over year.

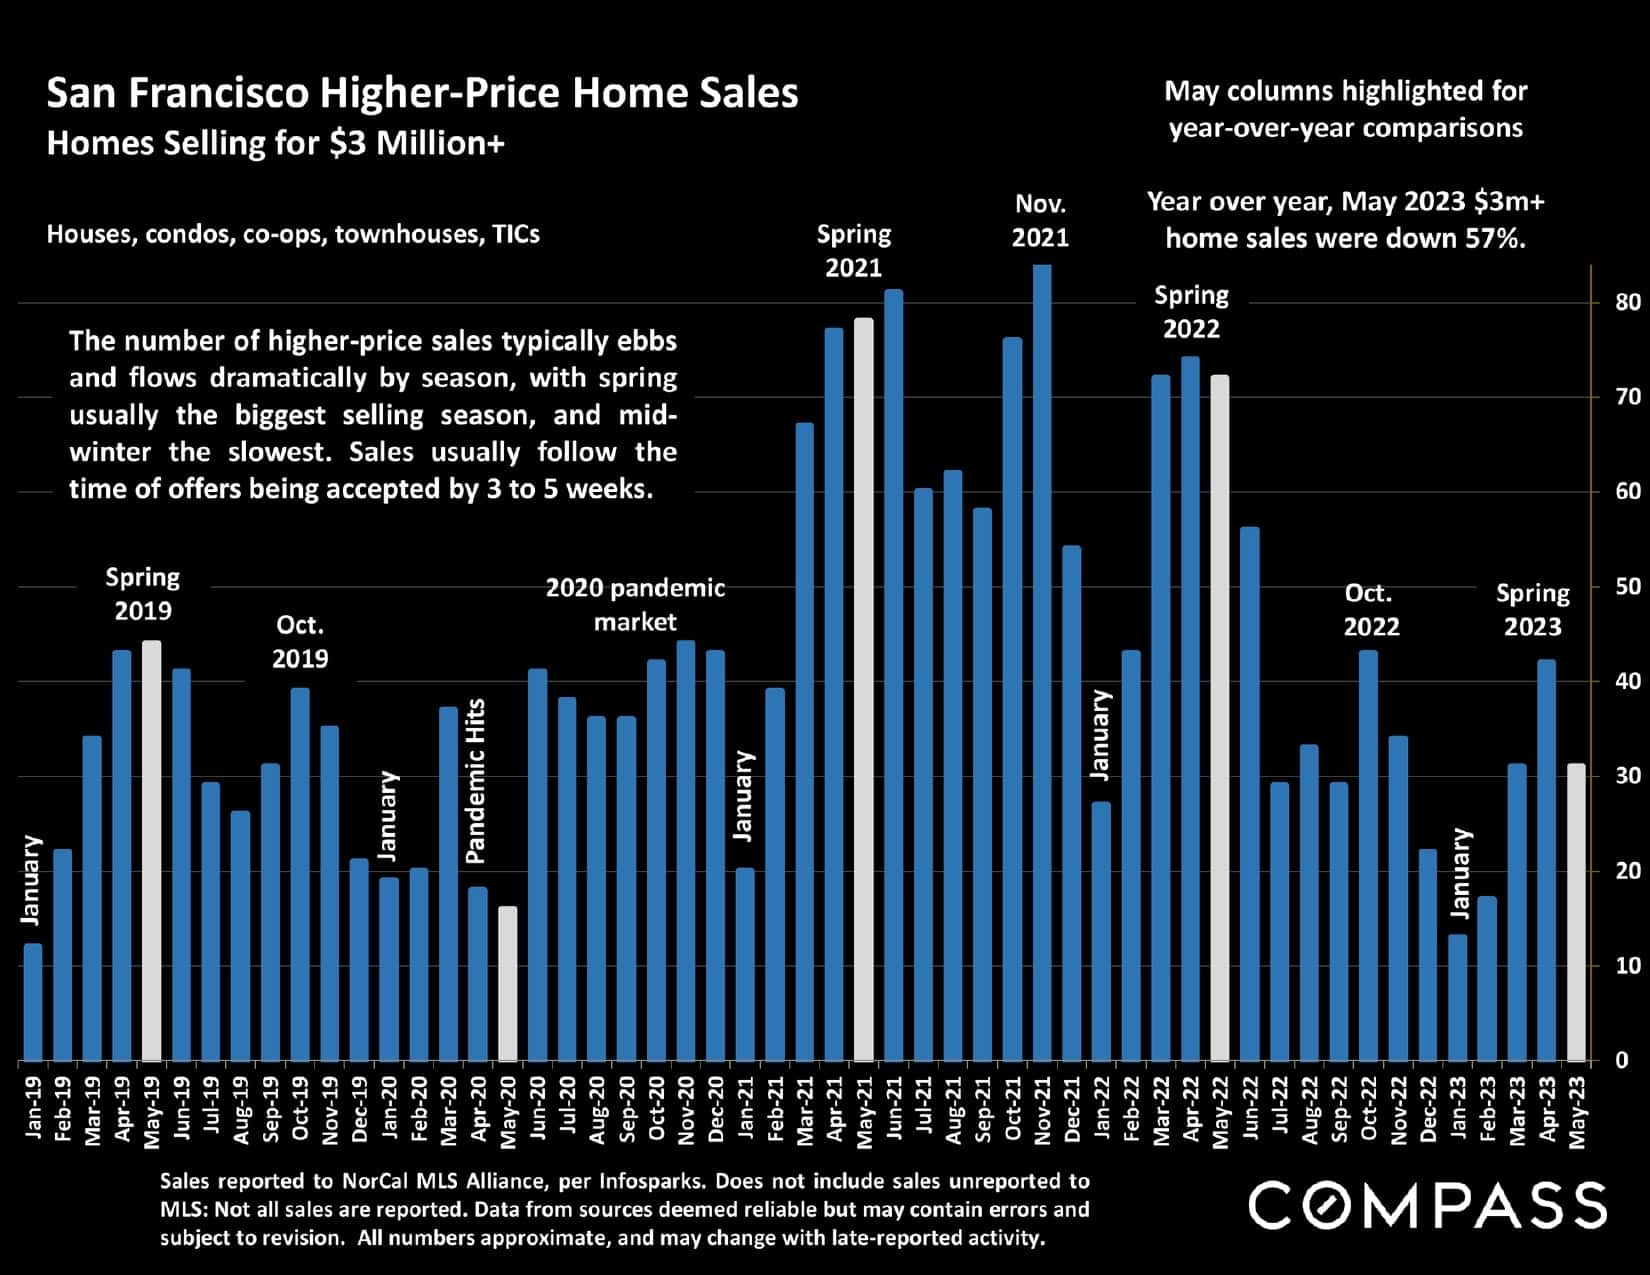
Bar chart of San Francisco $3 million-plus home sales, with May 2023 sales down 57% year over year.

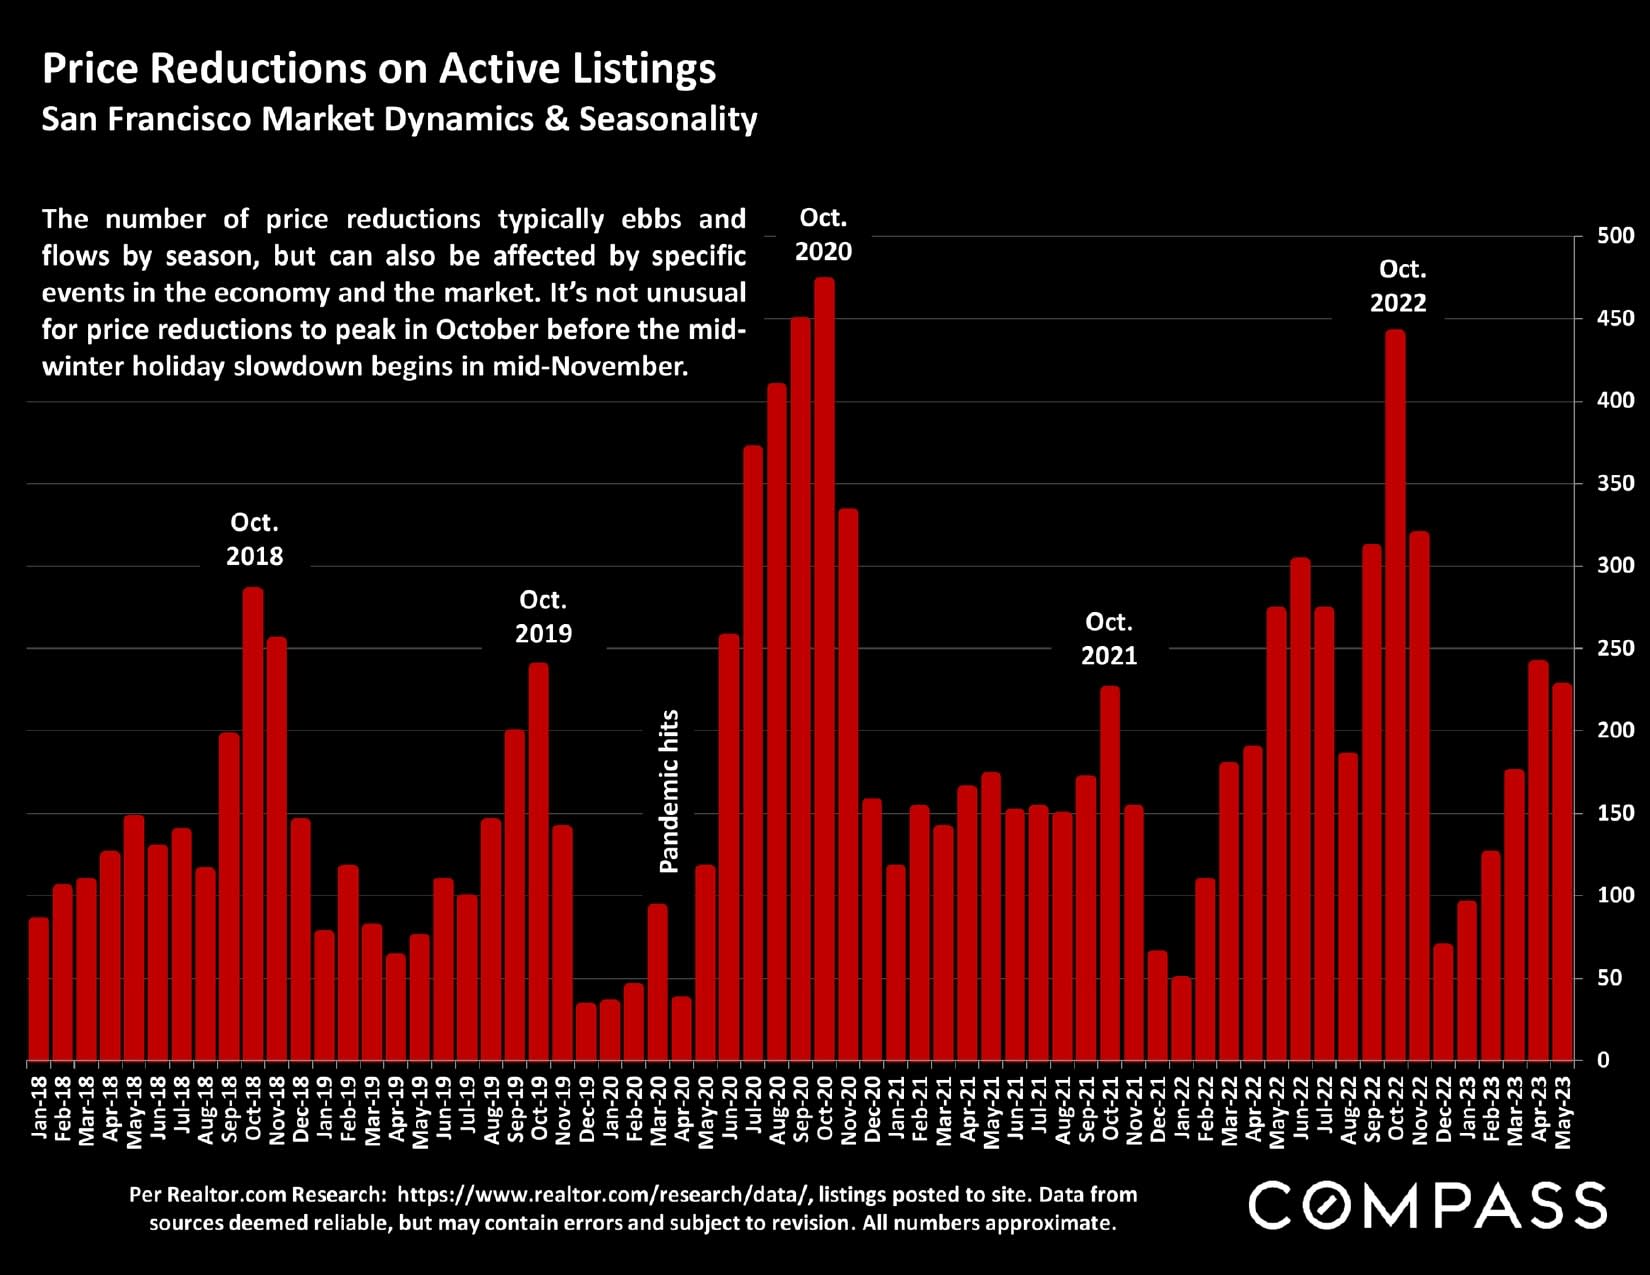
Bar chart of monthly active-listing price reductions, January 2018 to May 2023, with October peaks and a pandemic marker.

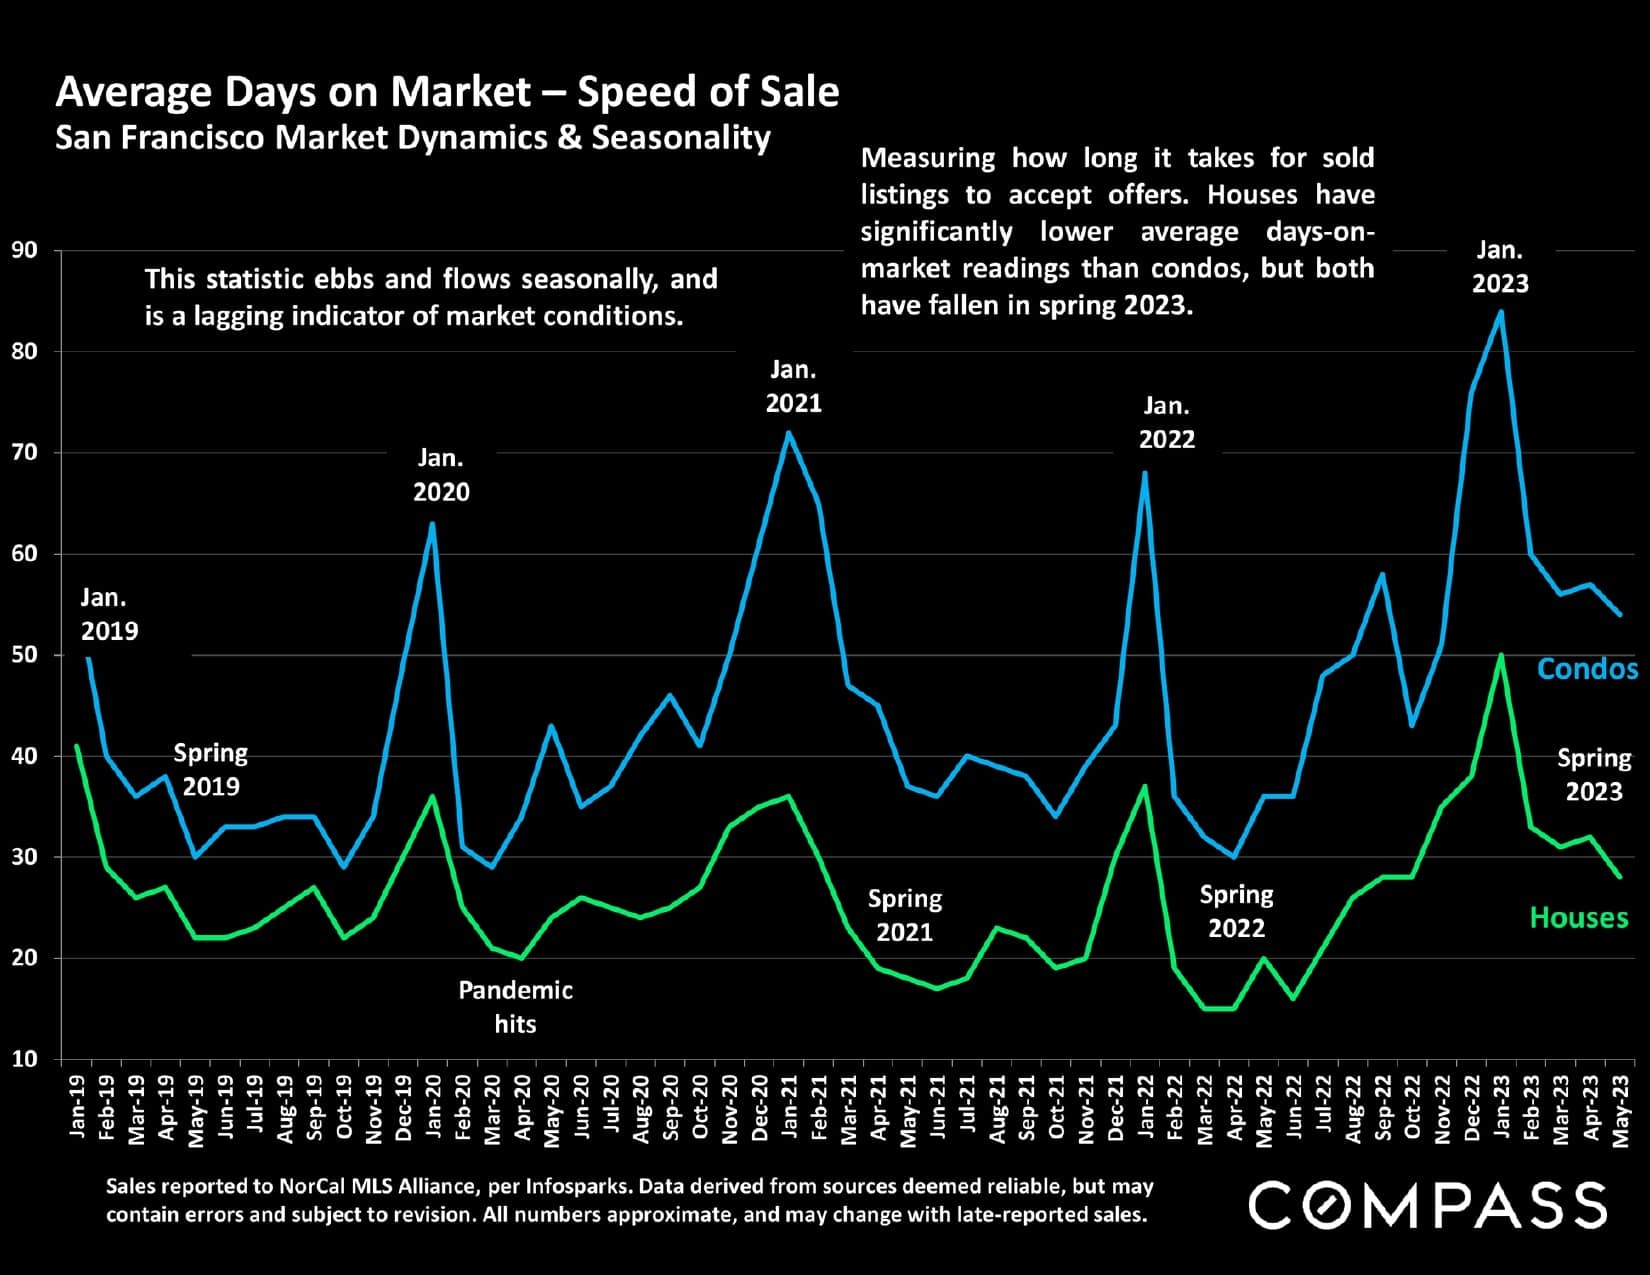
Chart of San Francisco days on market for condos and houses, January 2019–May 2023, with both falling in spring 2023.

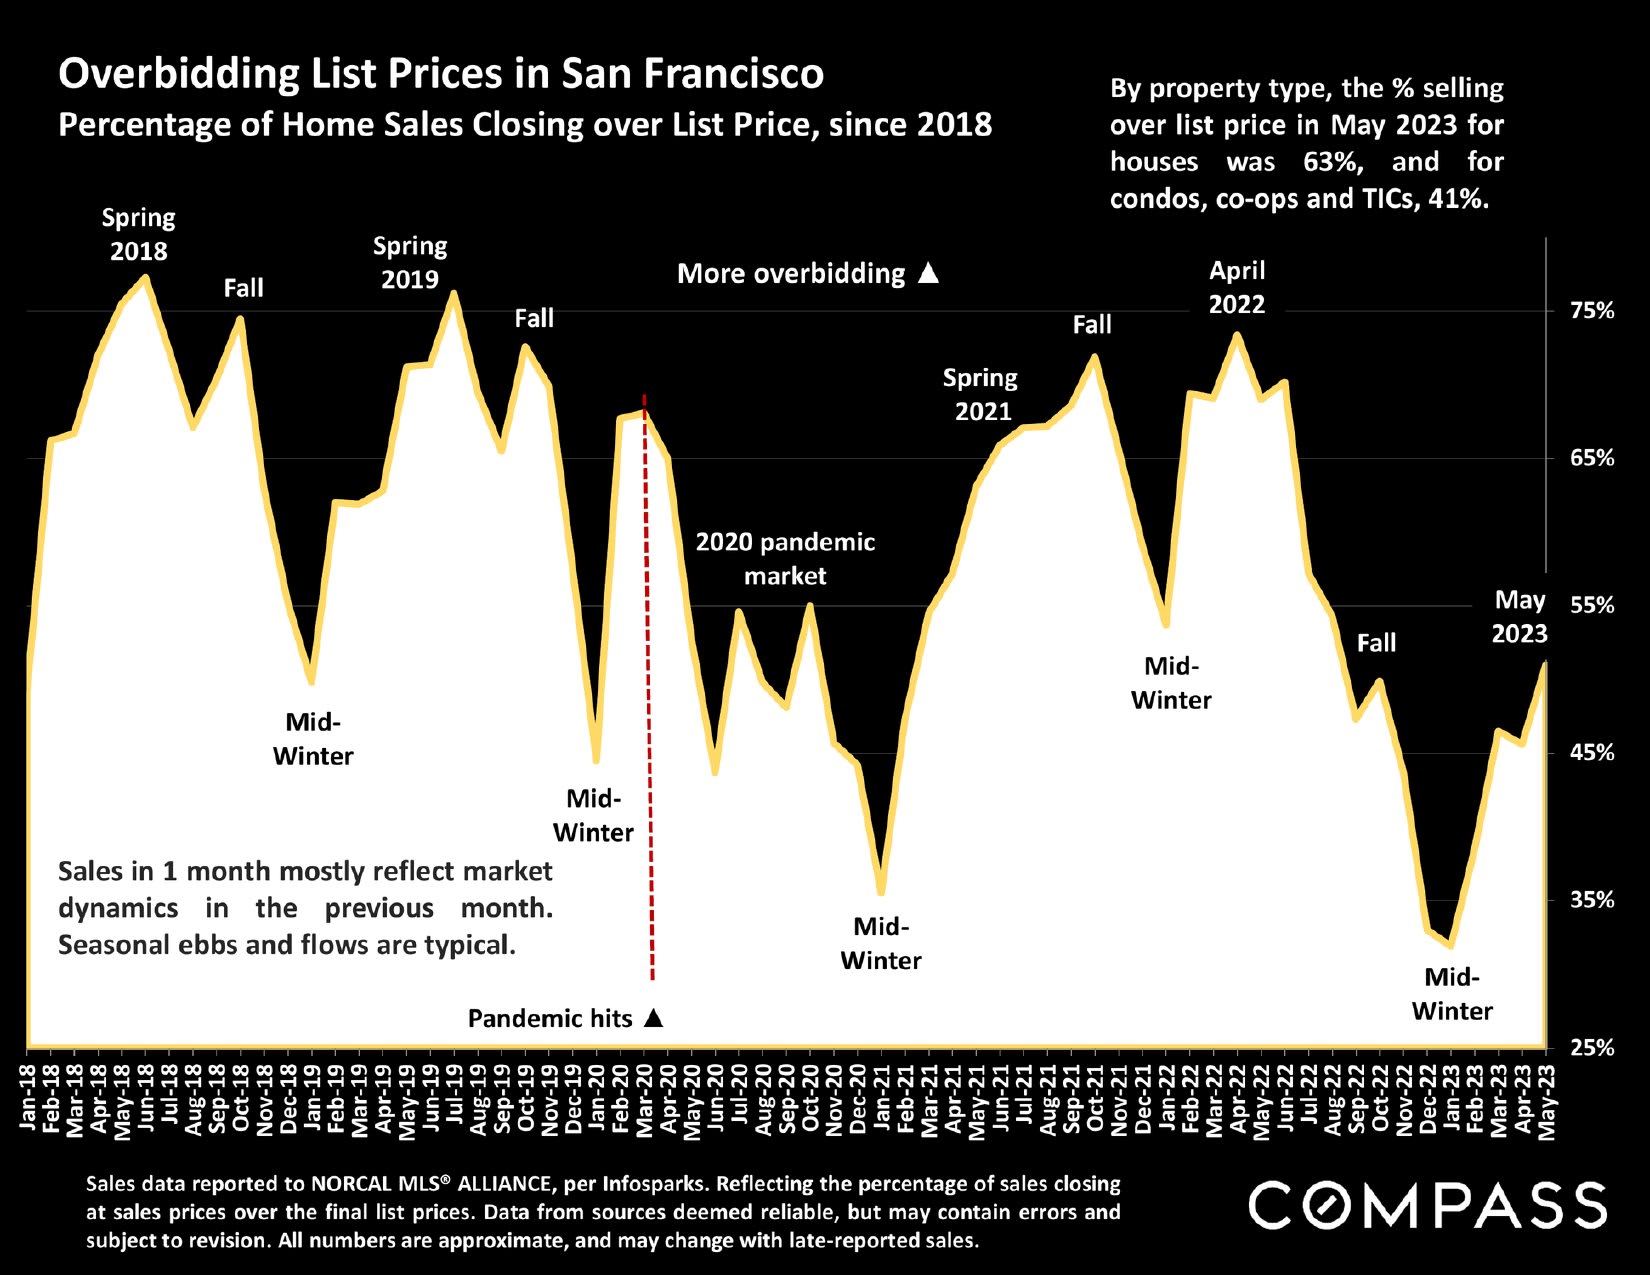
San Francisco chart of home sales closing over list price, 2018–2023, with May 2023 rates for houses and condos.

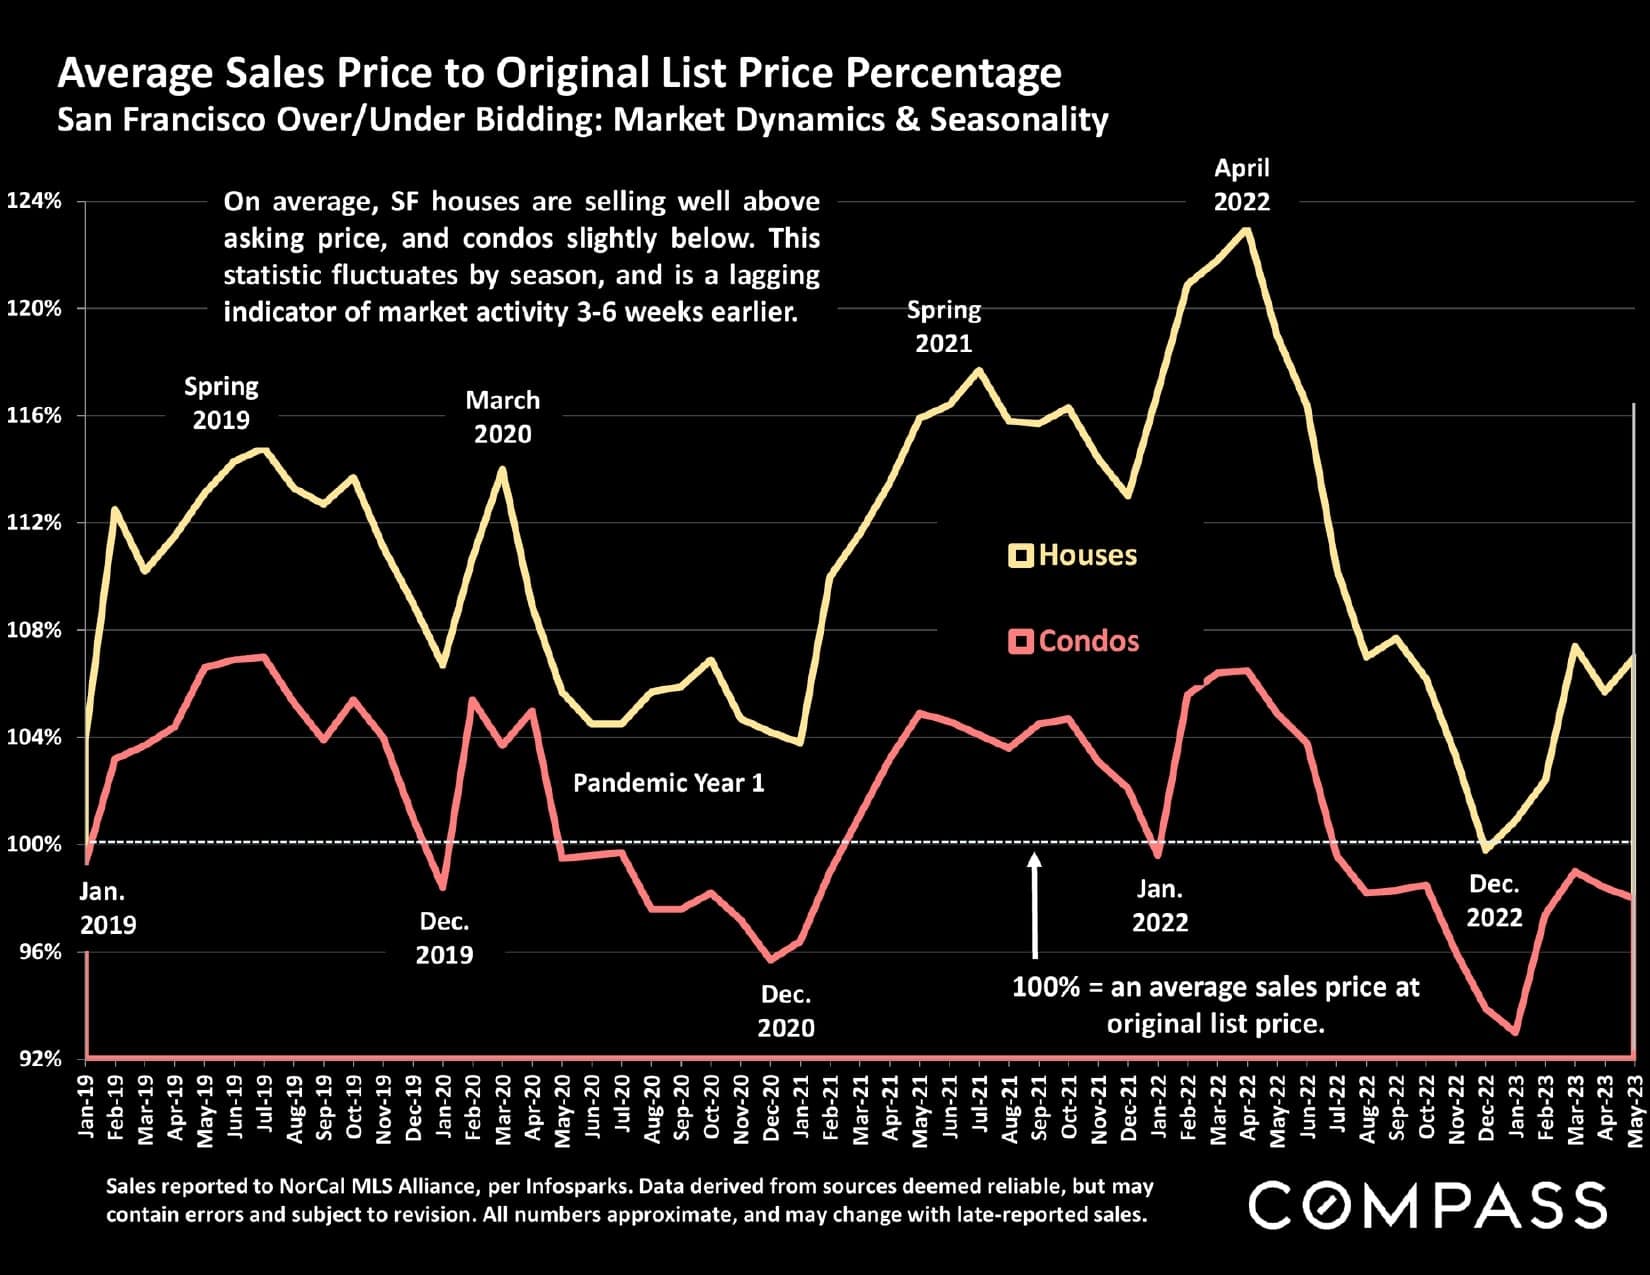
Chart comparing San Francisco house and condo sale prices with original list prices, January 2019 to May 2023.

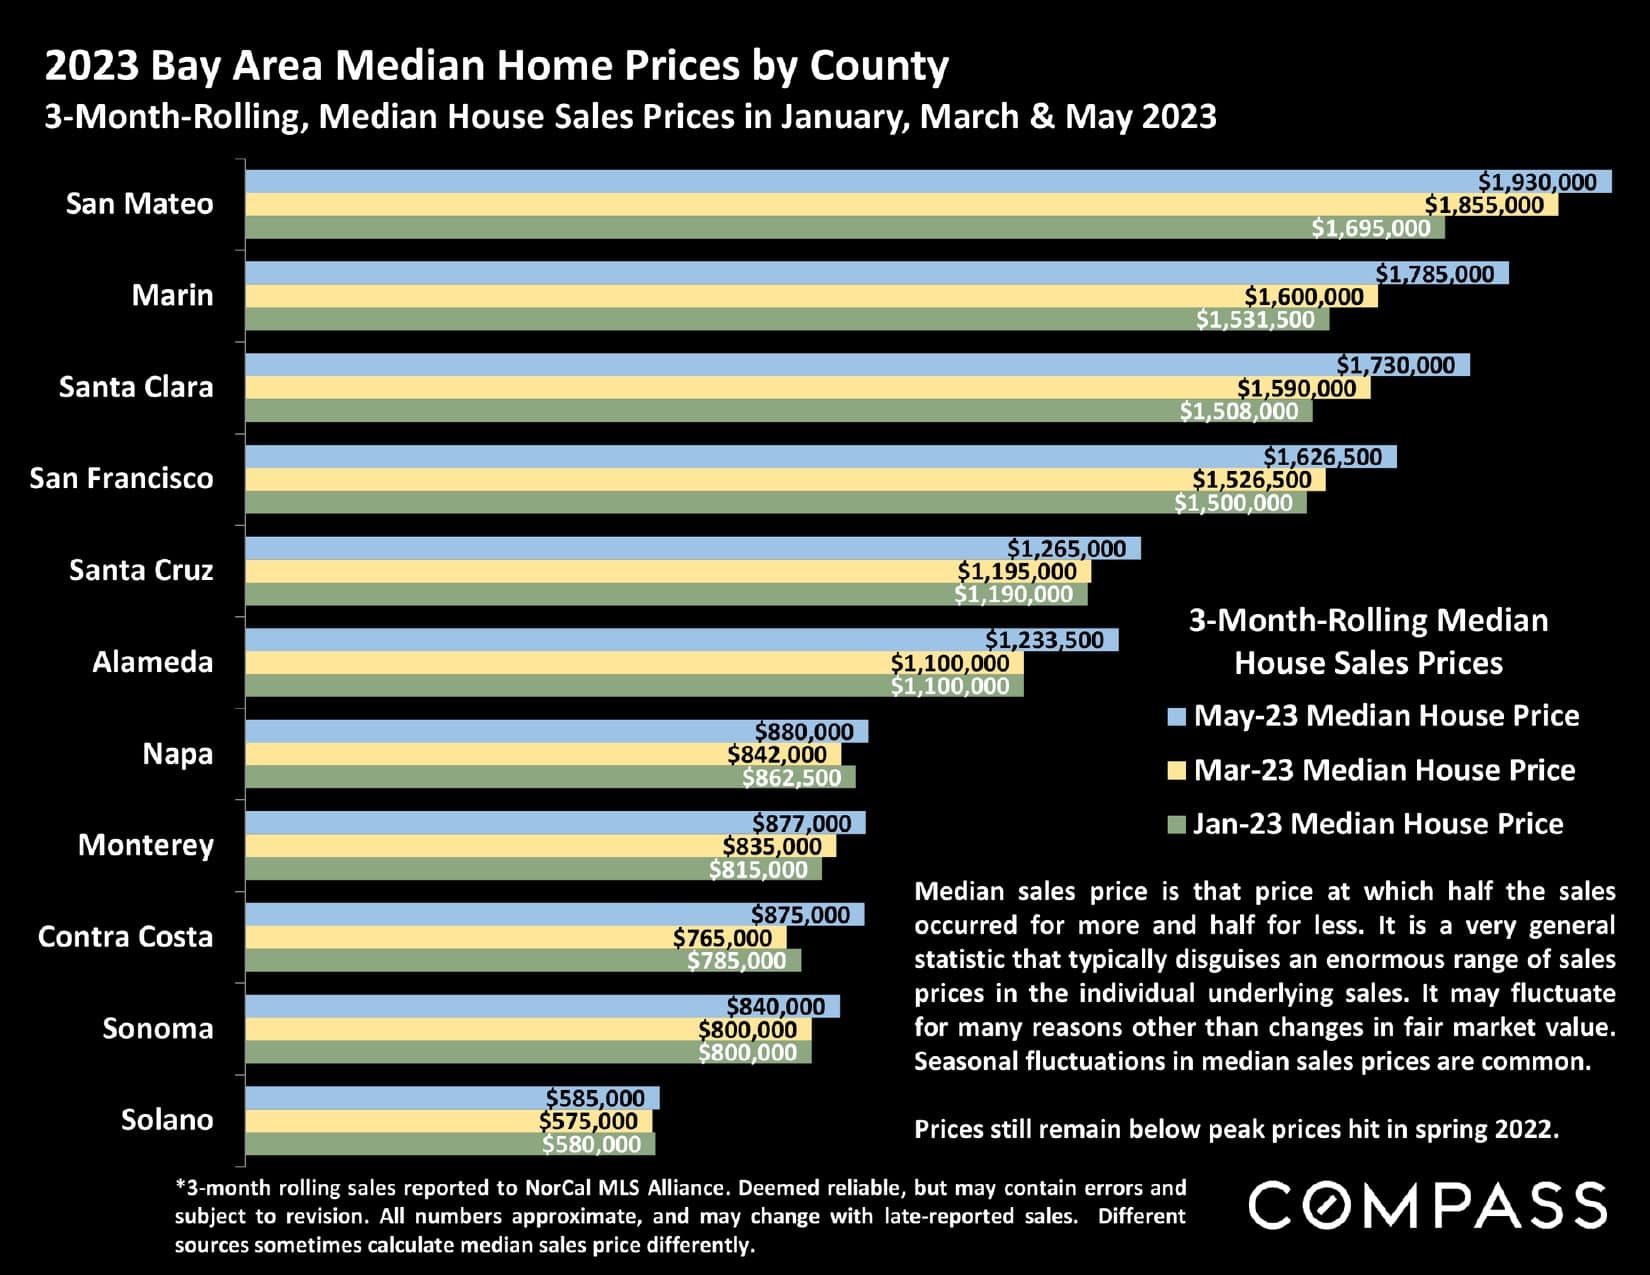
Chart comparing 2023 median home prices across Bay Area counties for January, March, and May.

San Francisco Bay Area luxury home market report promotion with an ornate garden gate and a link to access the report.

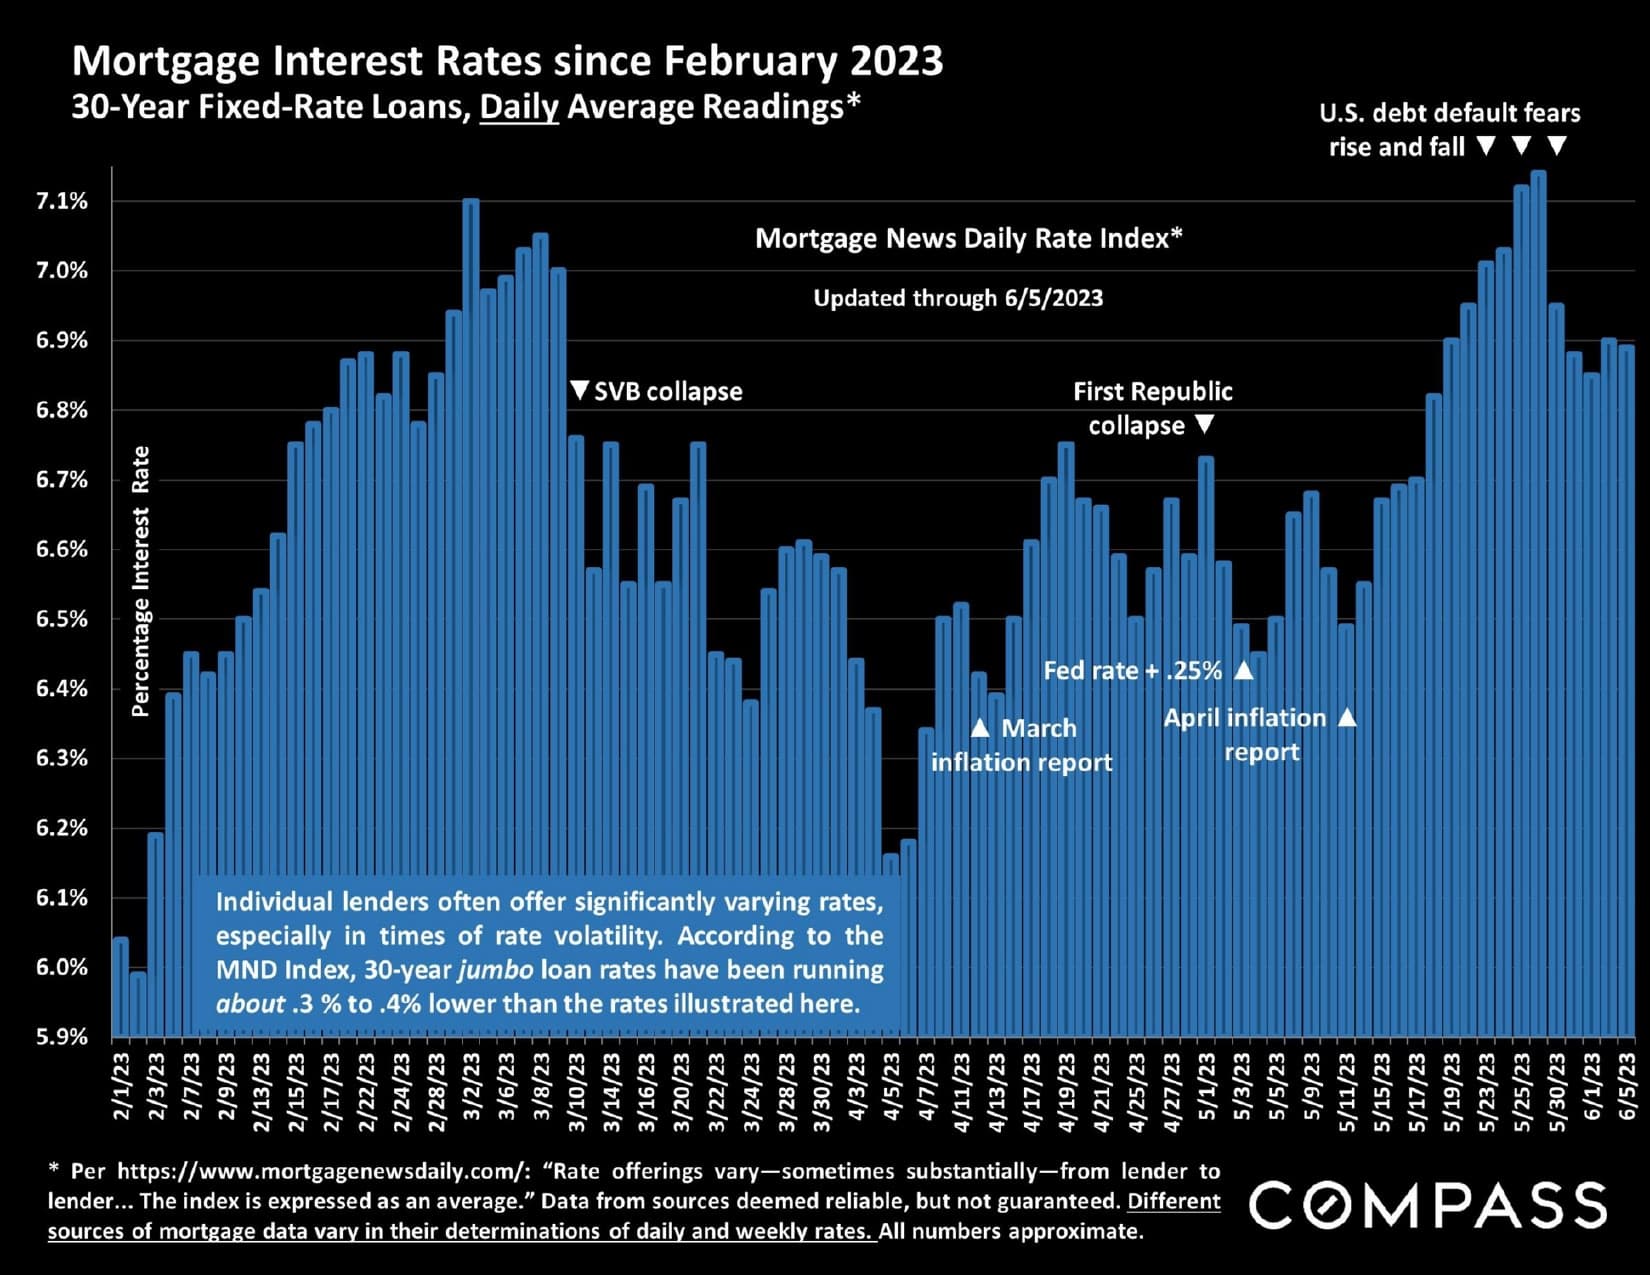
Bar chart of 30-year mortgage rates from February to June 2023, rising to about 7.1% in late May.

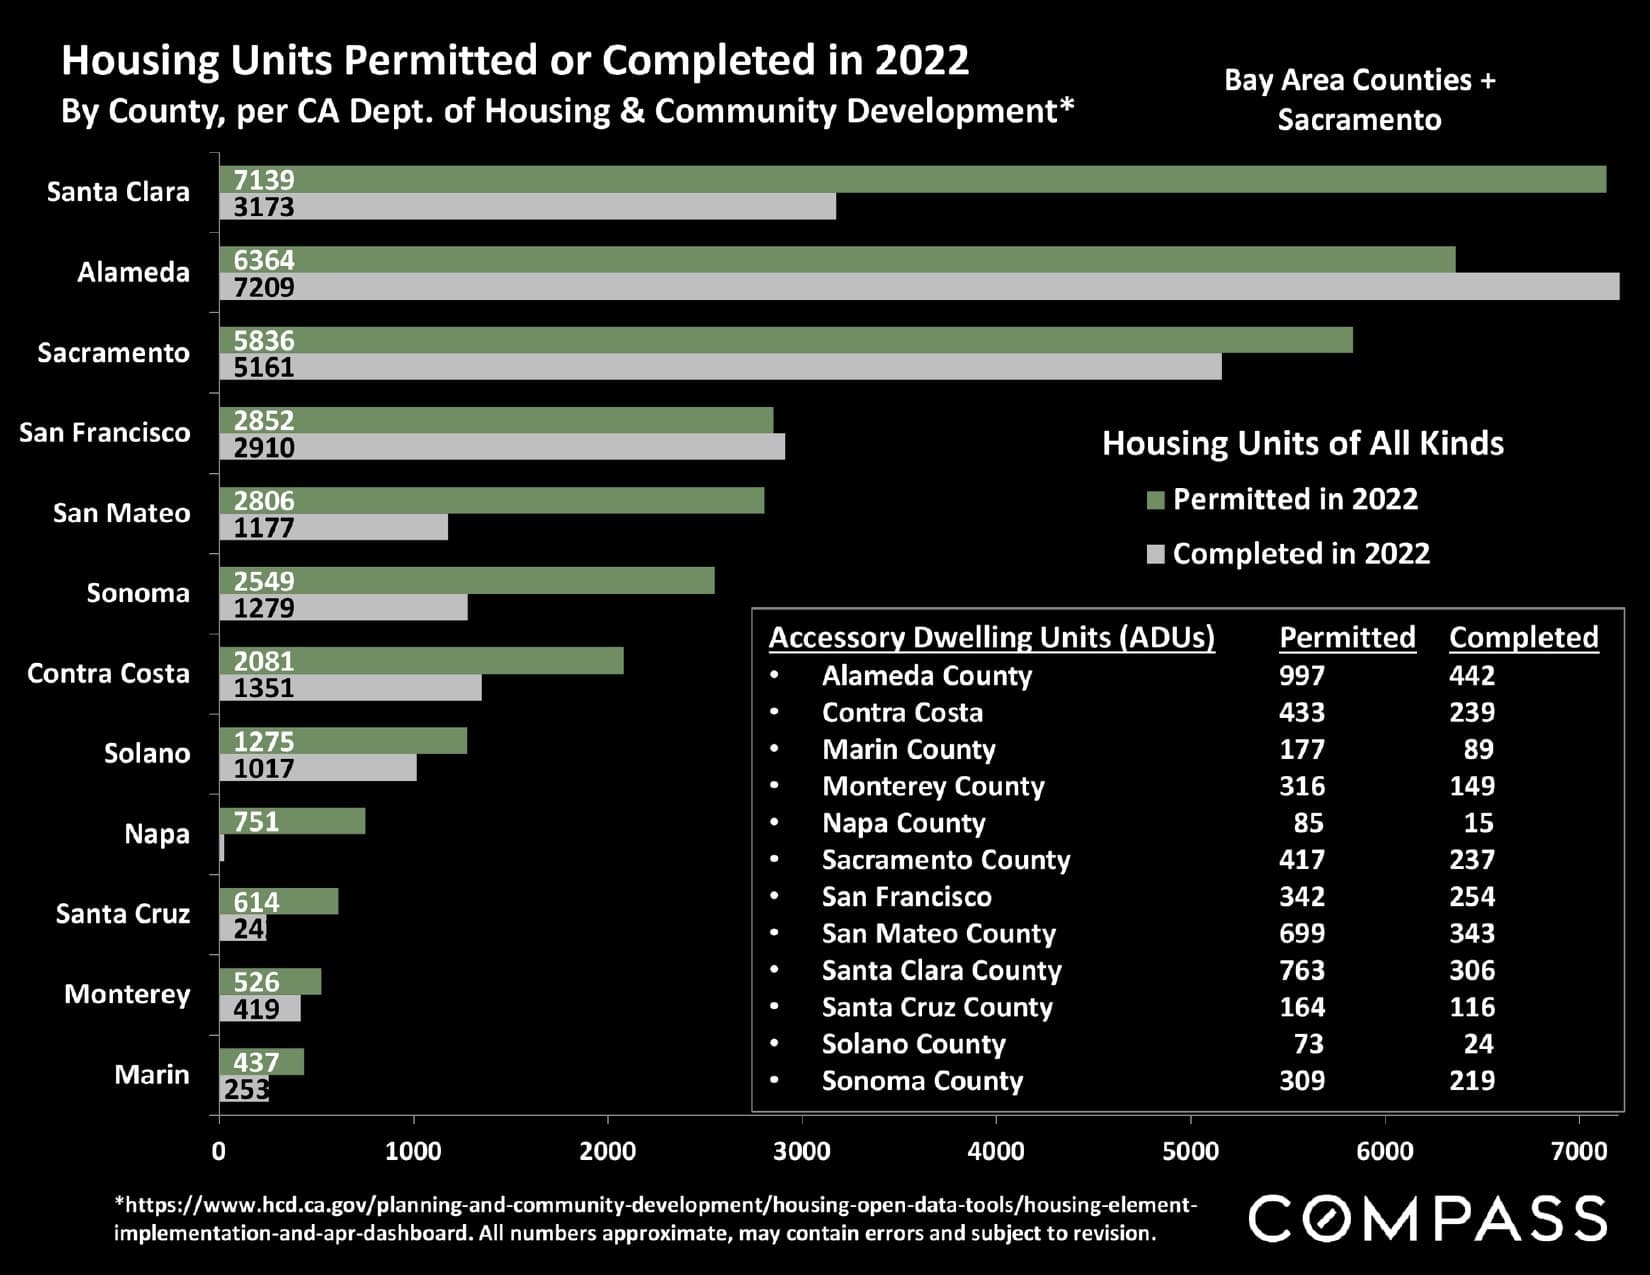
Chart comparing housing units permitted and completed in 2022 across Bay Area counties and Sacramento, including ADU totals.

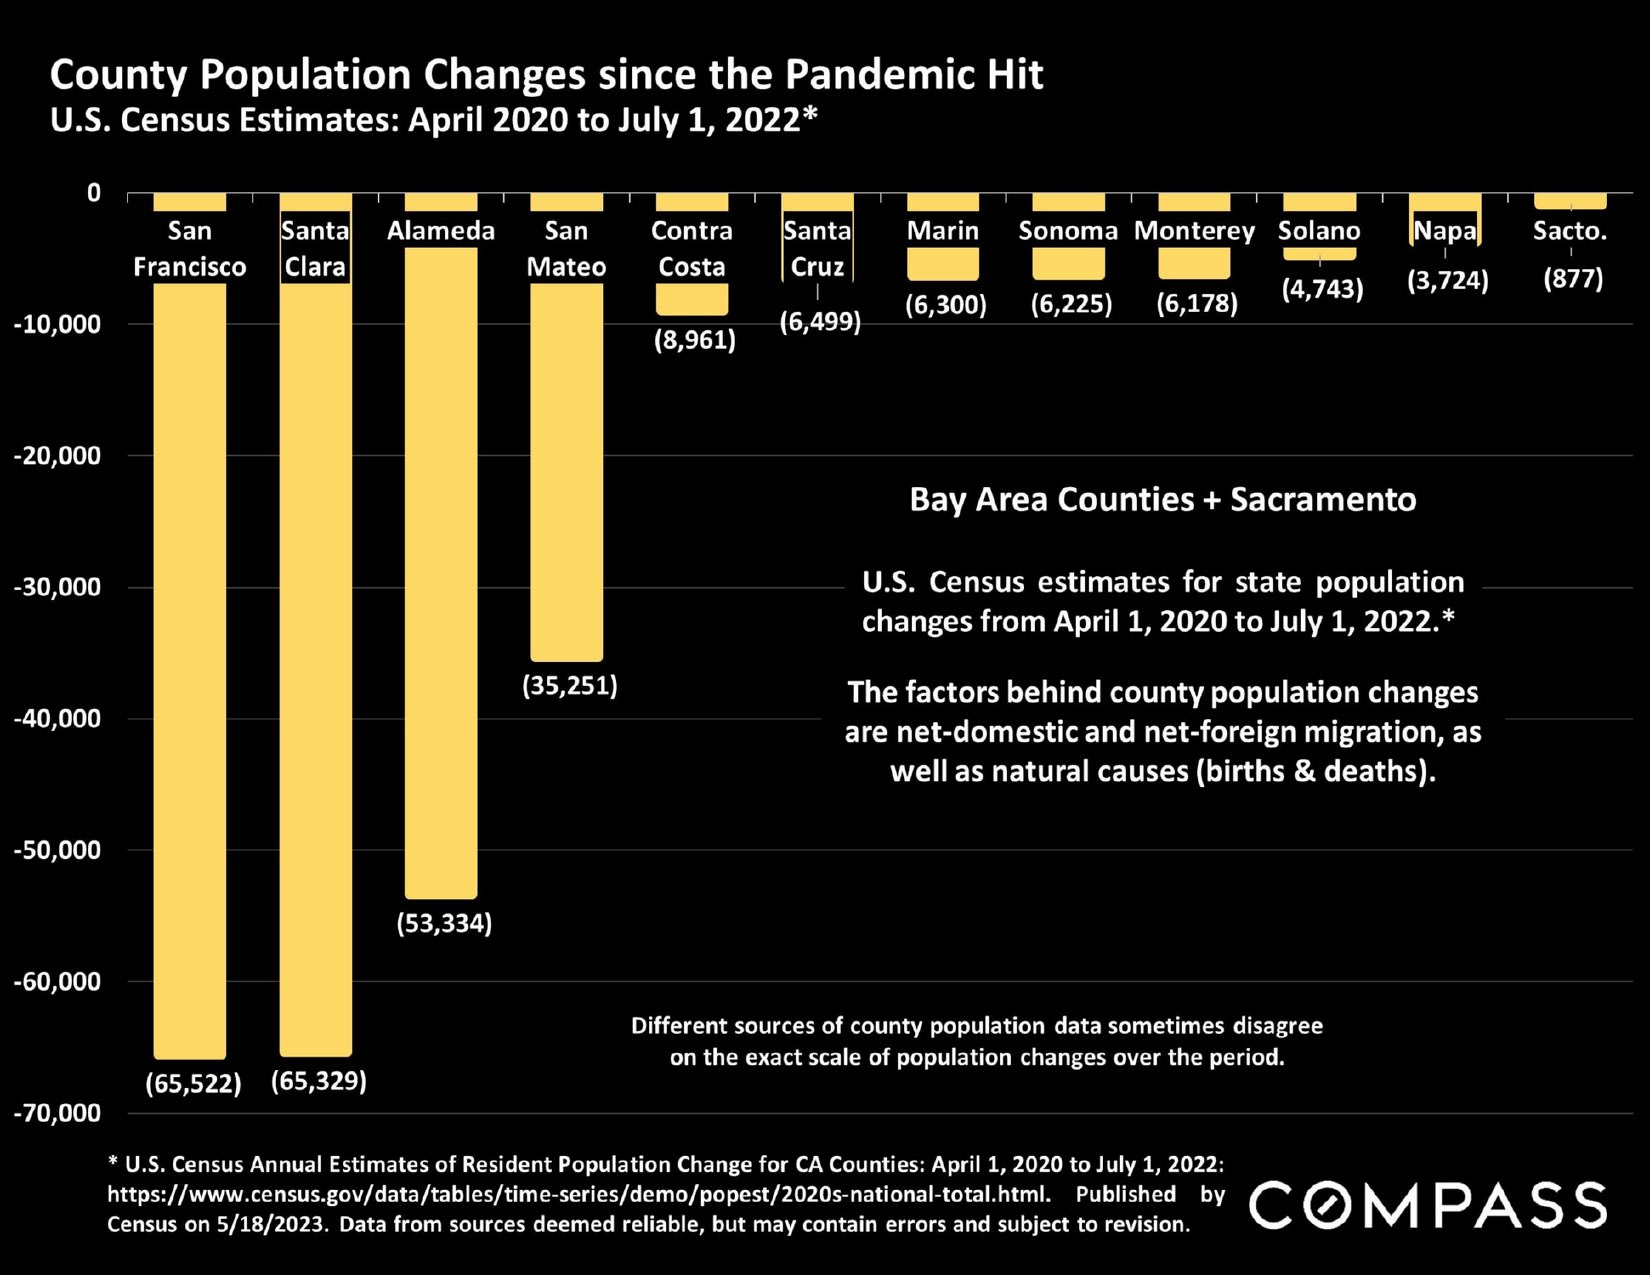
Chart of county population declines since the pandemic, with the largest losses in San Francisco and Santa Clara.

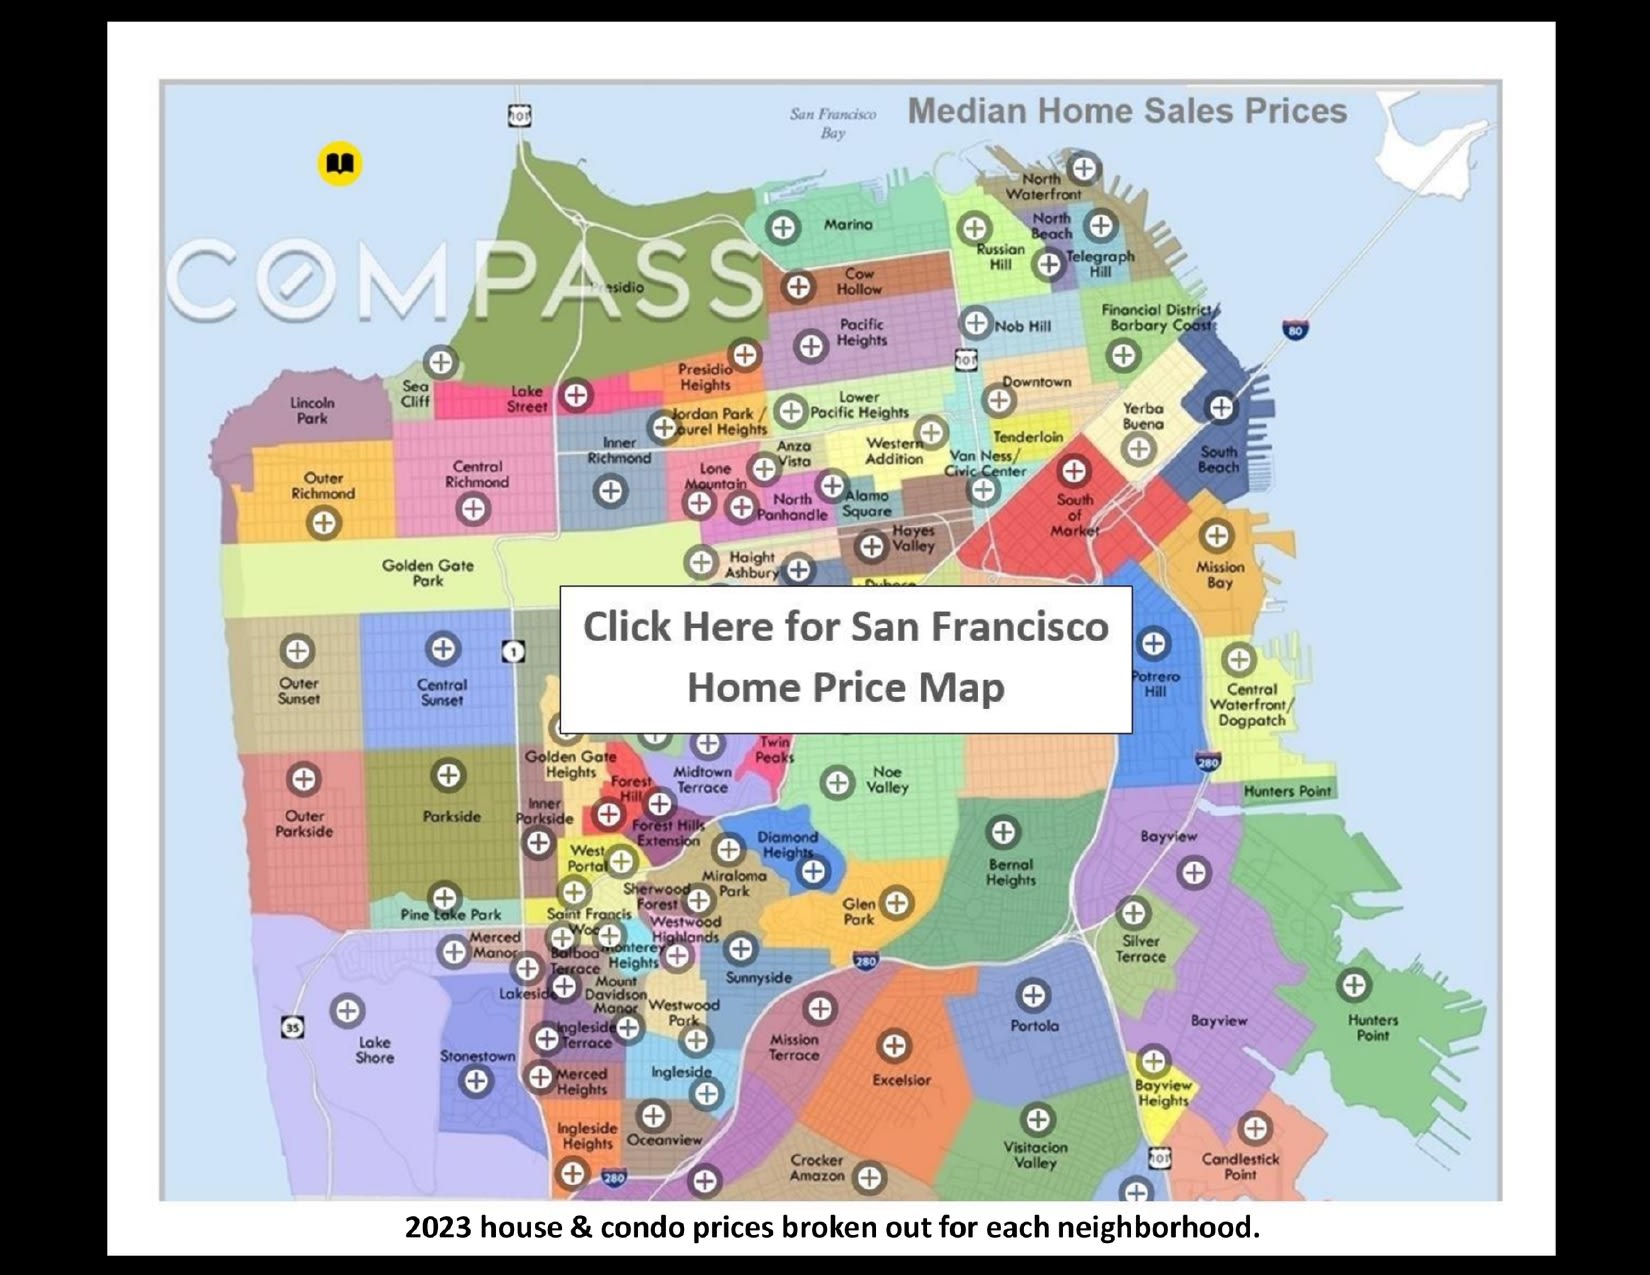
Color-coded San Francisco neighborhood map of median home sales prices, with a link prompt to view the home price map.

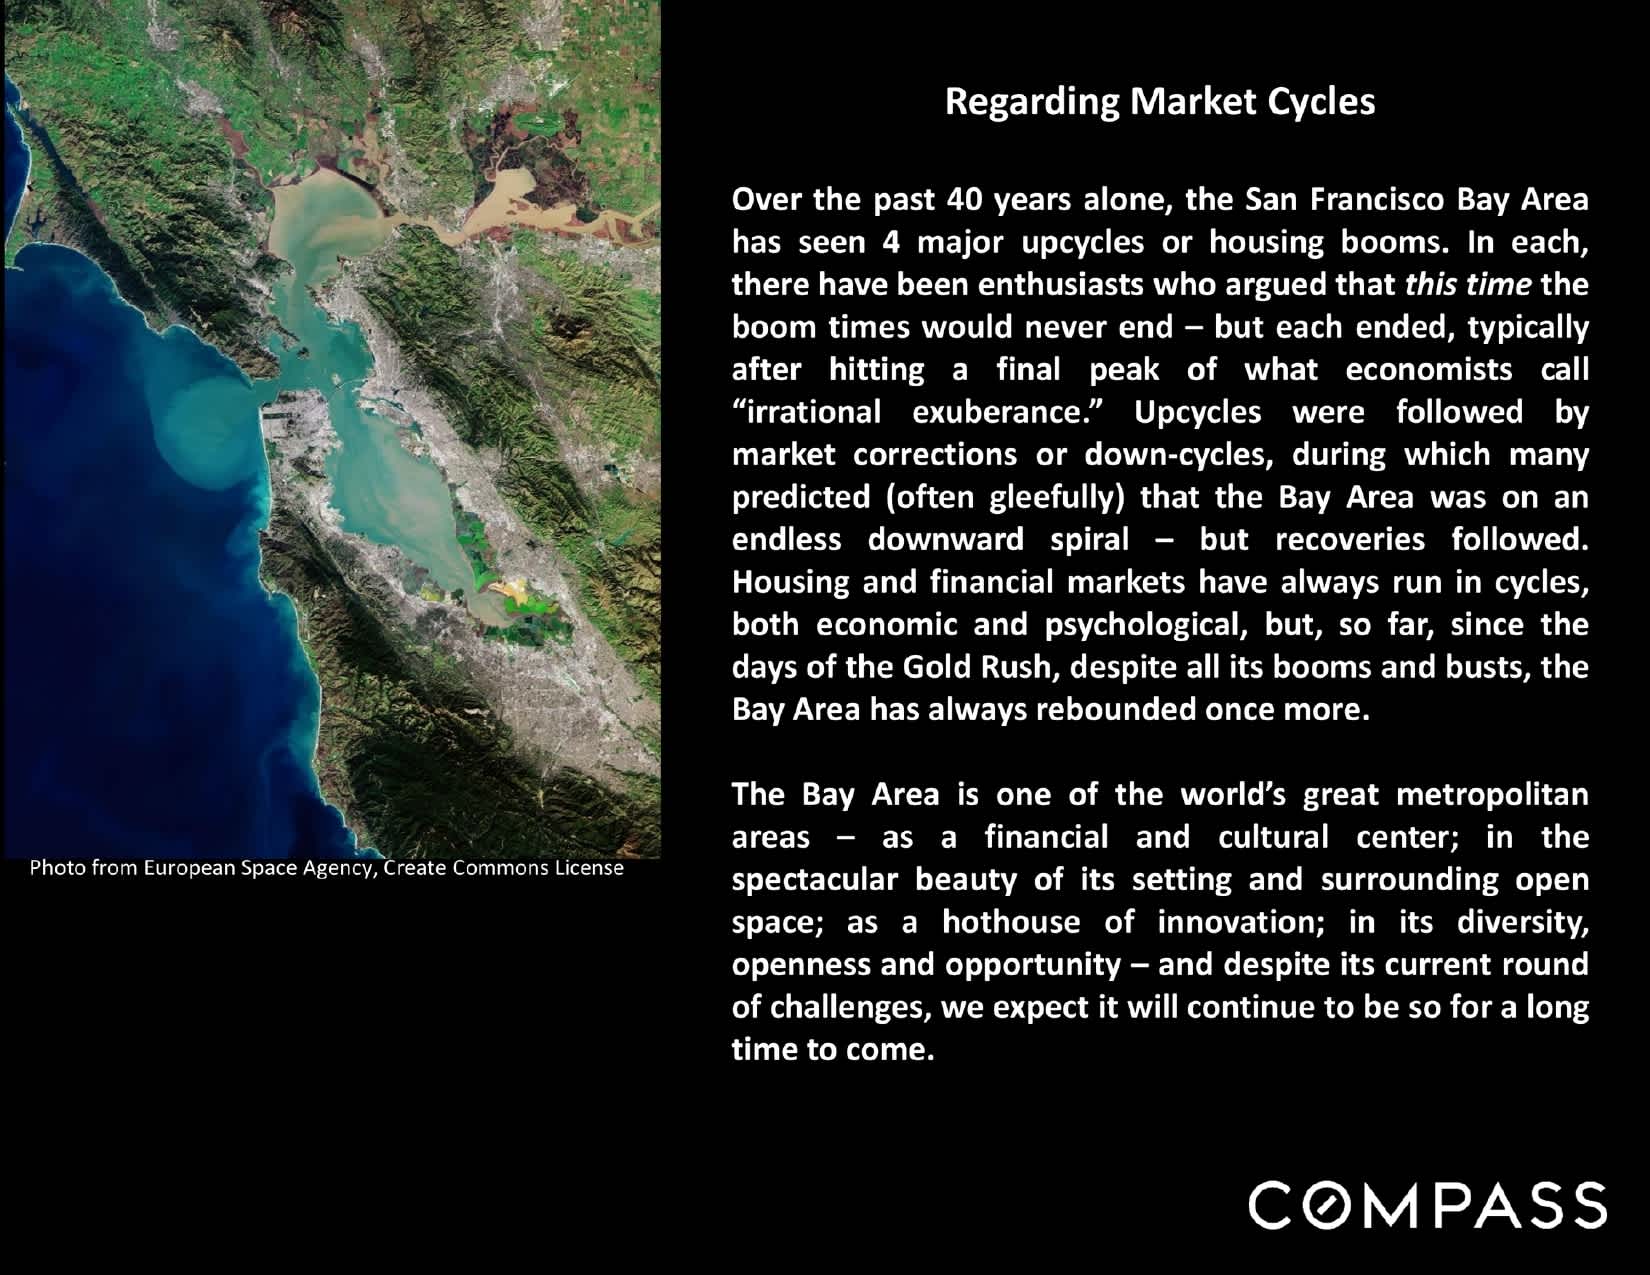
Market update graphic describing Bay Area housing cycles, alongside a satellite view of the San Francisco Bay Area.

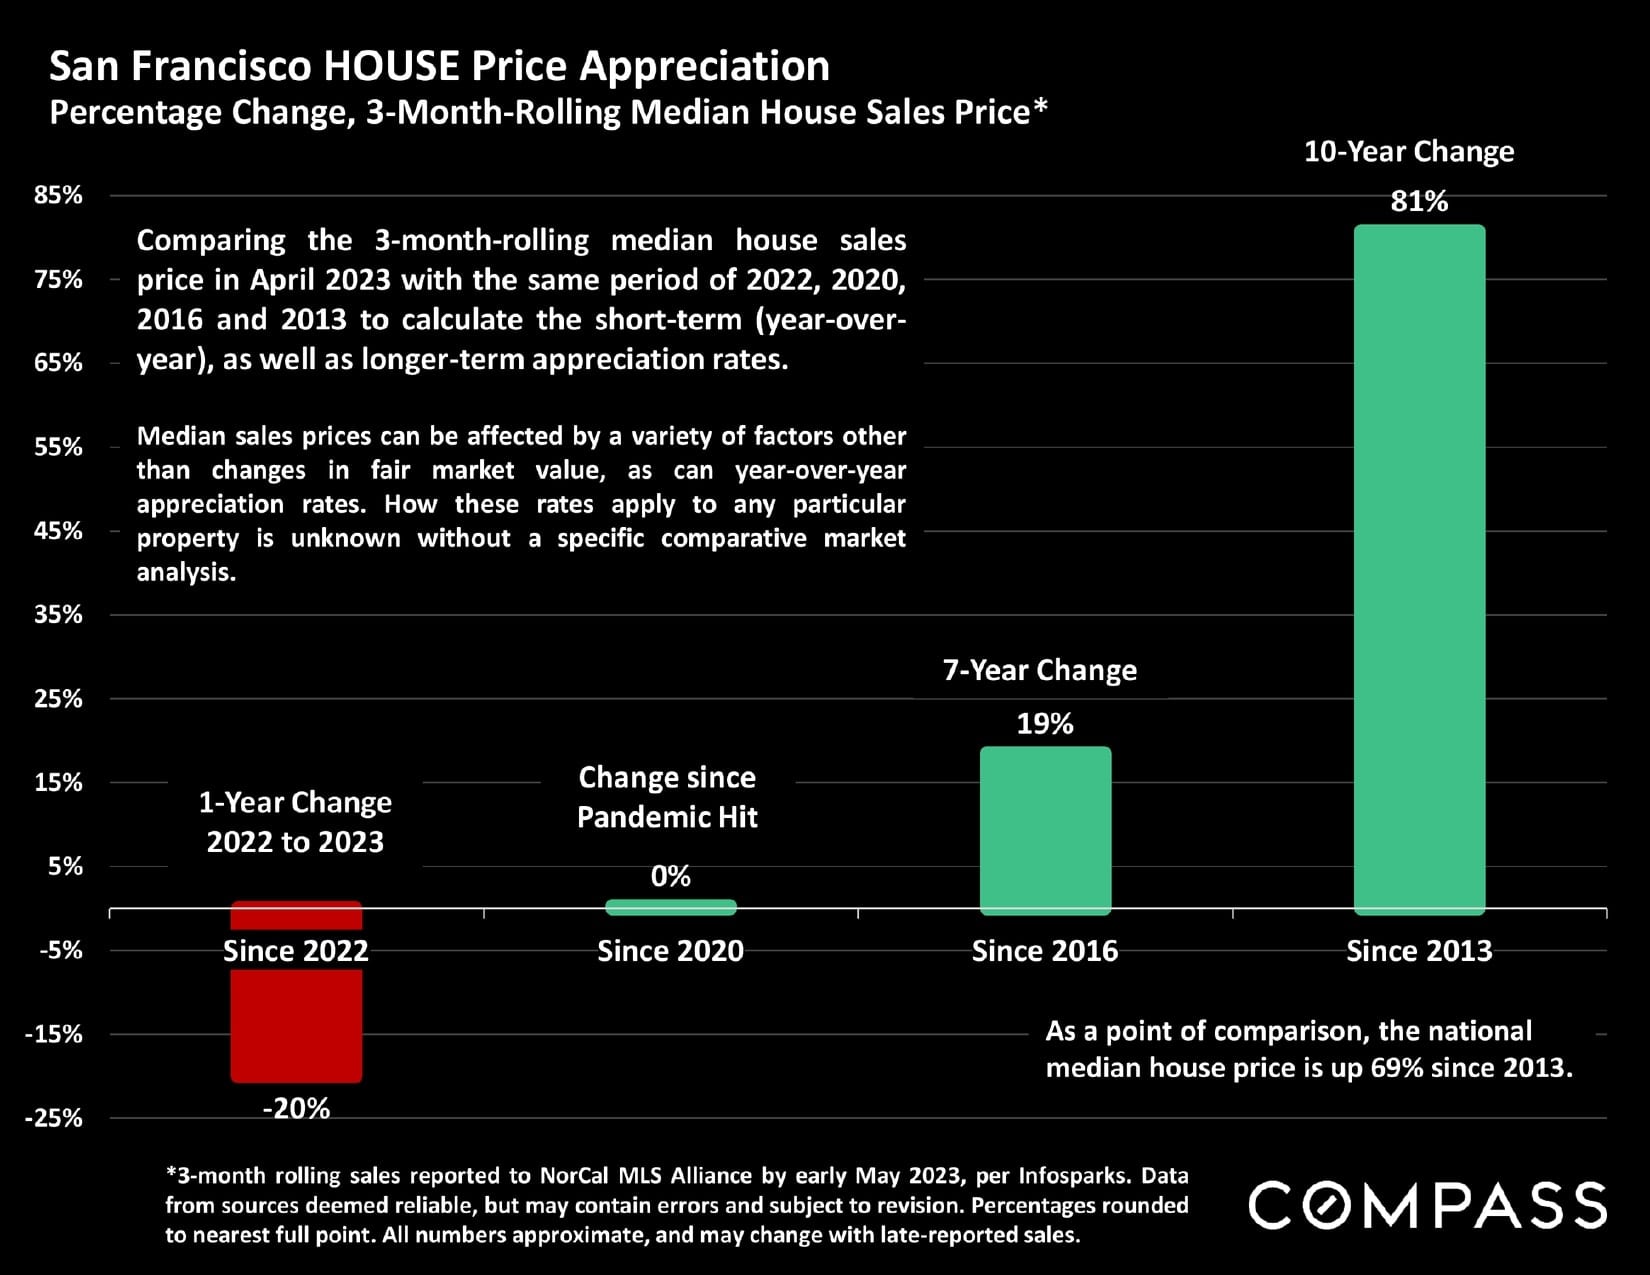
Chart of San Francisco house-price changes: down 20% since 2022, flat since 2020, up 19% since 2016 and 81% since 2013.

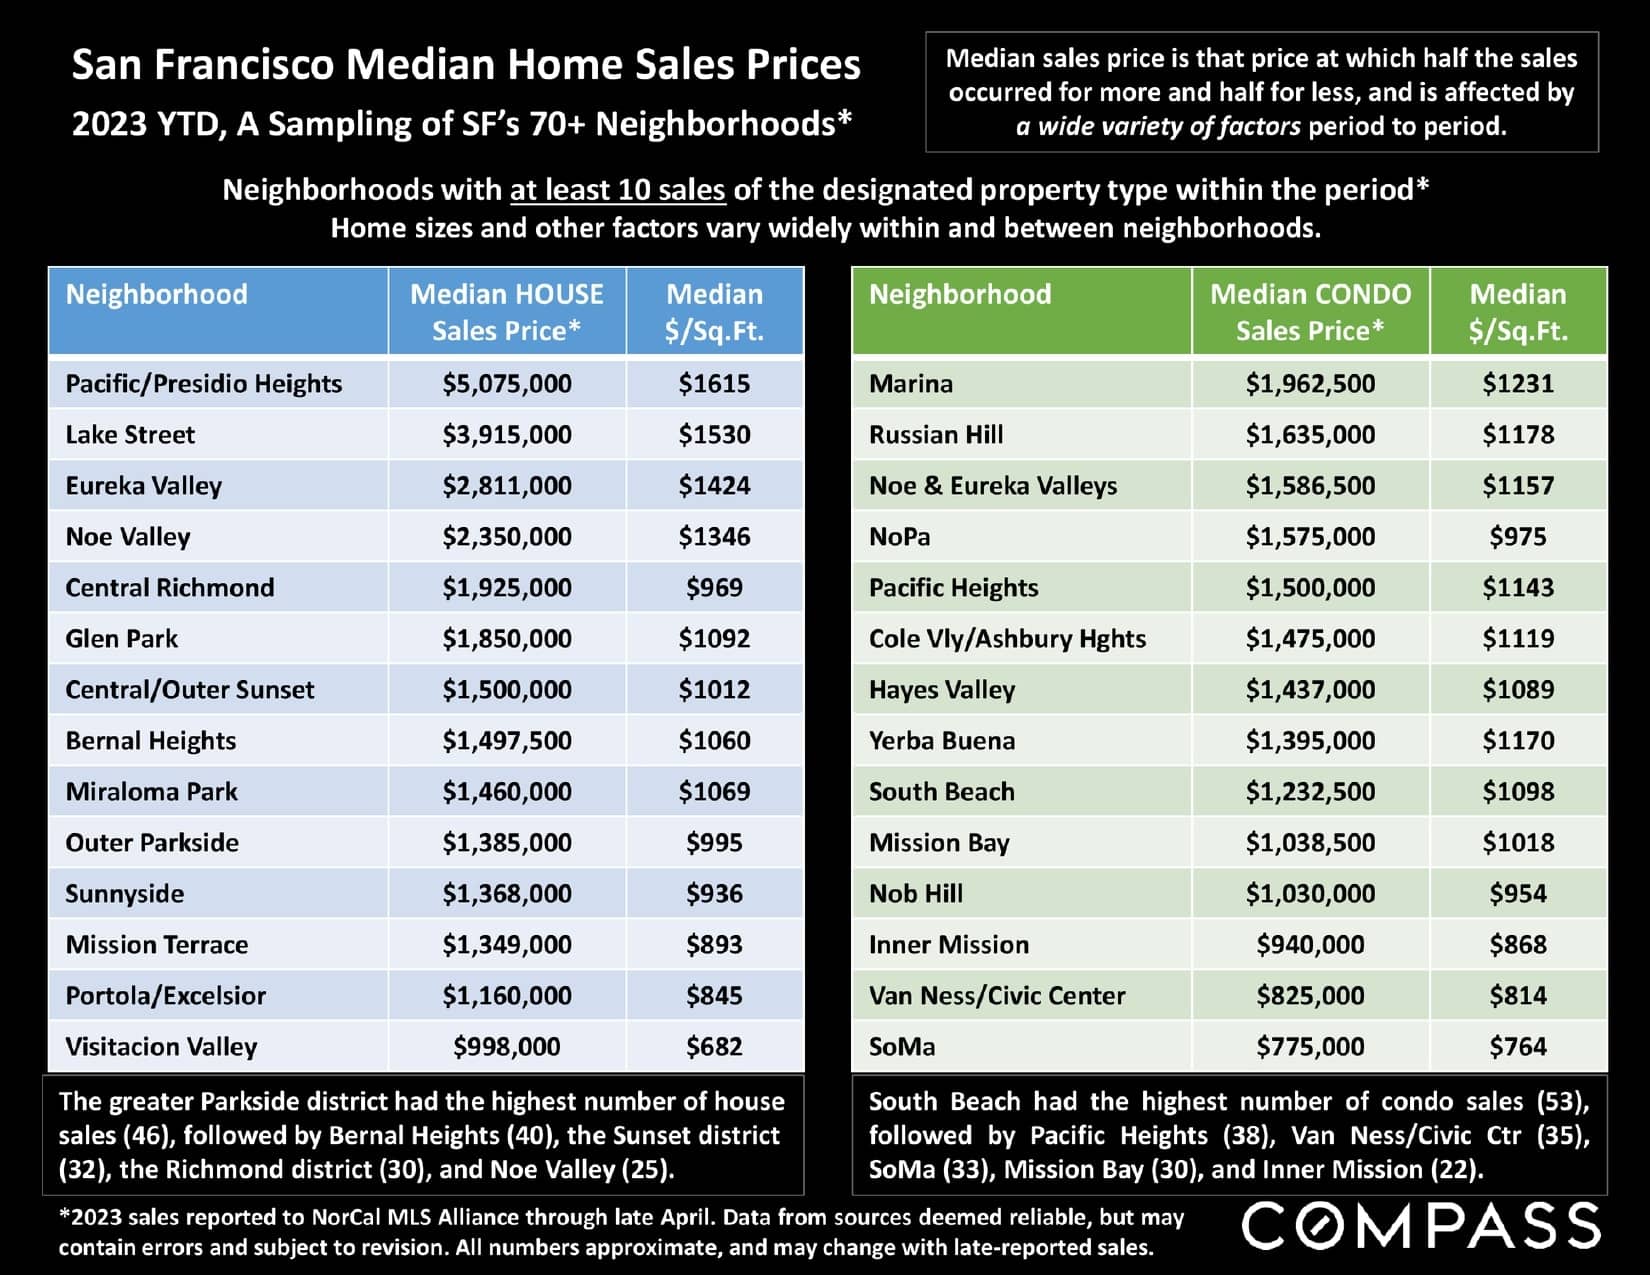
Infographic comparing 2023 year-to-date median house and condo prices across selected San Francisco neighborhoods.

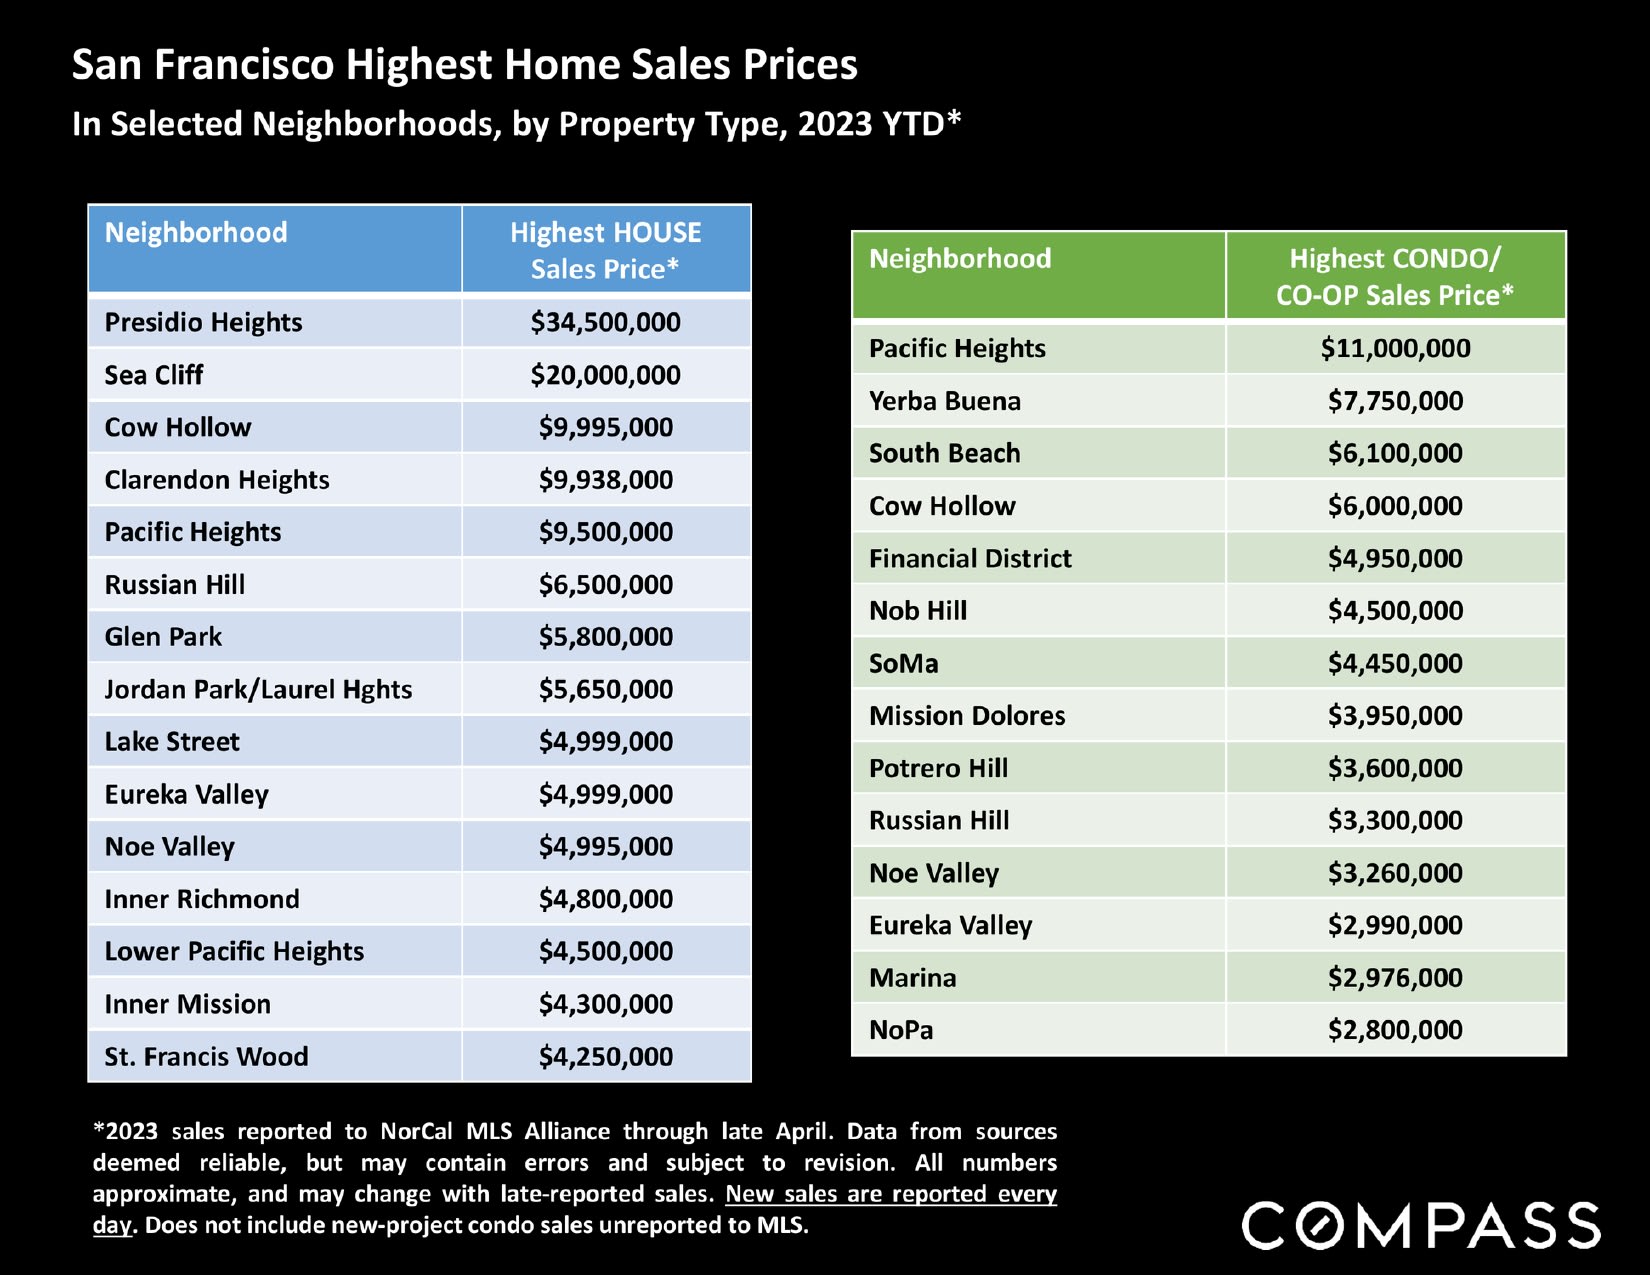
San Francisco neighborhood tables of highest 2023 year-to-date house and condo/co-op sale prices.

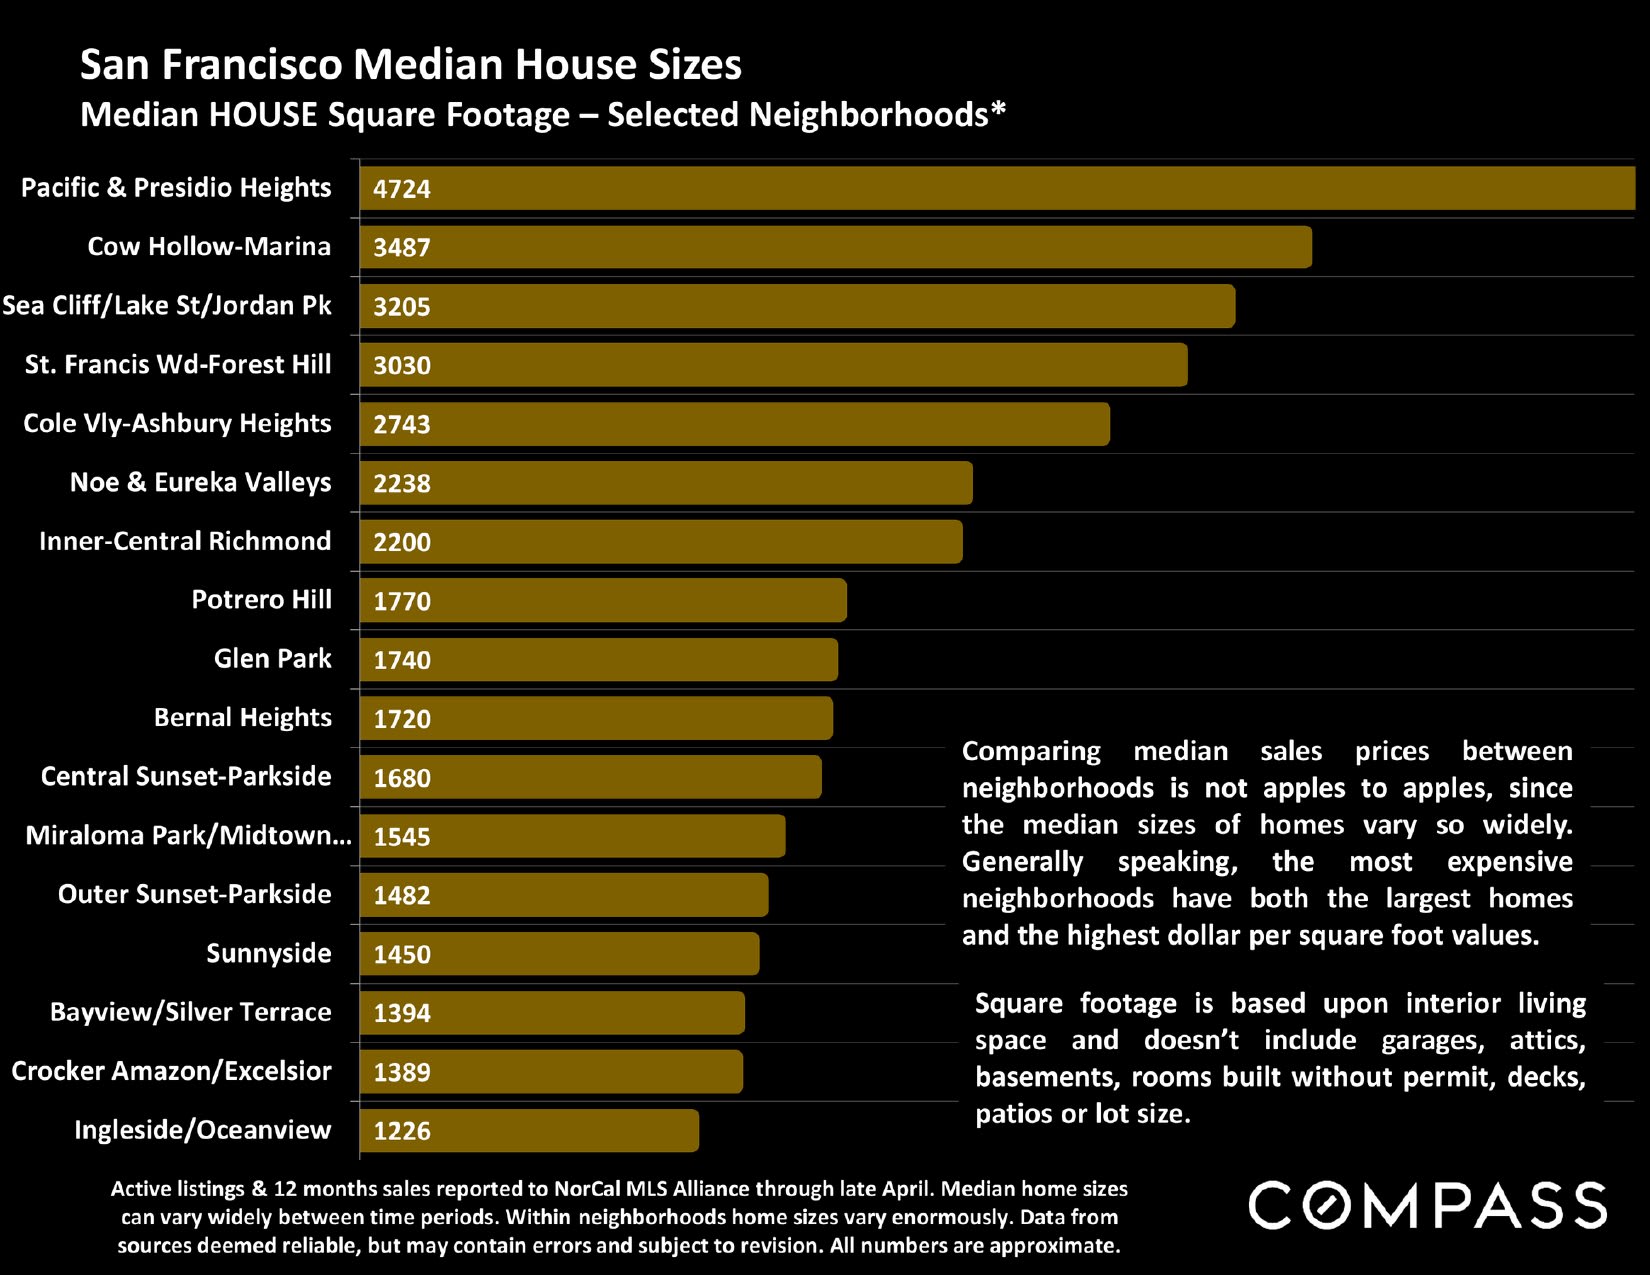
Chart comparing median house sizes across 17 San Francisco neighborhoods, led by Pacific & Presidio Heights at 4,724 square feet.

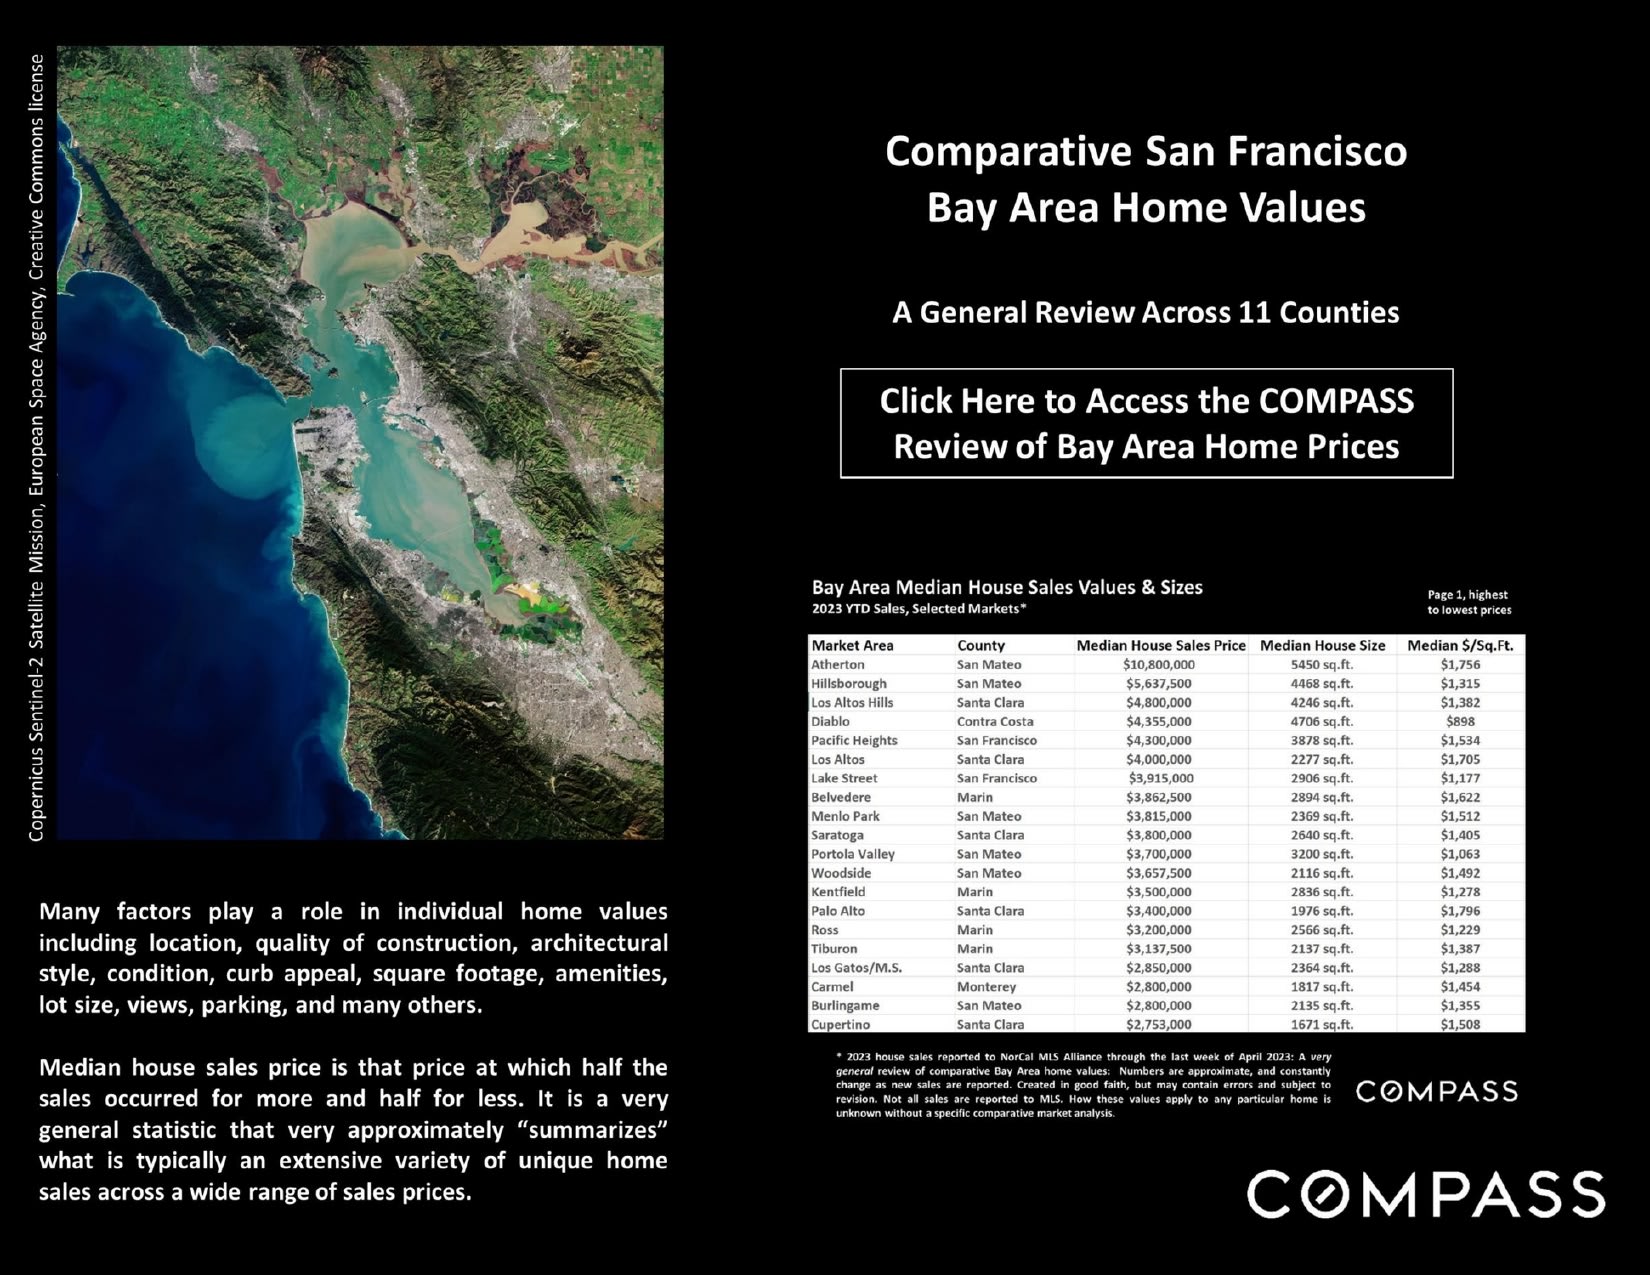
Infographic comparing San Francisco Bay Area home values, with a regional satellite map and median-price table.

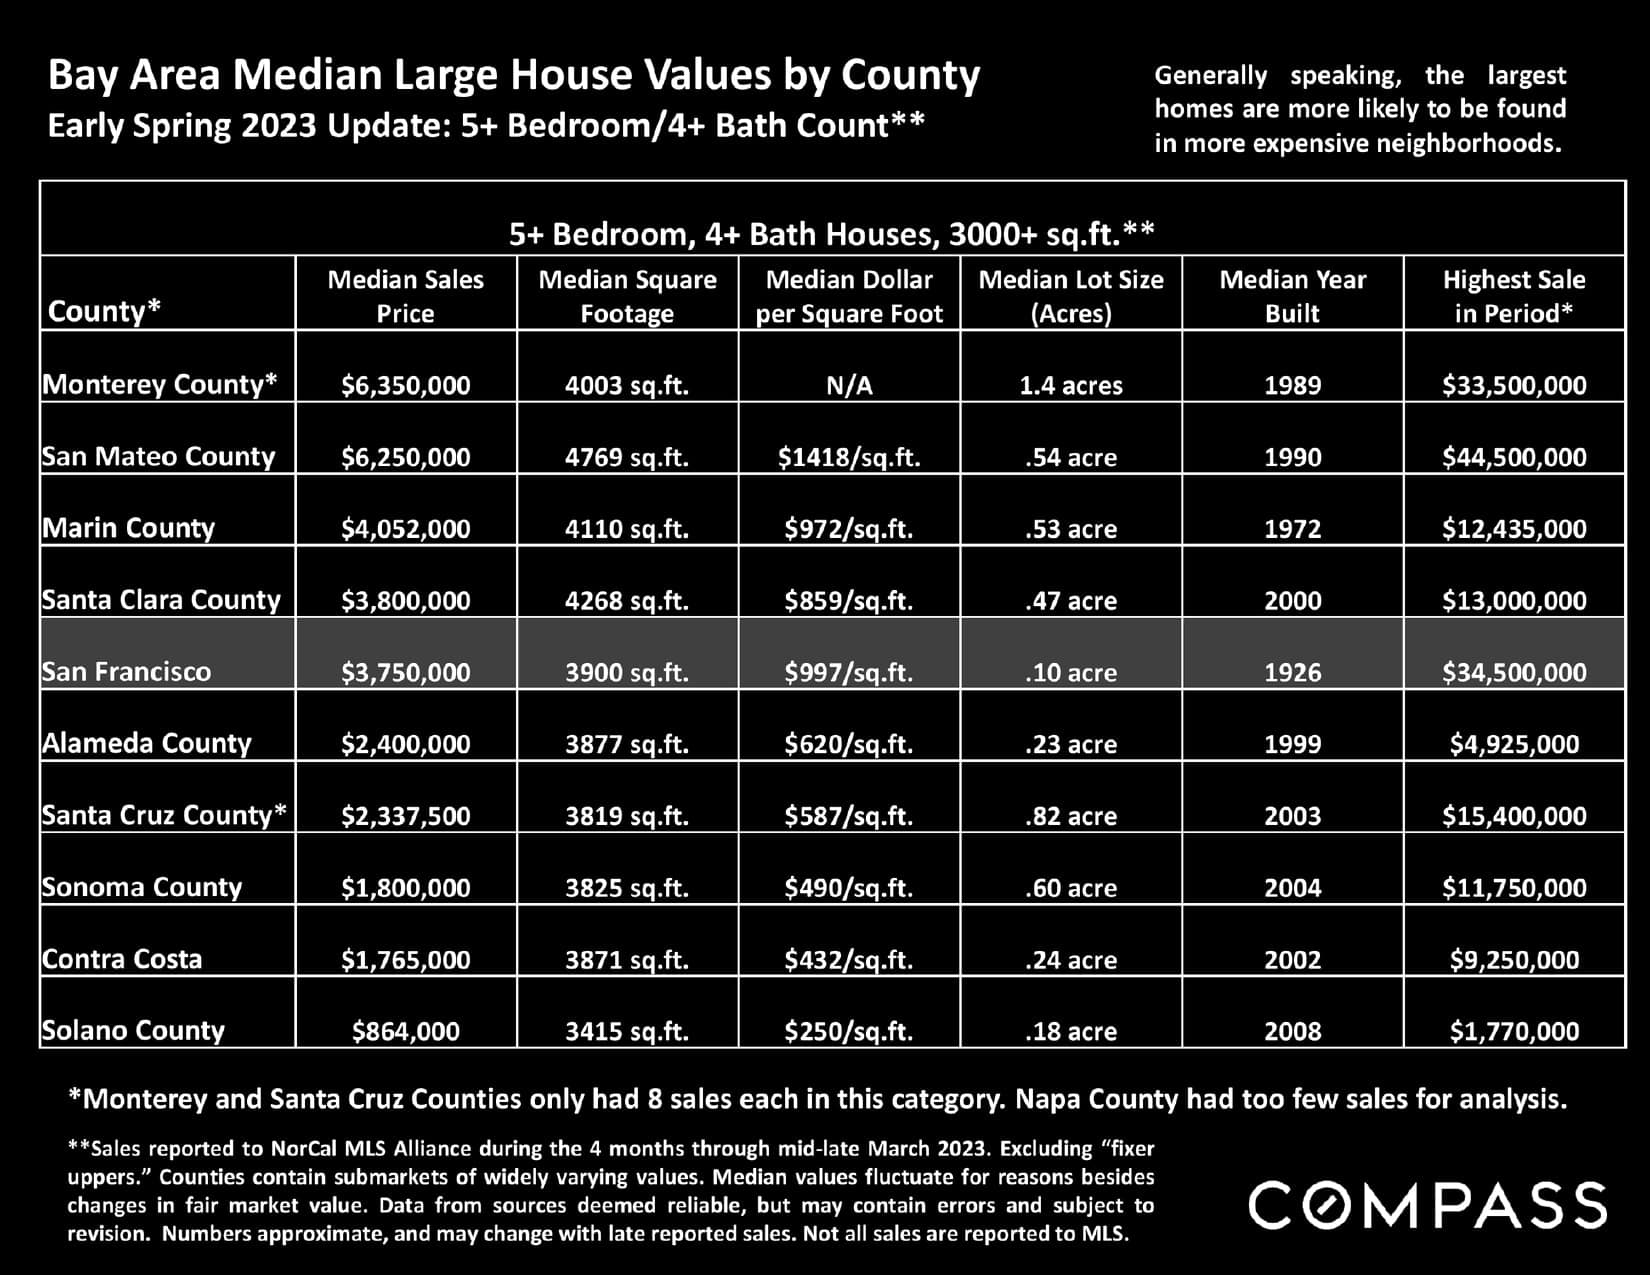
Bay Area median large-house values by county, early spring 2023, with San Francisco highlighted.

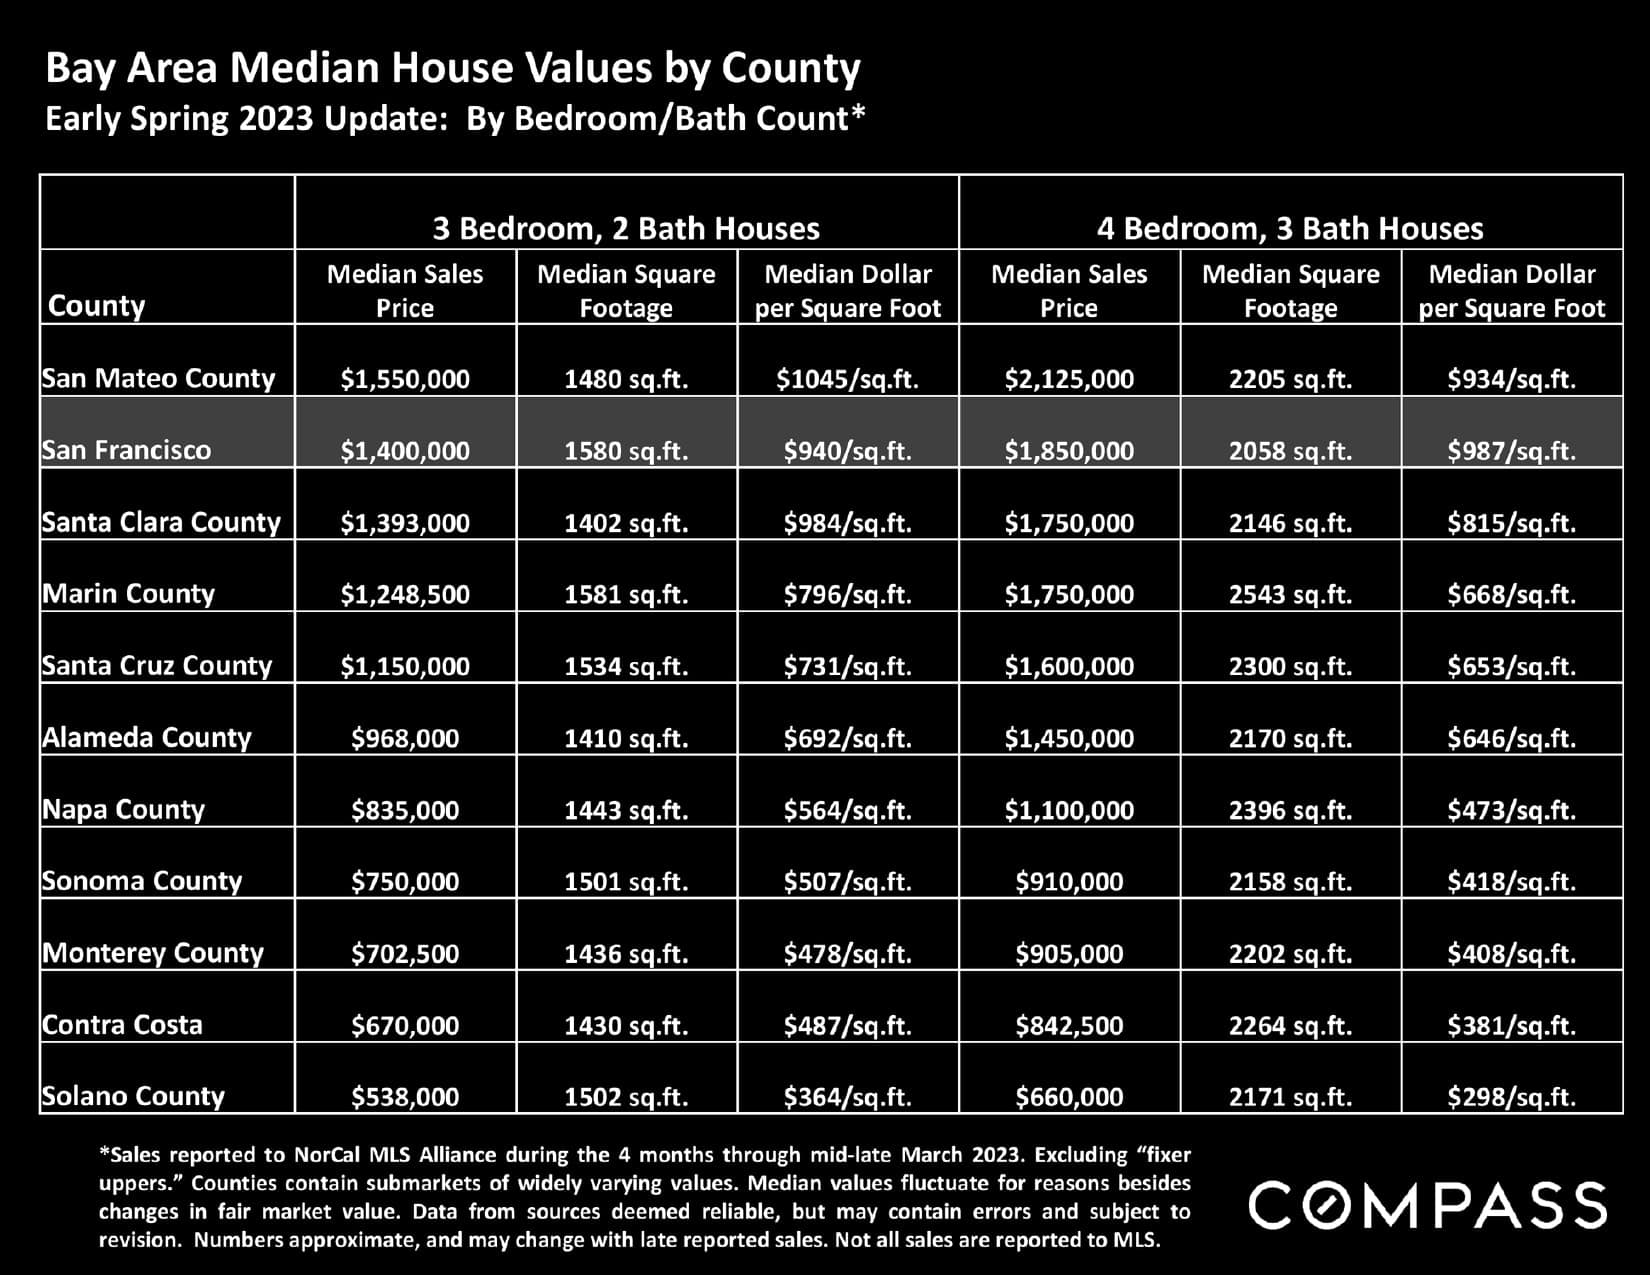
Bay Area county home-value comparison for two house sizes, with San Francisco highlighted.

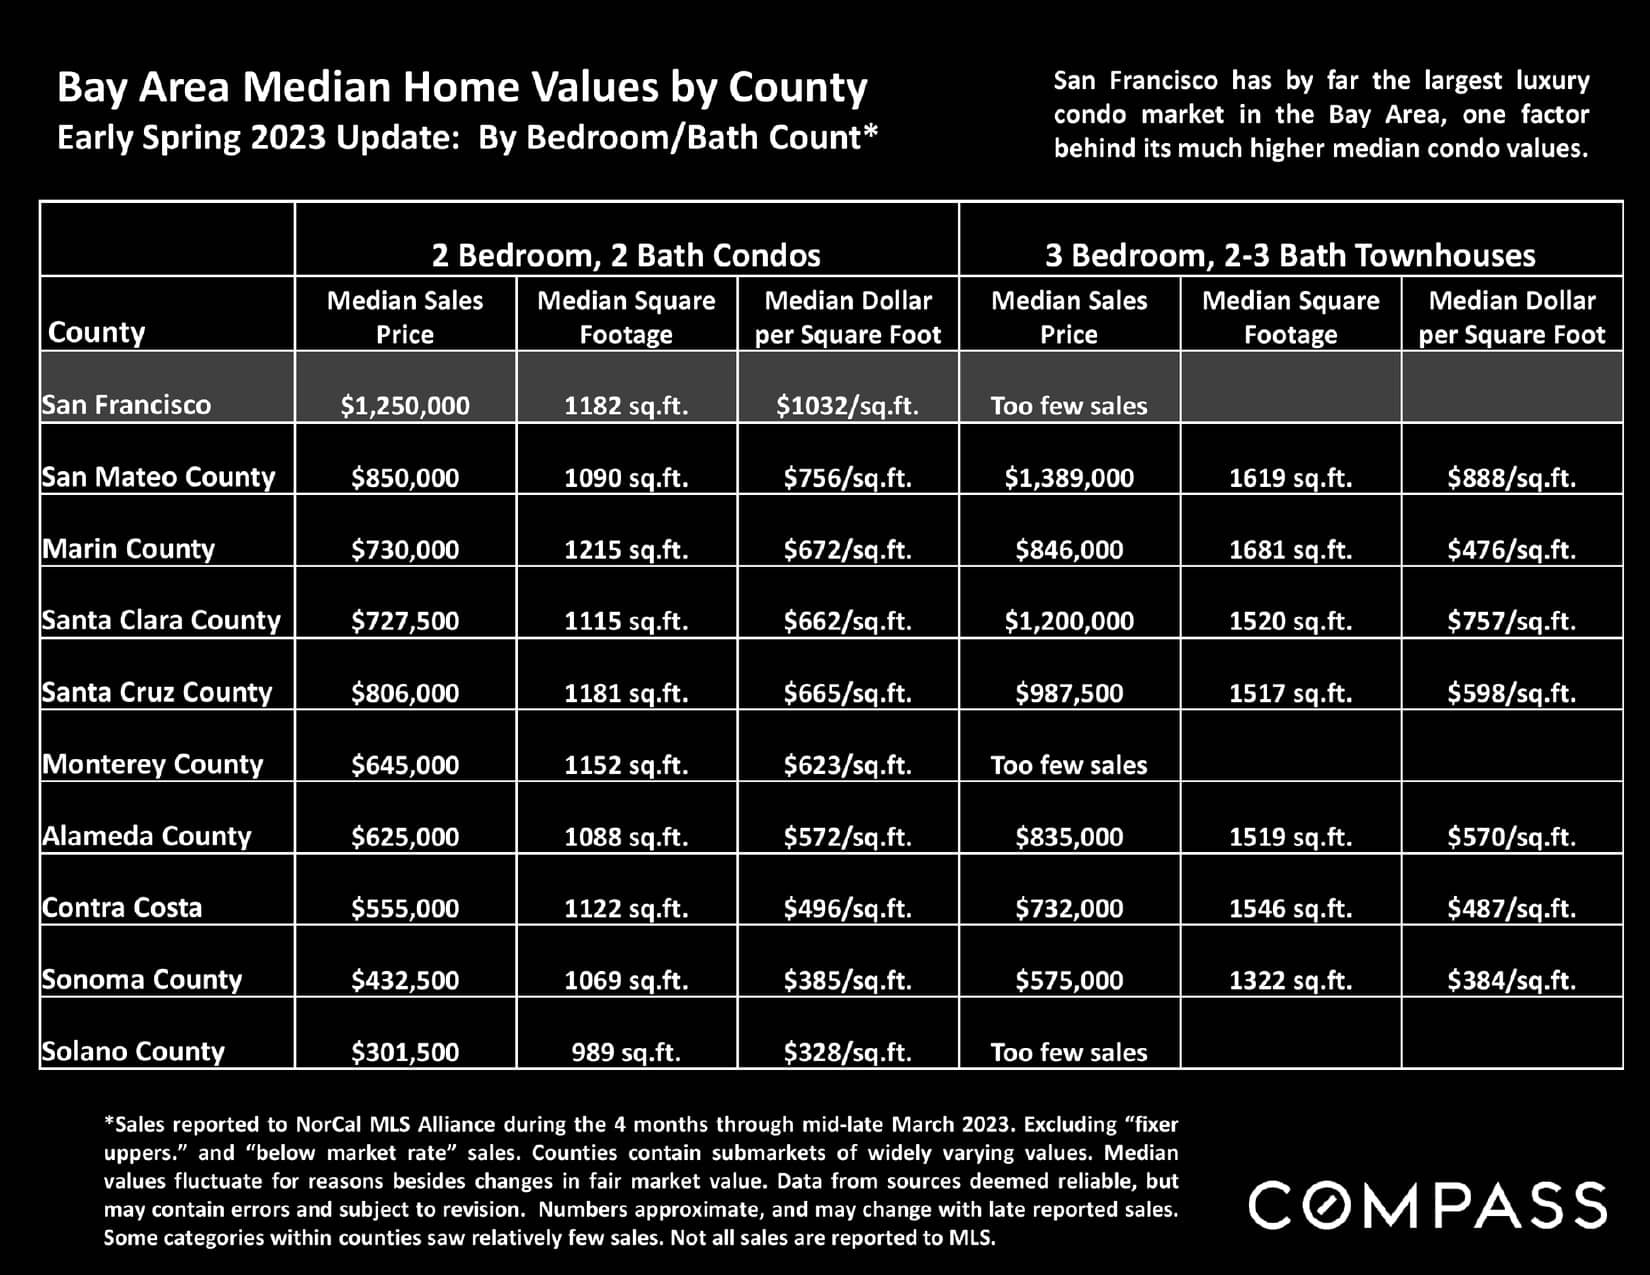
Bay Area median home values infographic comparing condo and townhouse prices across counties.

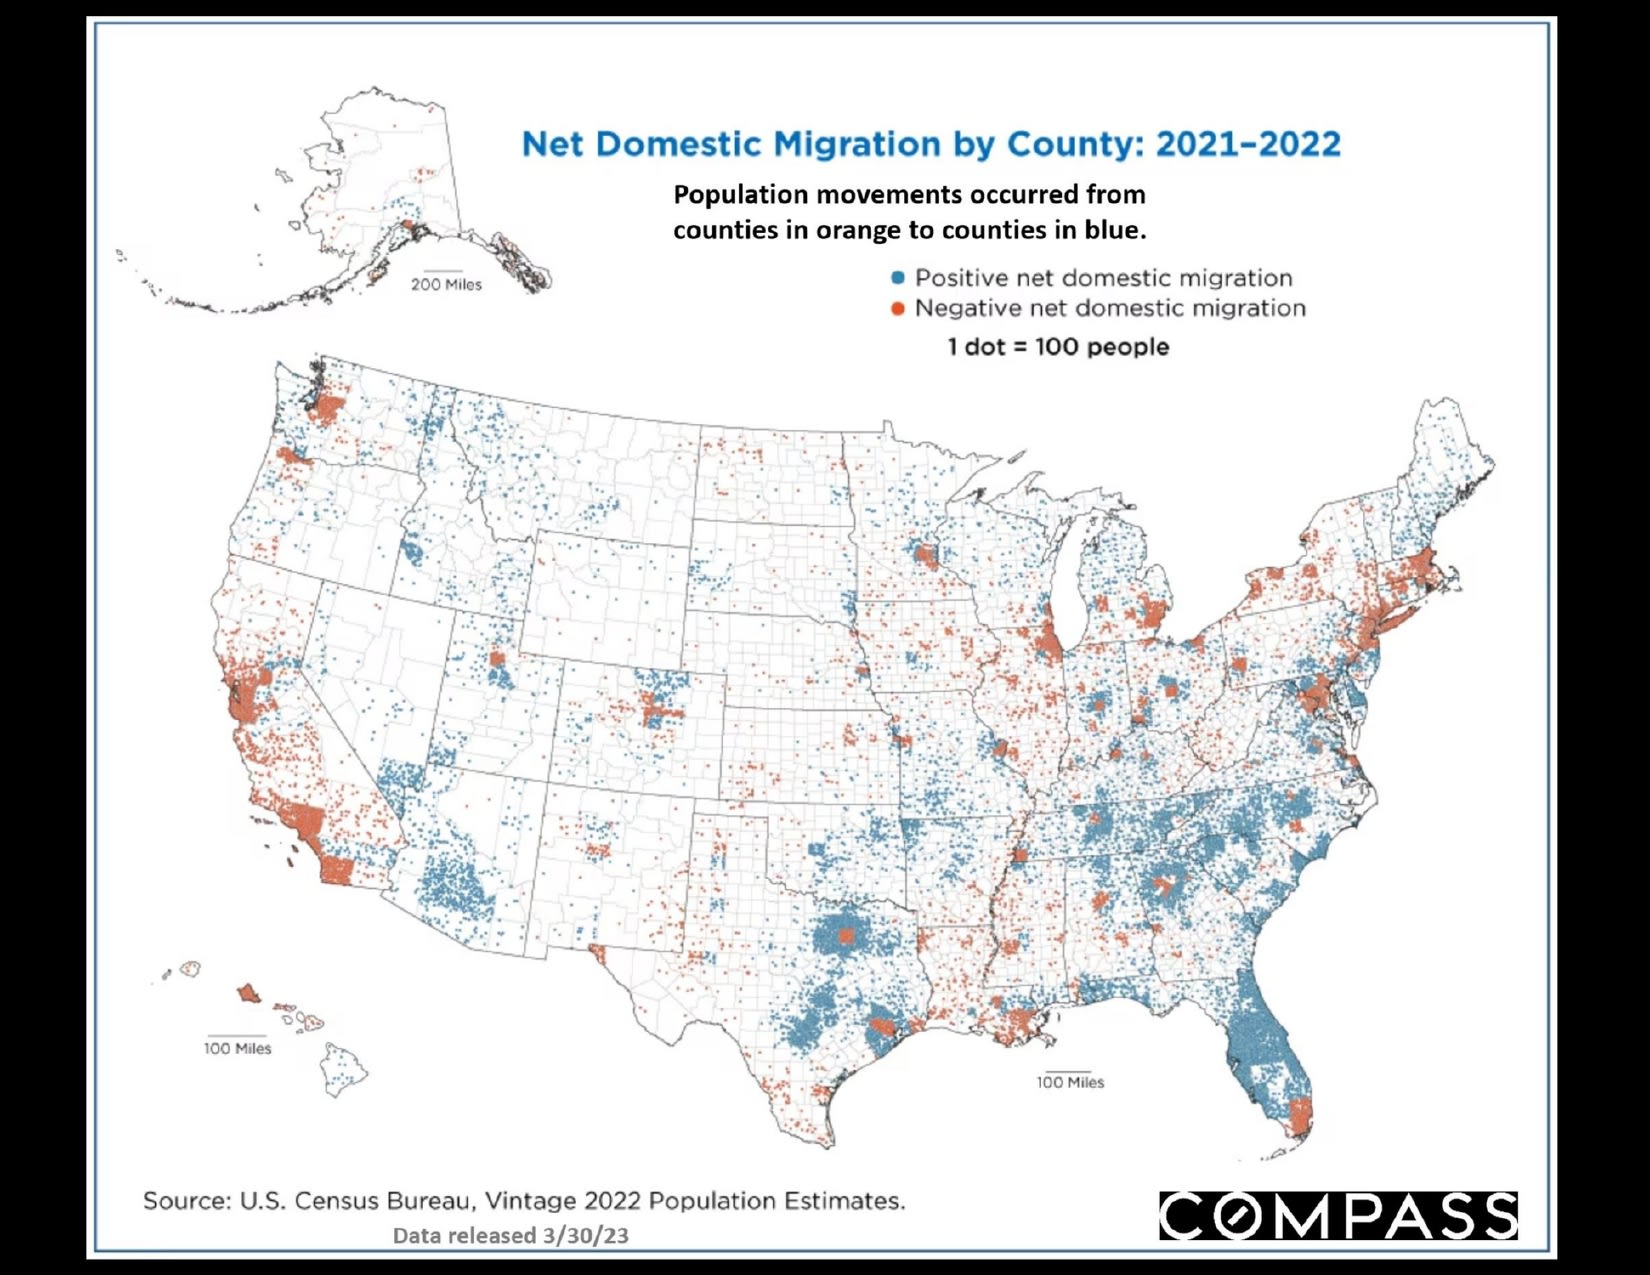
Map of U.S. county migration in 2021–2022, with positive migration in blue and negative migration in orange.

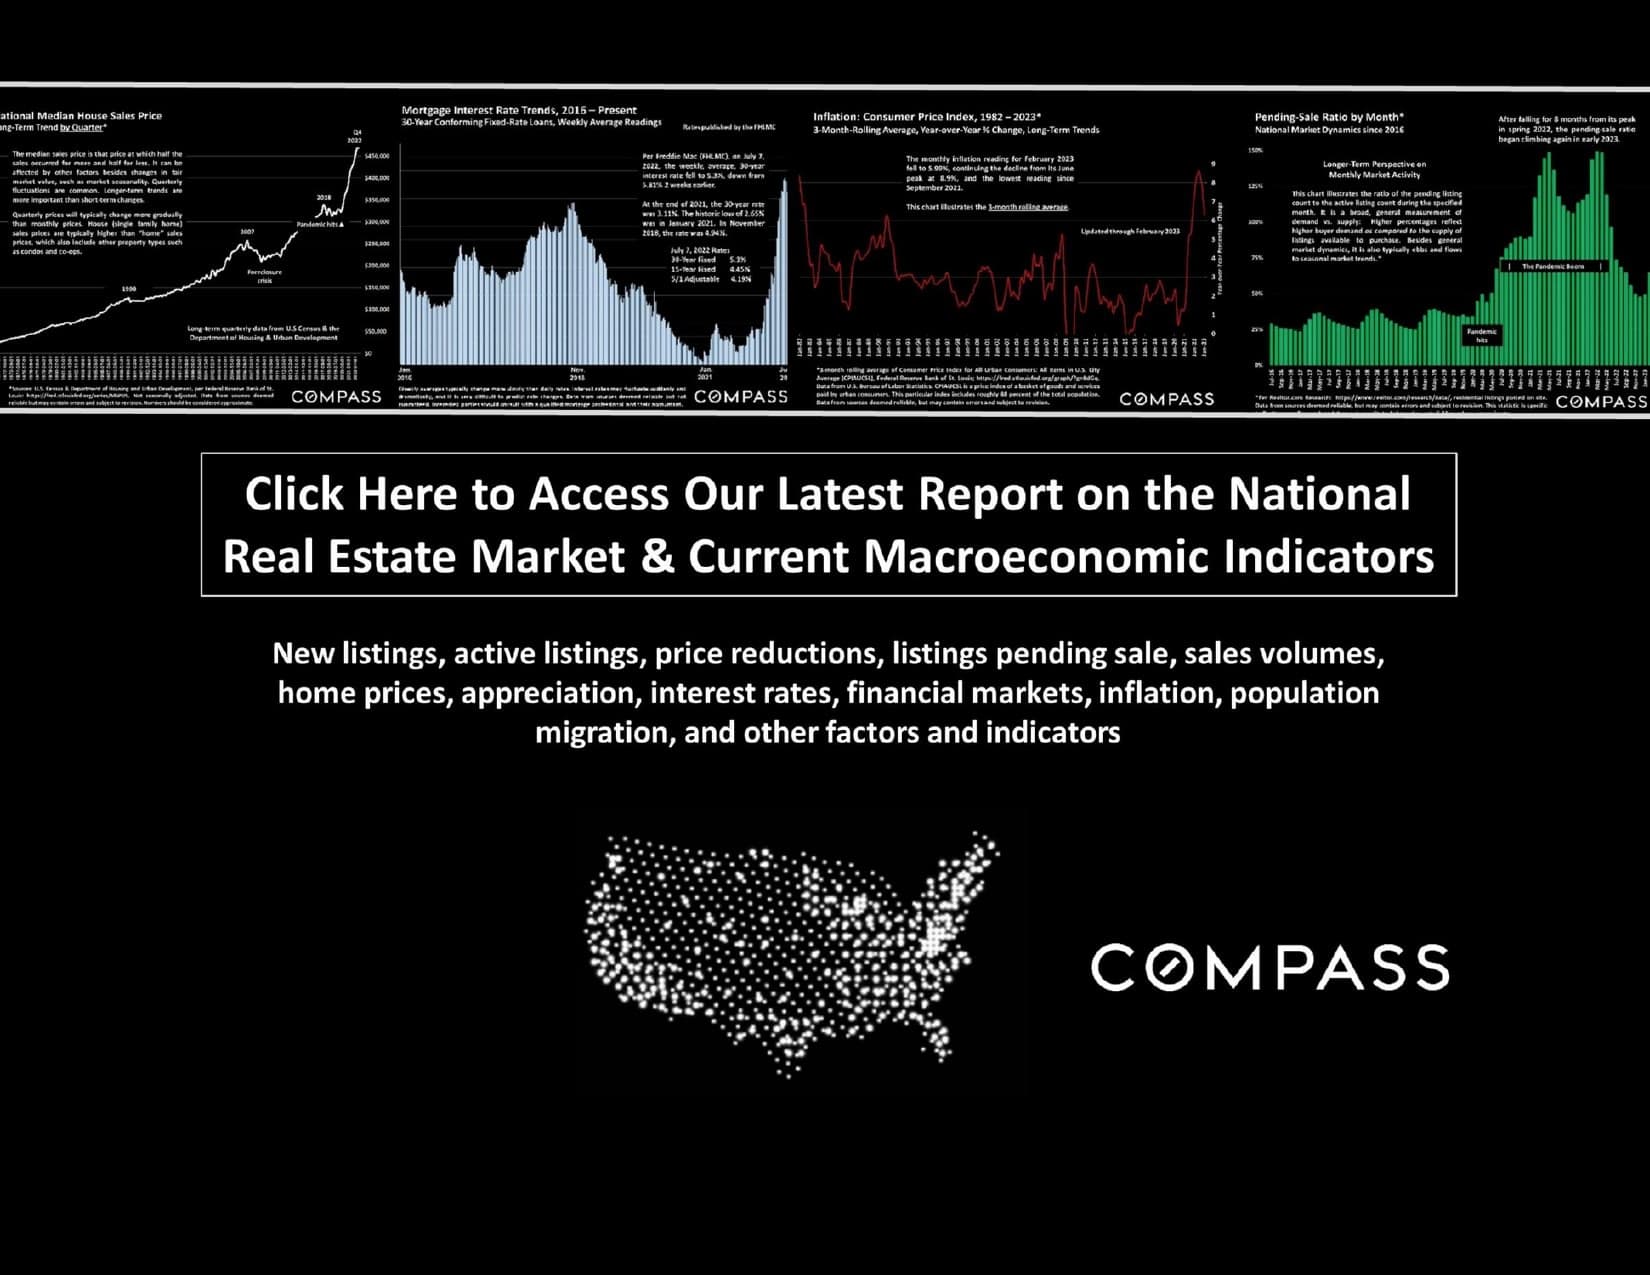
Compass report graphic with national housing market and economic charts and a dotted U.S. map.

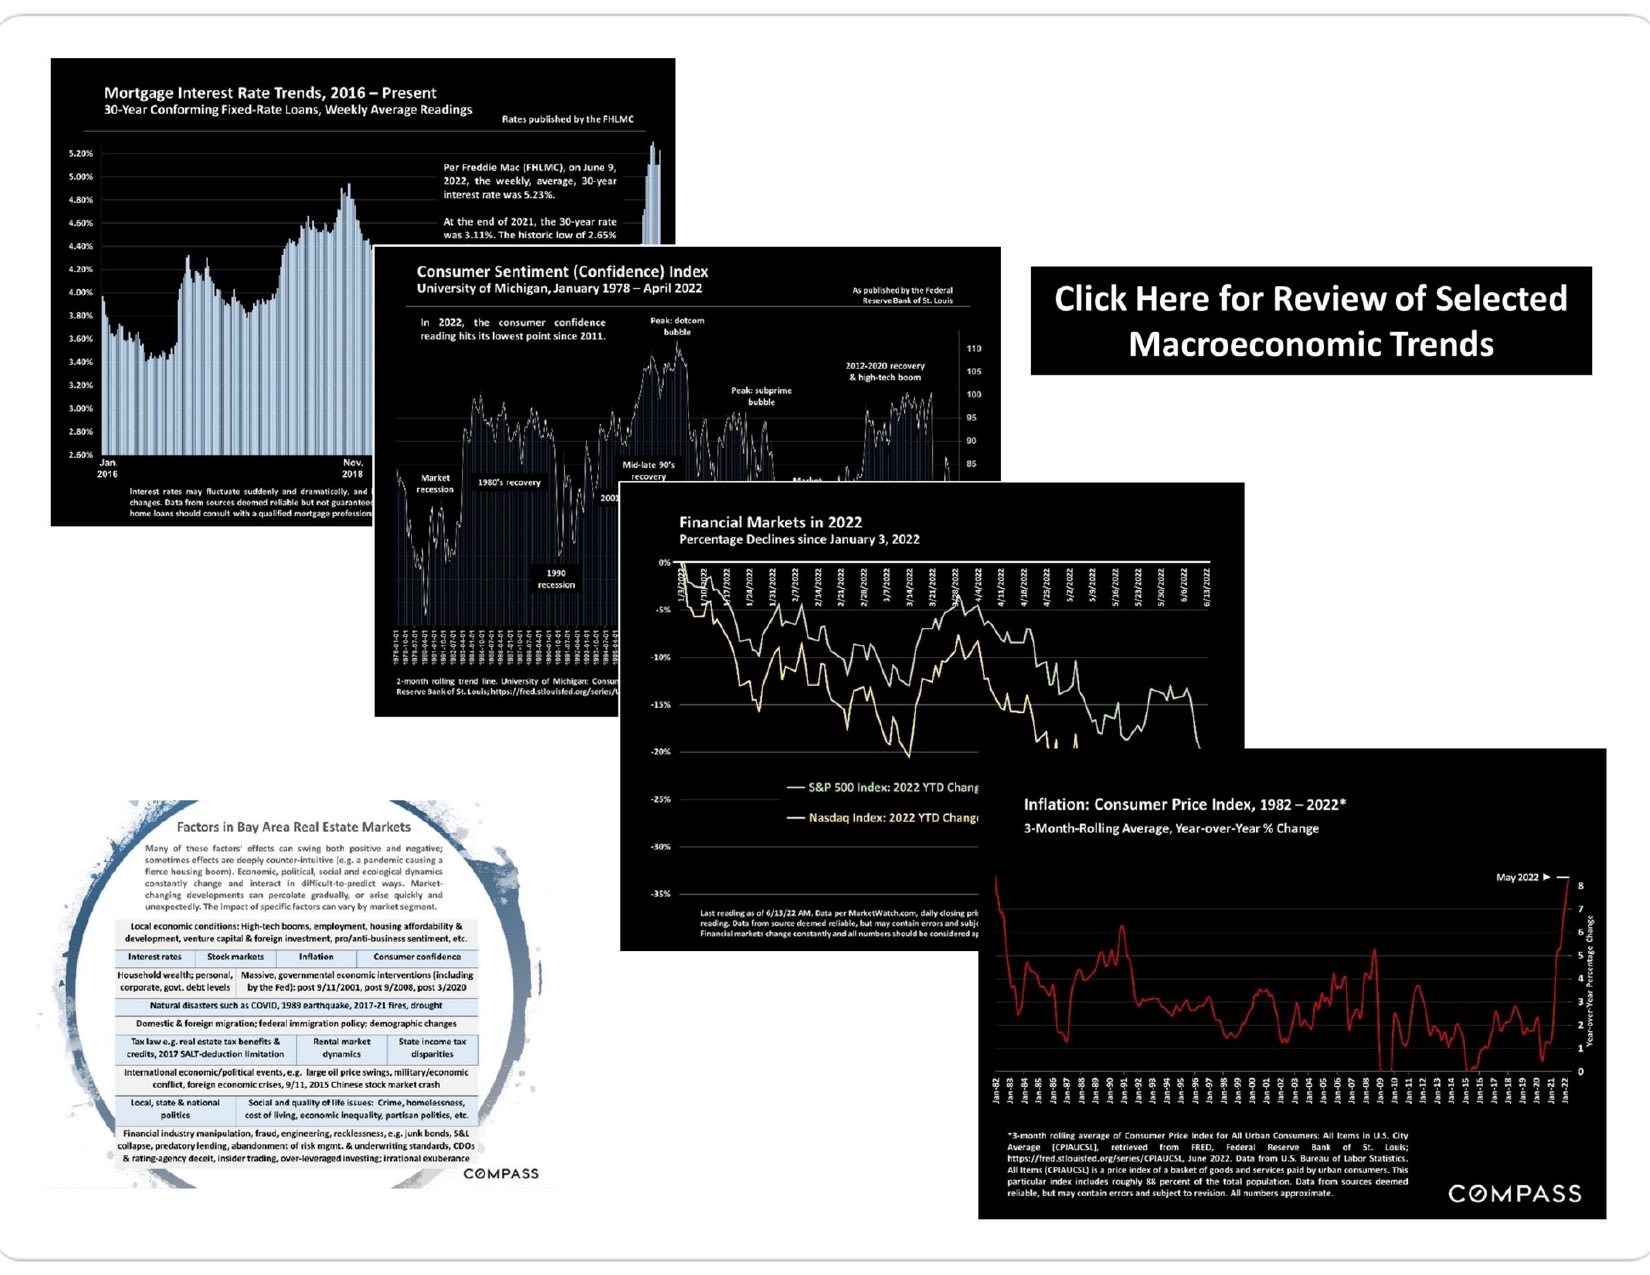
Economic charts on mortgage rates, consumer sentiment, financial markets, inflation, and factors affecting Bay Area real estate.

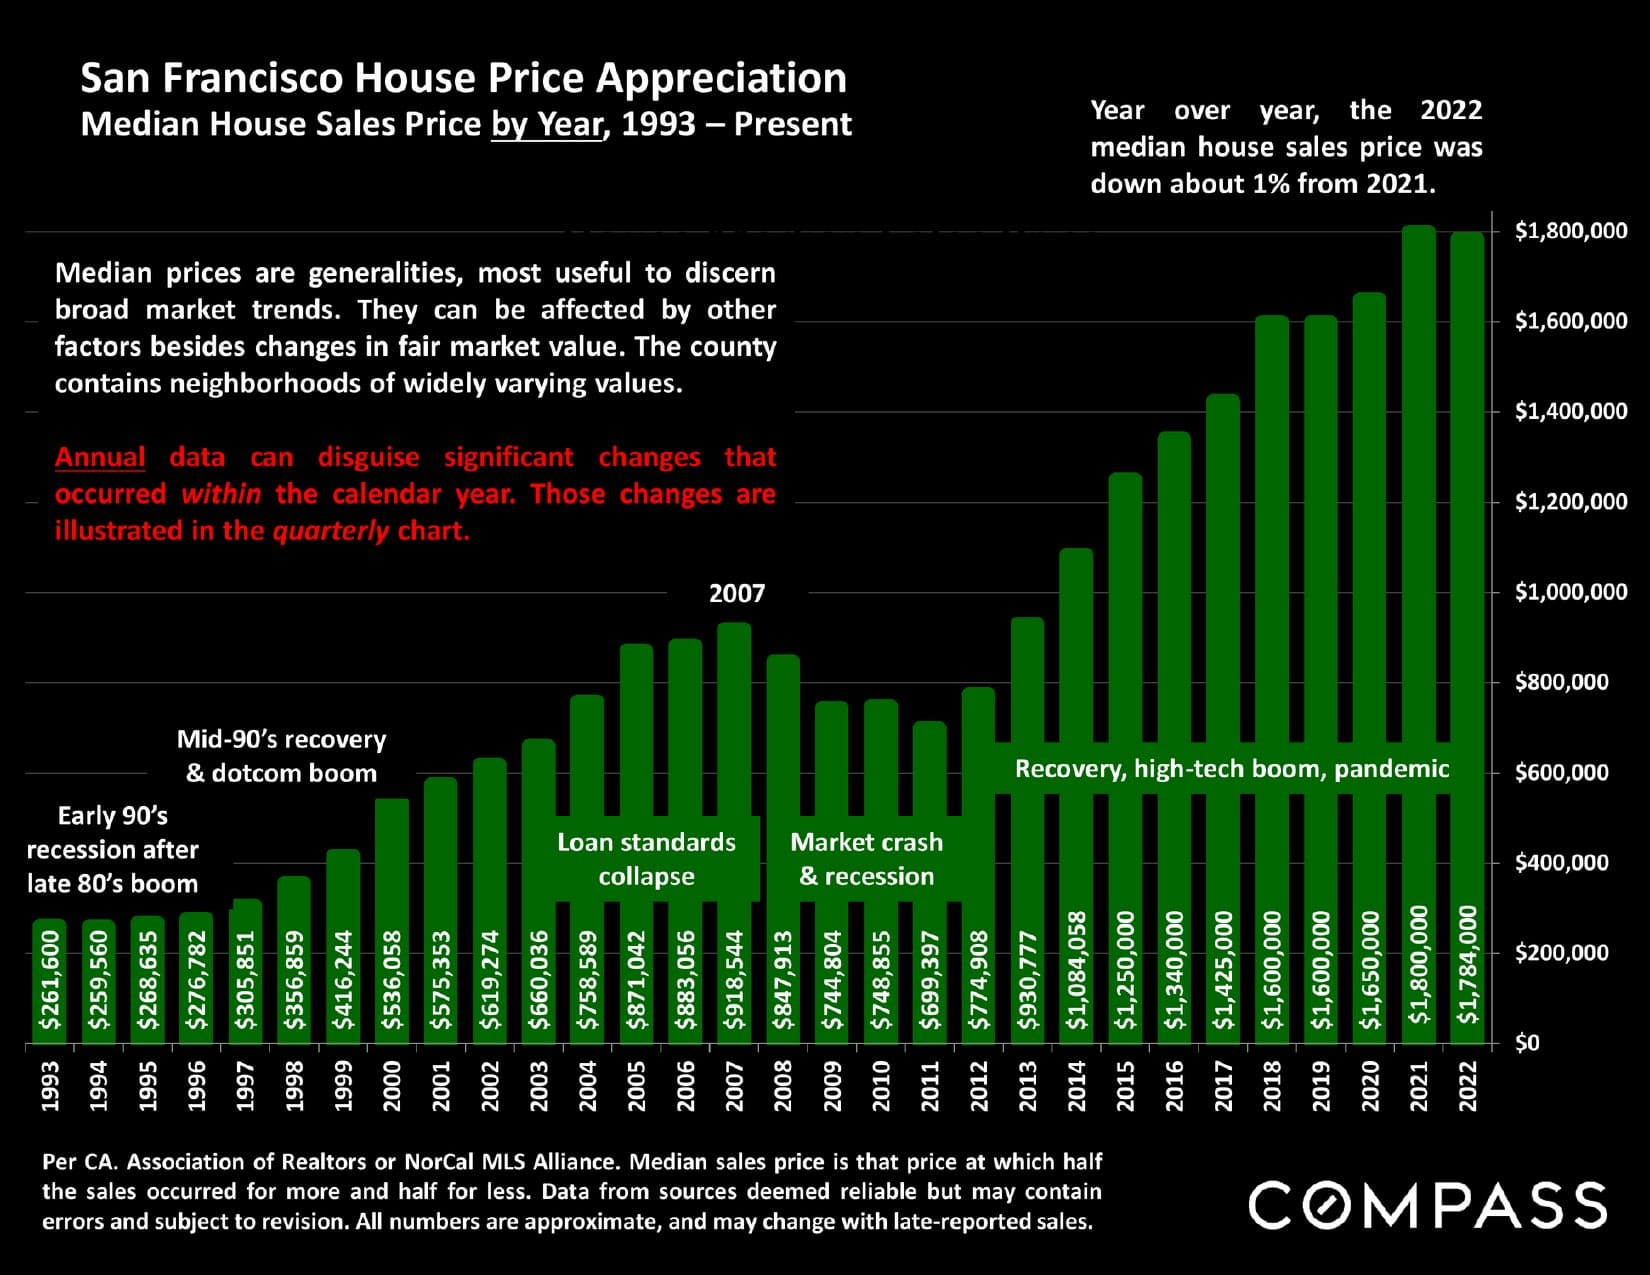
Chart of San Francisco median house sale prices, rising from $261,600 in 1993 to $1.784 million in 2022.

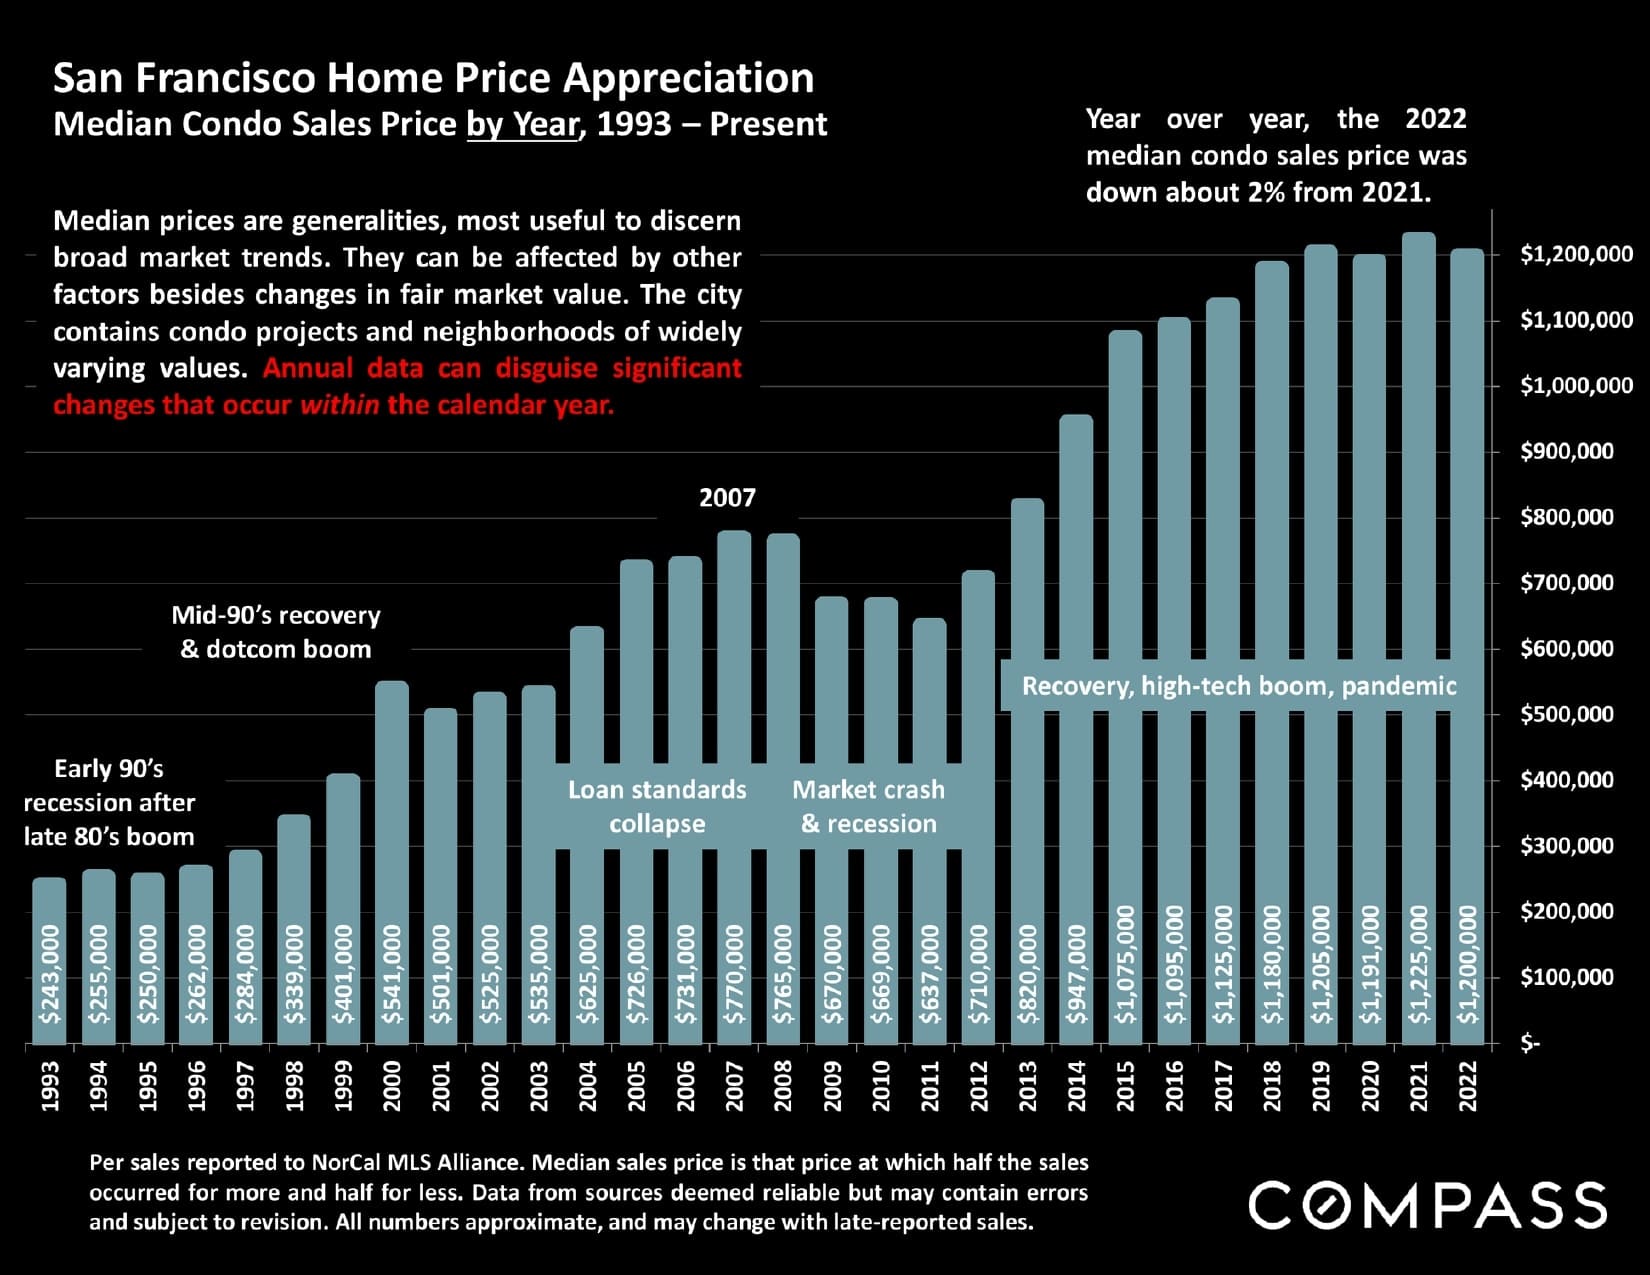
Chart of San Francisco median condo sale prices, 1993–2022, showing long-term growth and a 2% decline in 2022.

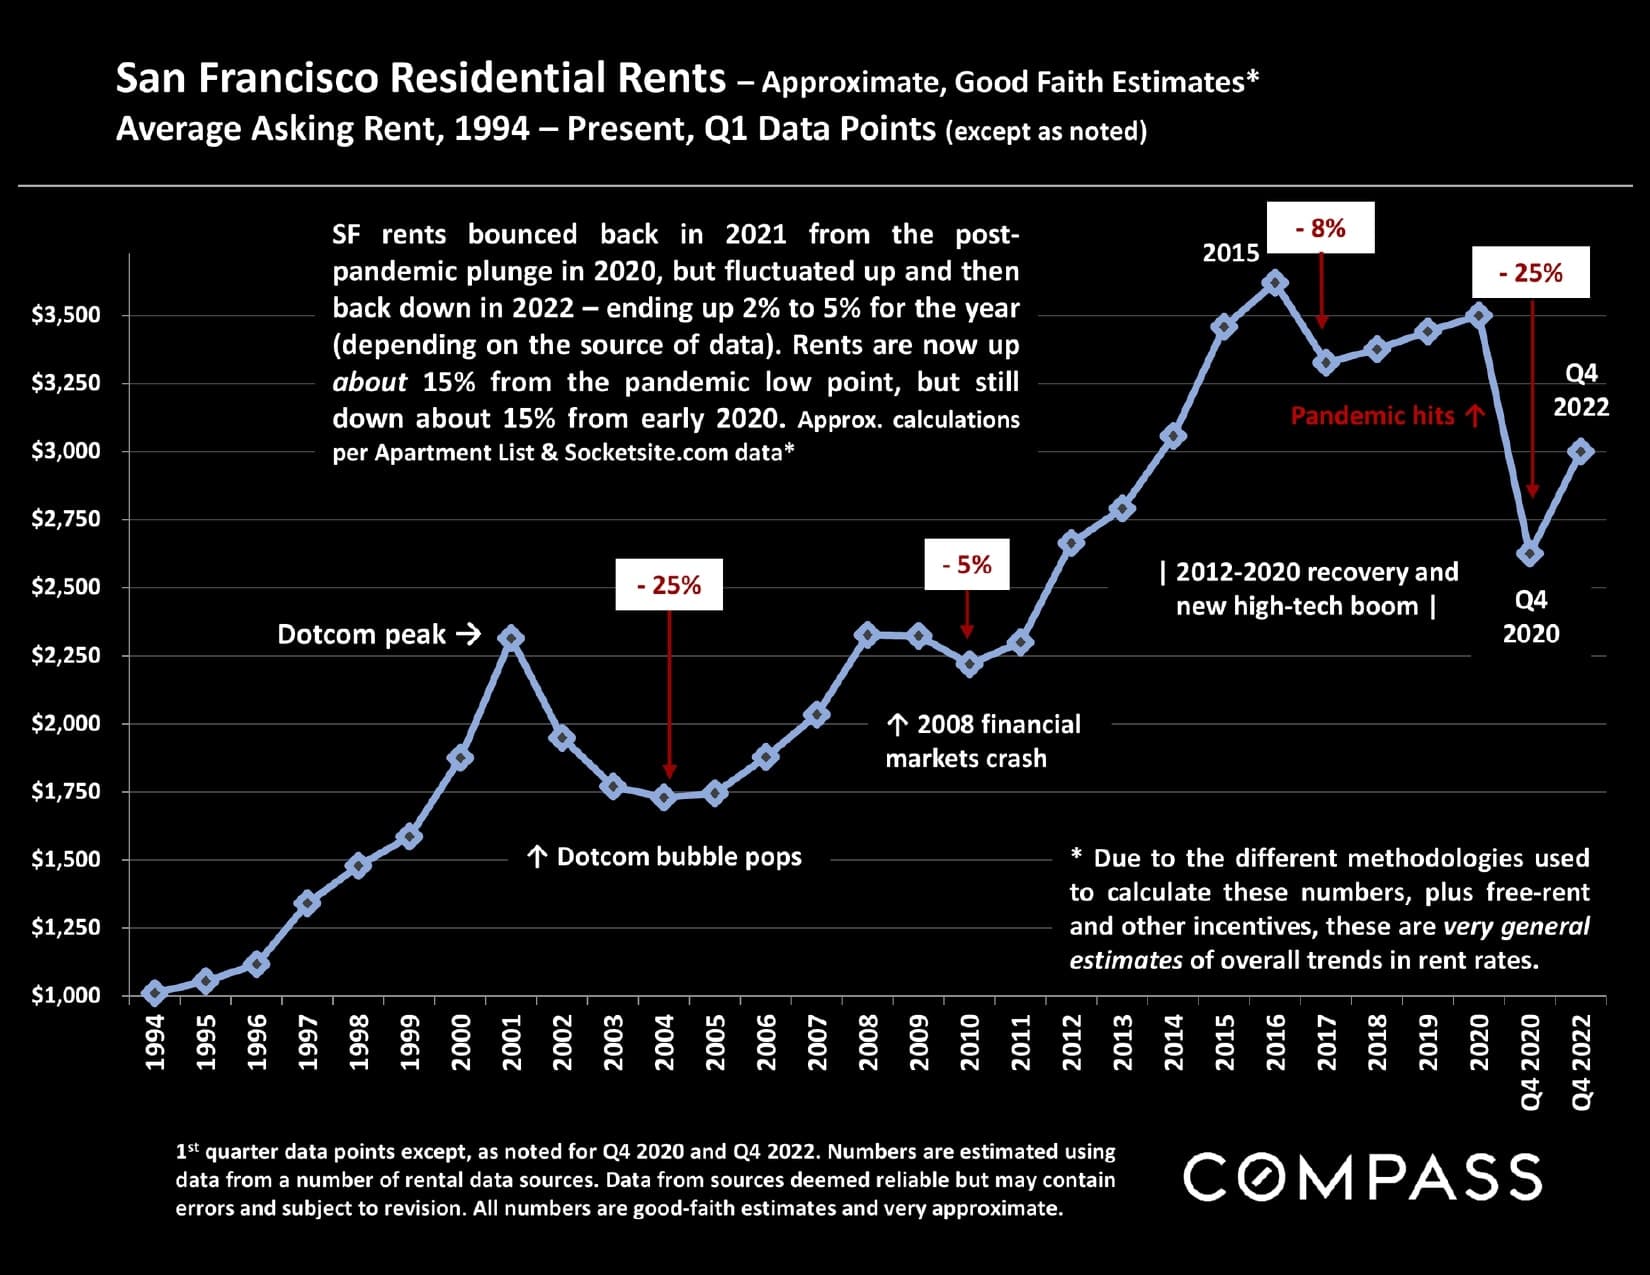
Chart of estimated San Francisco residential rents, 1994–2022, showing the pandemic decline and partial recovery.

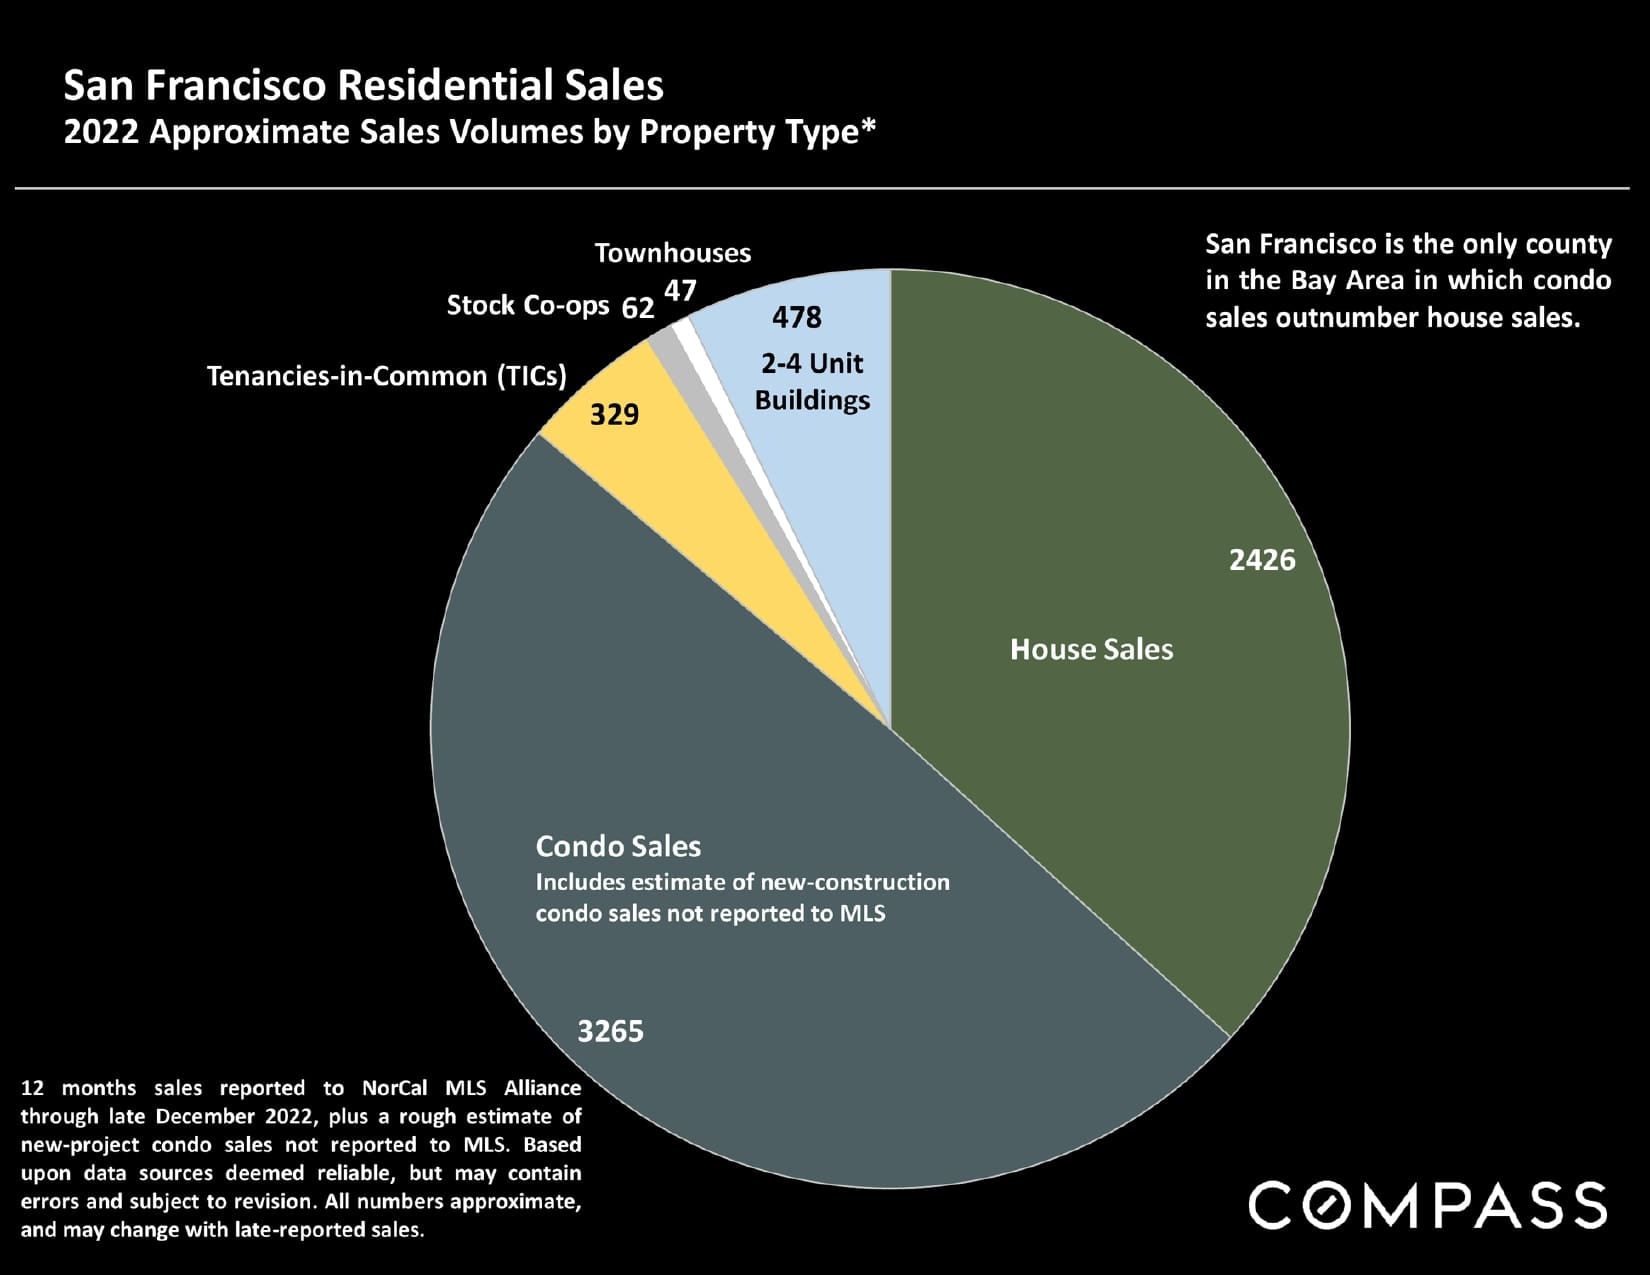
San Francisco 2022 residential sales pie chart comparing sales volumes by property type.

Compass report graphic on San Francisco Bay Area home price appreciation trends since 1990, with regional landscape photos.

Real estate market report notes defining statistics, median sales price, and dollar per square foot, followed by Compass disclosures.

Work With Jason

Drawing on his decade of experience in finance, investment management, and holistic financial planning, and as a Chartered Financial Analyst ( CFA ® ) charterholder, he leverages his financial acumen and analytical focus to help his clients navigate the sophisticated San Francisco market.
Contact
Follow Us