San Francisco Real Estate Market Update | July 2023

A review of house and condo prices, appreciation rates, supply and demand, overbidding, time and market, luxury home sales and macroeconomic factors pertinent to the San Francisco real estate market.

San Francisco Real Estate, July 2023 Report
Market update discussing 2023 economic conditions, seller advantage, and seasonal real estate activity in the Bay Area.
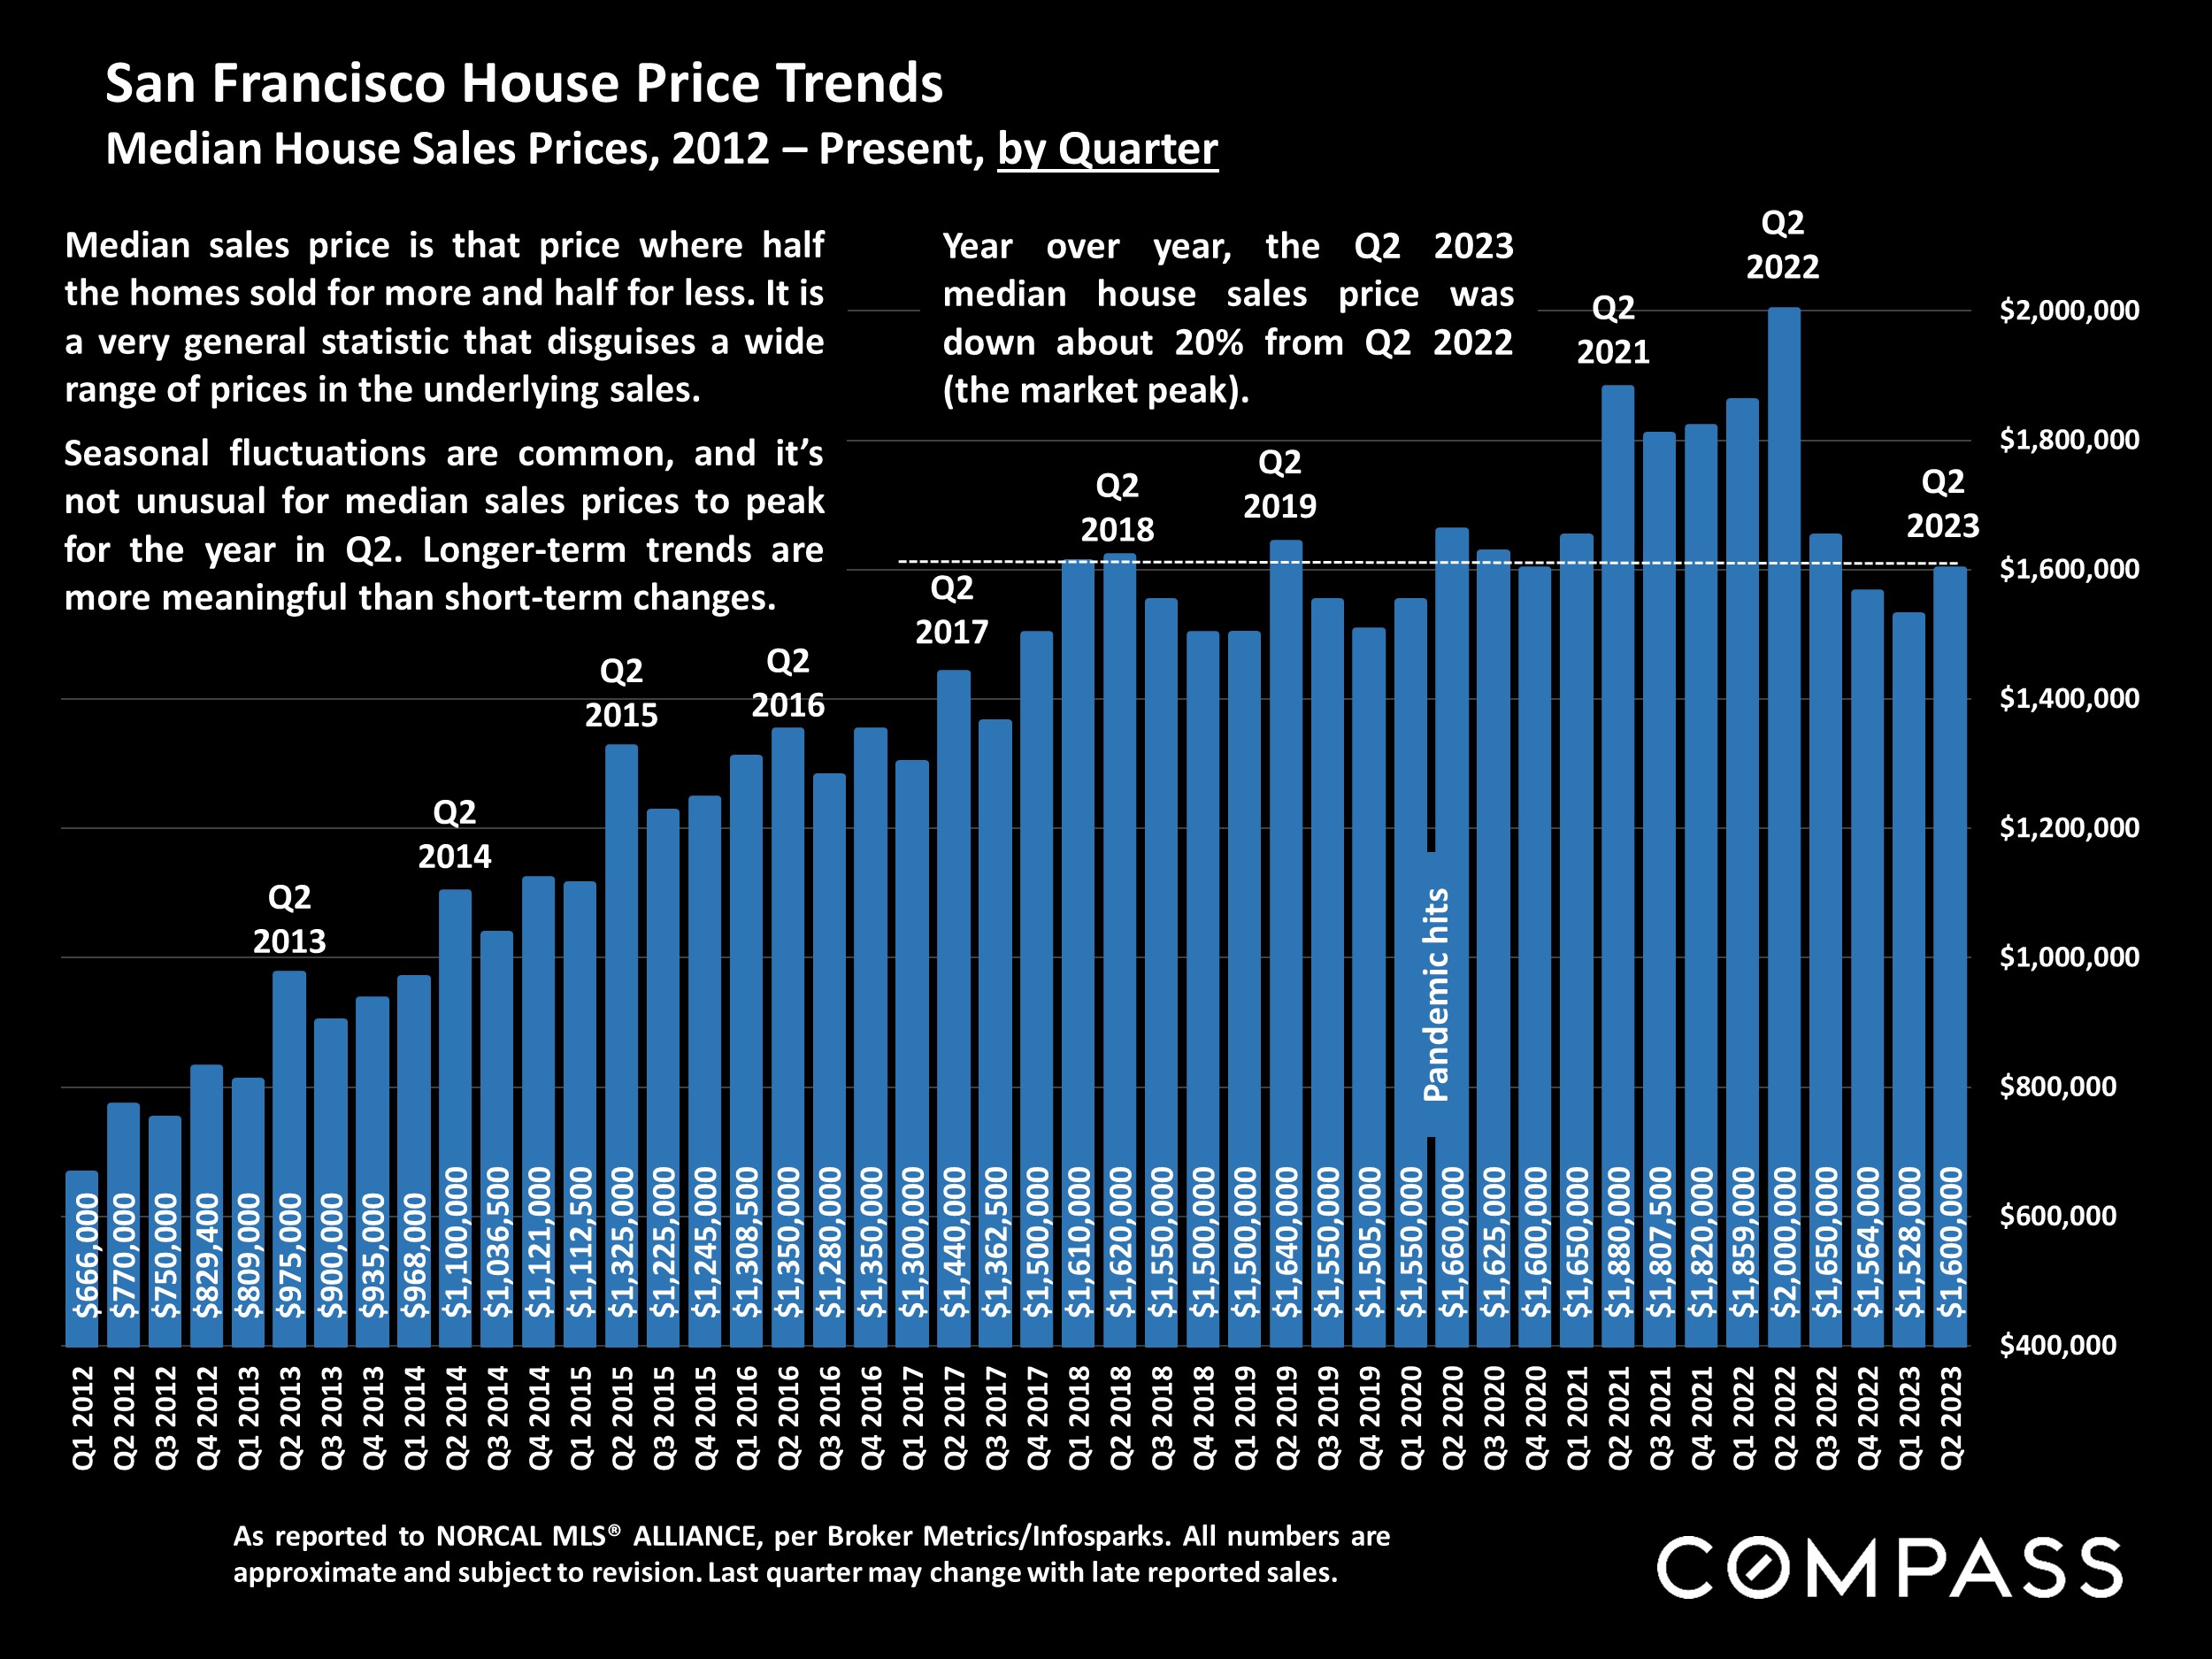
San Francisco quarterly median house sale prices, peaking at $2 million in Q2 2022 before falling to $1.6 million in Q2 2023.
San Francisco condo price chart shows quarterly median sales prices from 2012 to Q2 2023, peaking in 2022.
Chart of San Francisco house and condo values per square foot from 2005 to June 2023.
San Francisco spring 2023 housing market table comparing sales, inventory, and pricing by segment and property type.
San Francisco house price chart comparing quarterly median sale prices across four district groups, Q2 2020 to Q2 2023.
Chart of quarterly median house prices in four San Francisco district groups, Q2 2020 through Q2 2023.
Chart comparing quarterly median San Francisco condo prices across three district groups, from Q2 2020 to Q2 2023.
Chart of San Francisco condo price trends by quarter from Q2 2020 to Q2 2023 across three district groups.
Chart of San Francisco luxury home sales by district and price range over 12 months.
Chart of 12-month San Francisco luxury condo, co-op, and TIC sales by district and price segment.
Line chart compares San Francisco house and condo days on market from January 2019 to June 2023.
Chart of San Francisco house and condo sale prices relative to original list prices, January 2019–June 2023.
San Francisco housing infographic with statistics on unit types, bedrooms, construction eras, and household sizes.
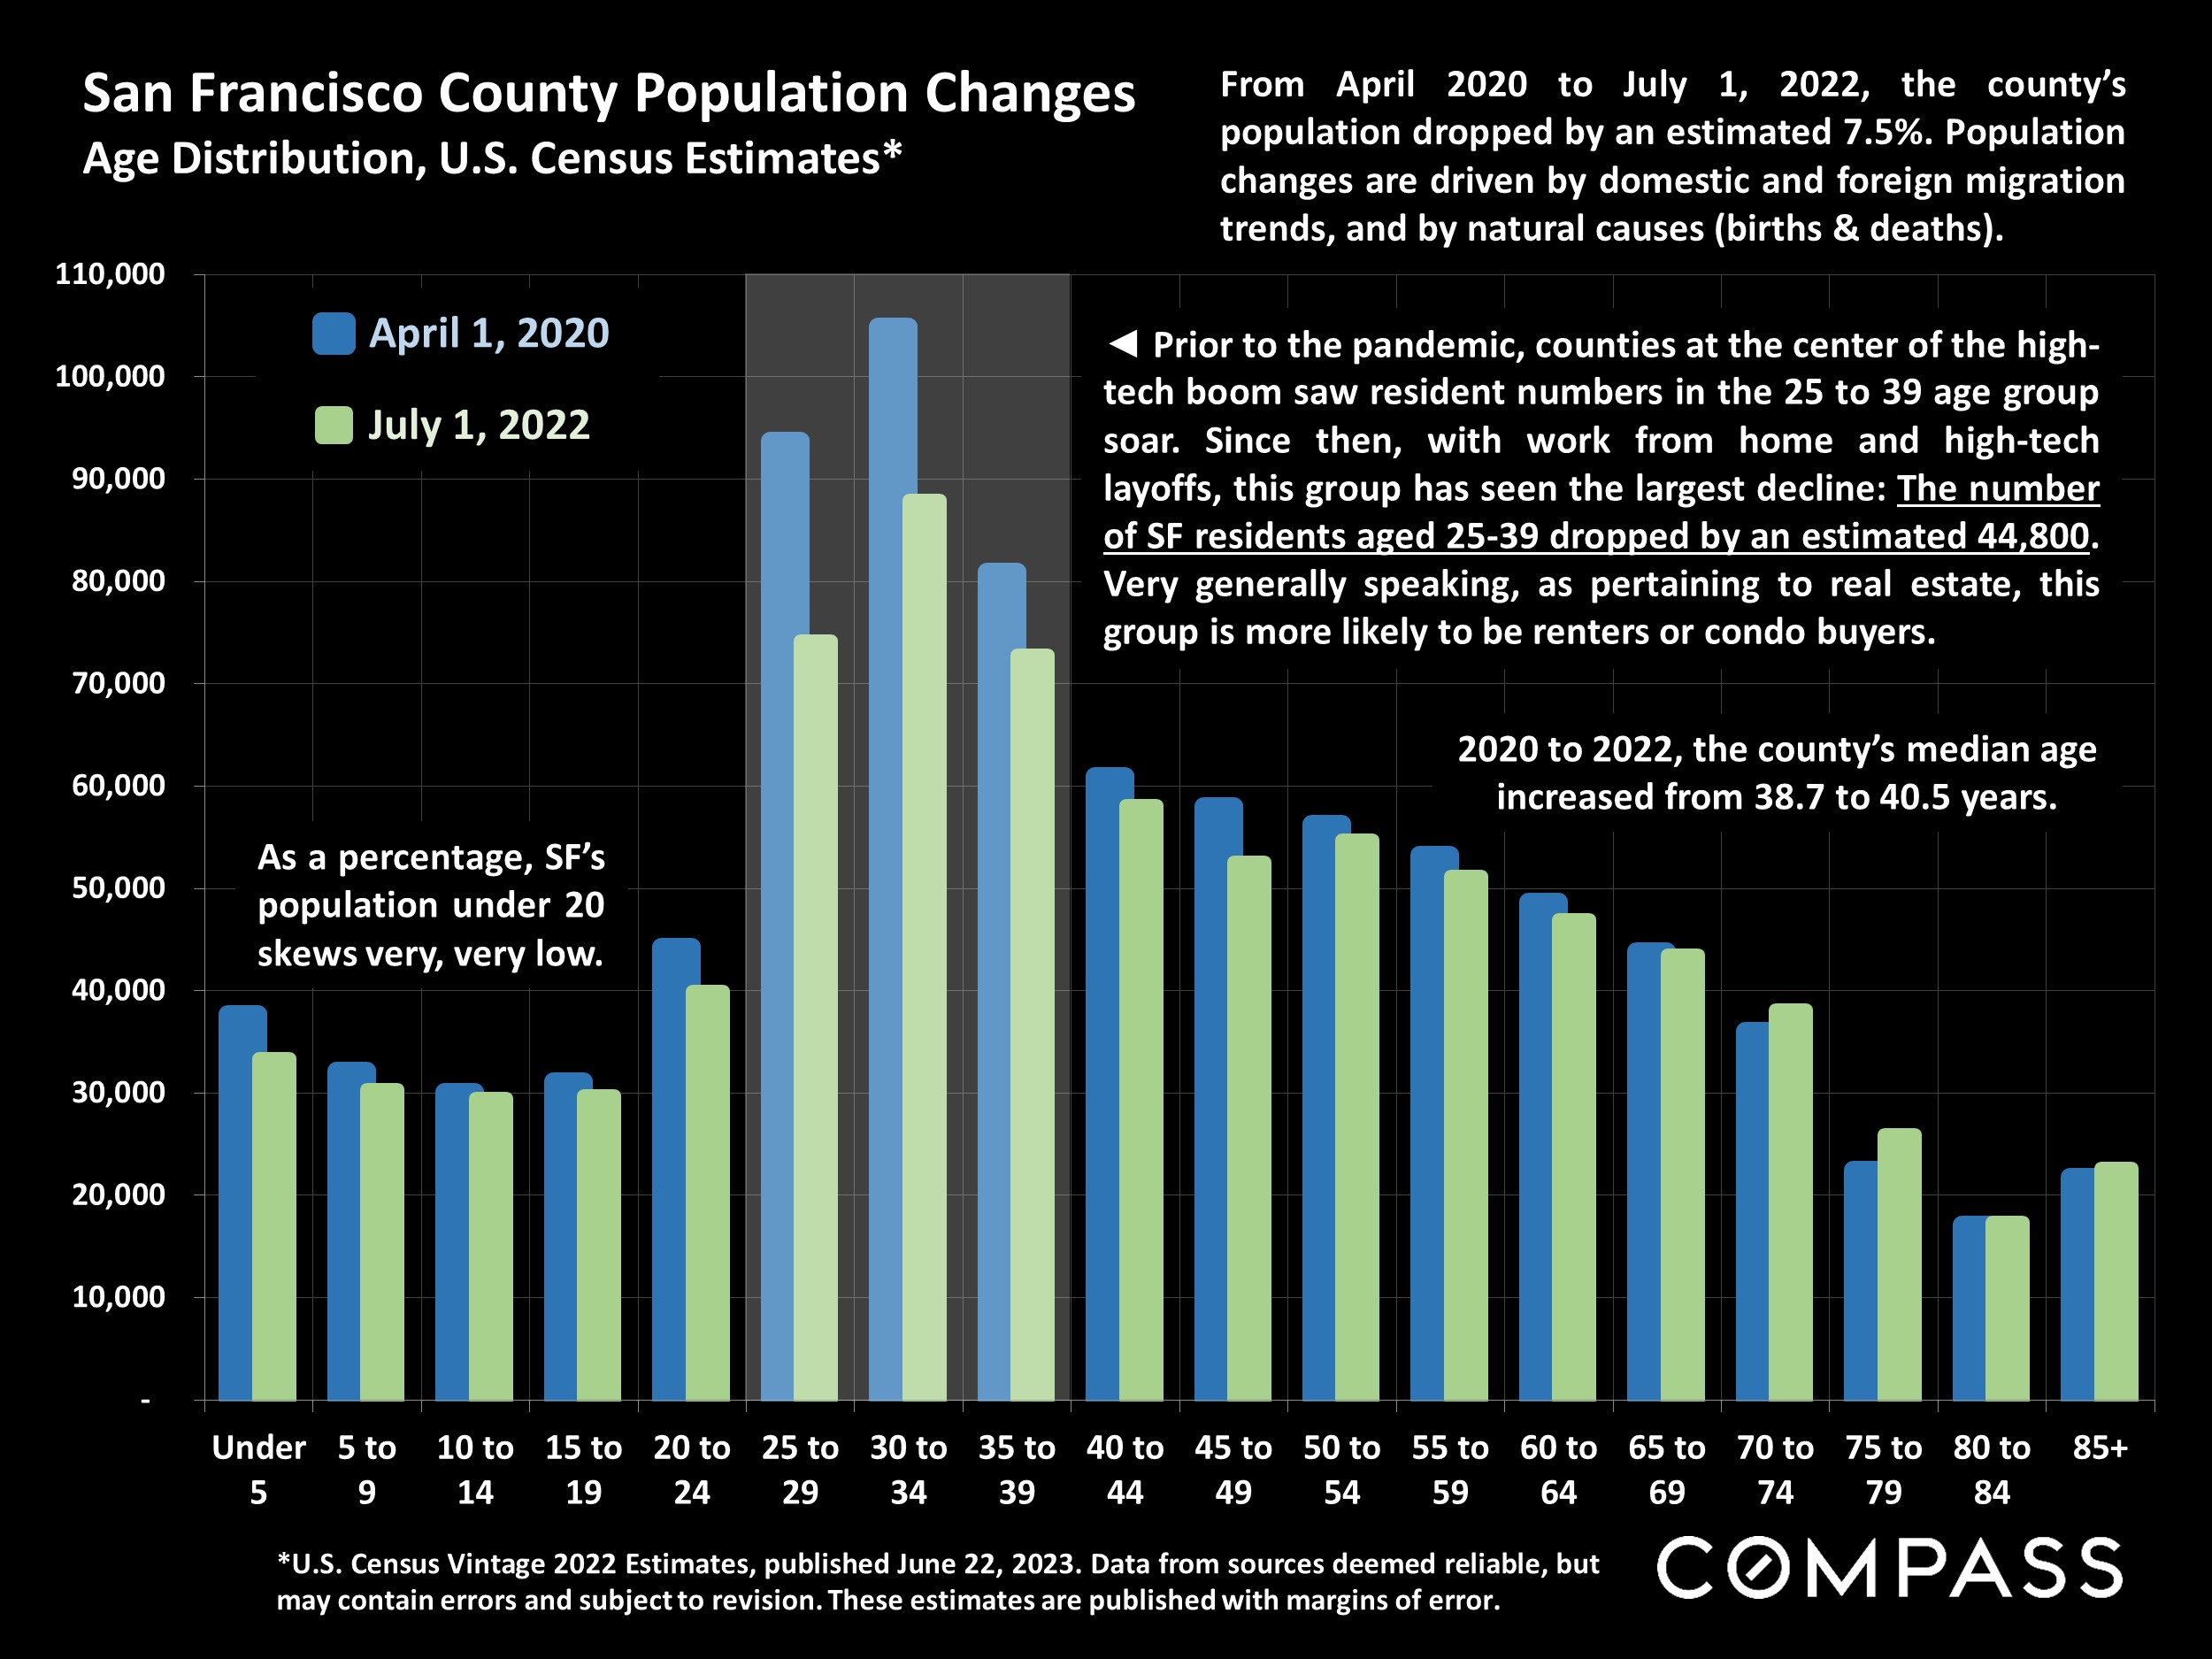
Chart comparing San Francisco County population by age group in 2020 and 2022, with the largest decline among ages 25–39.
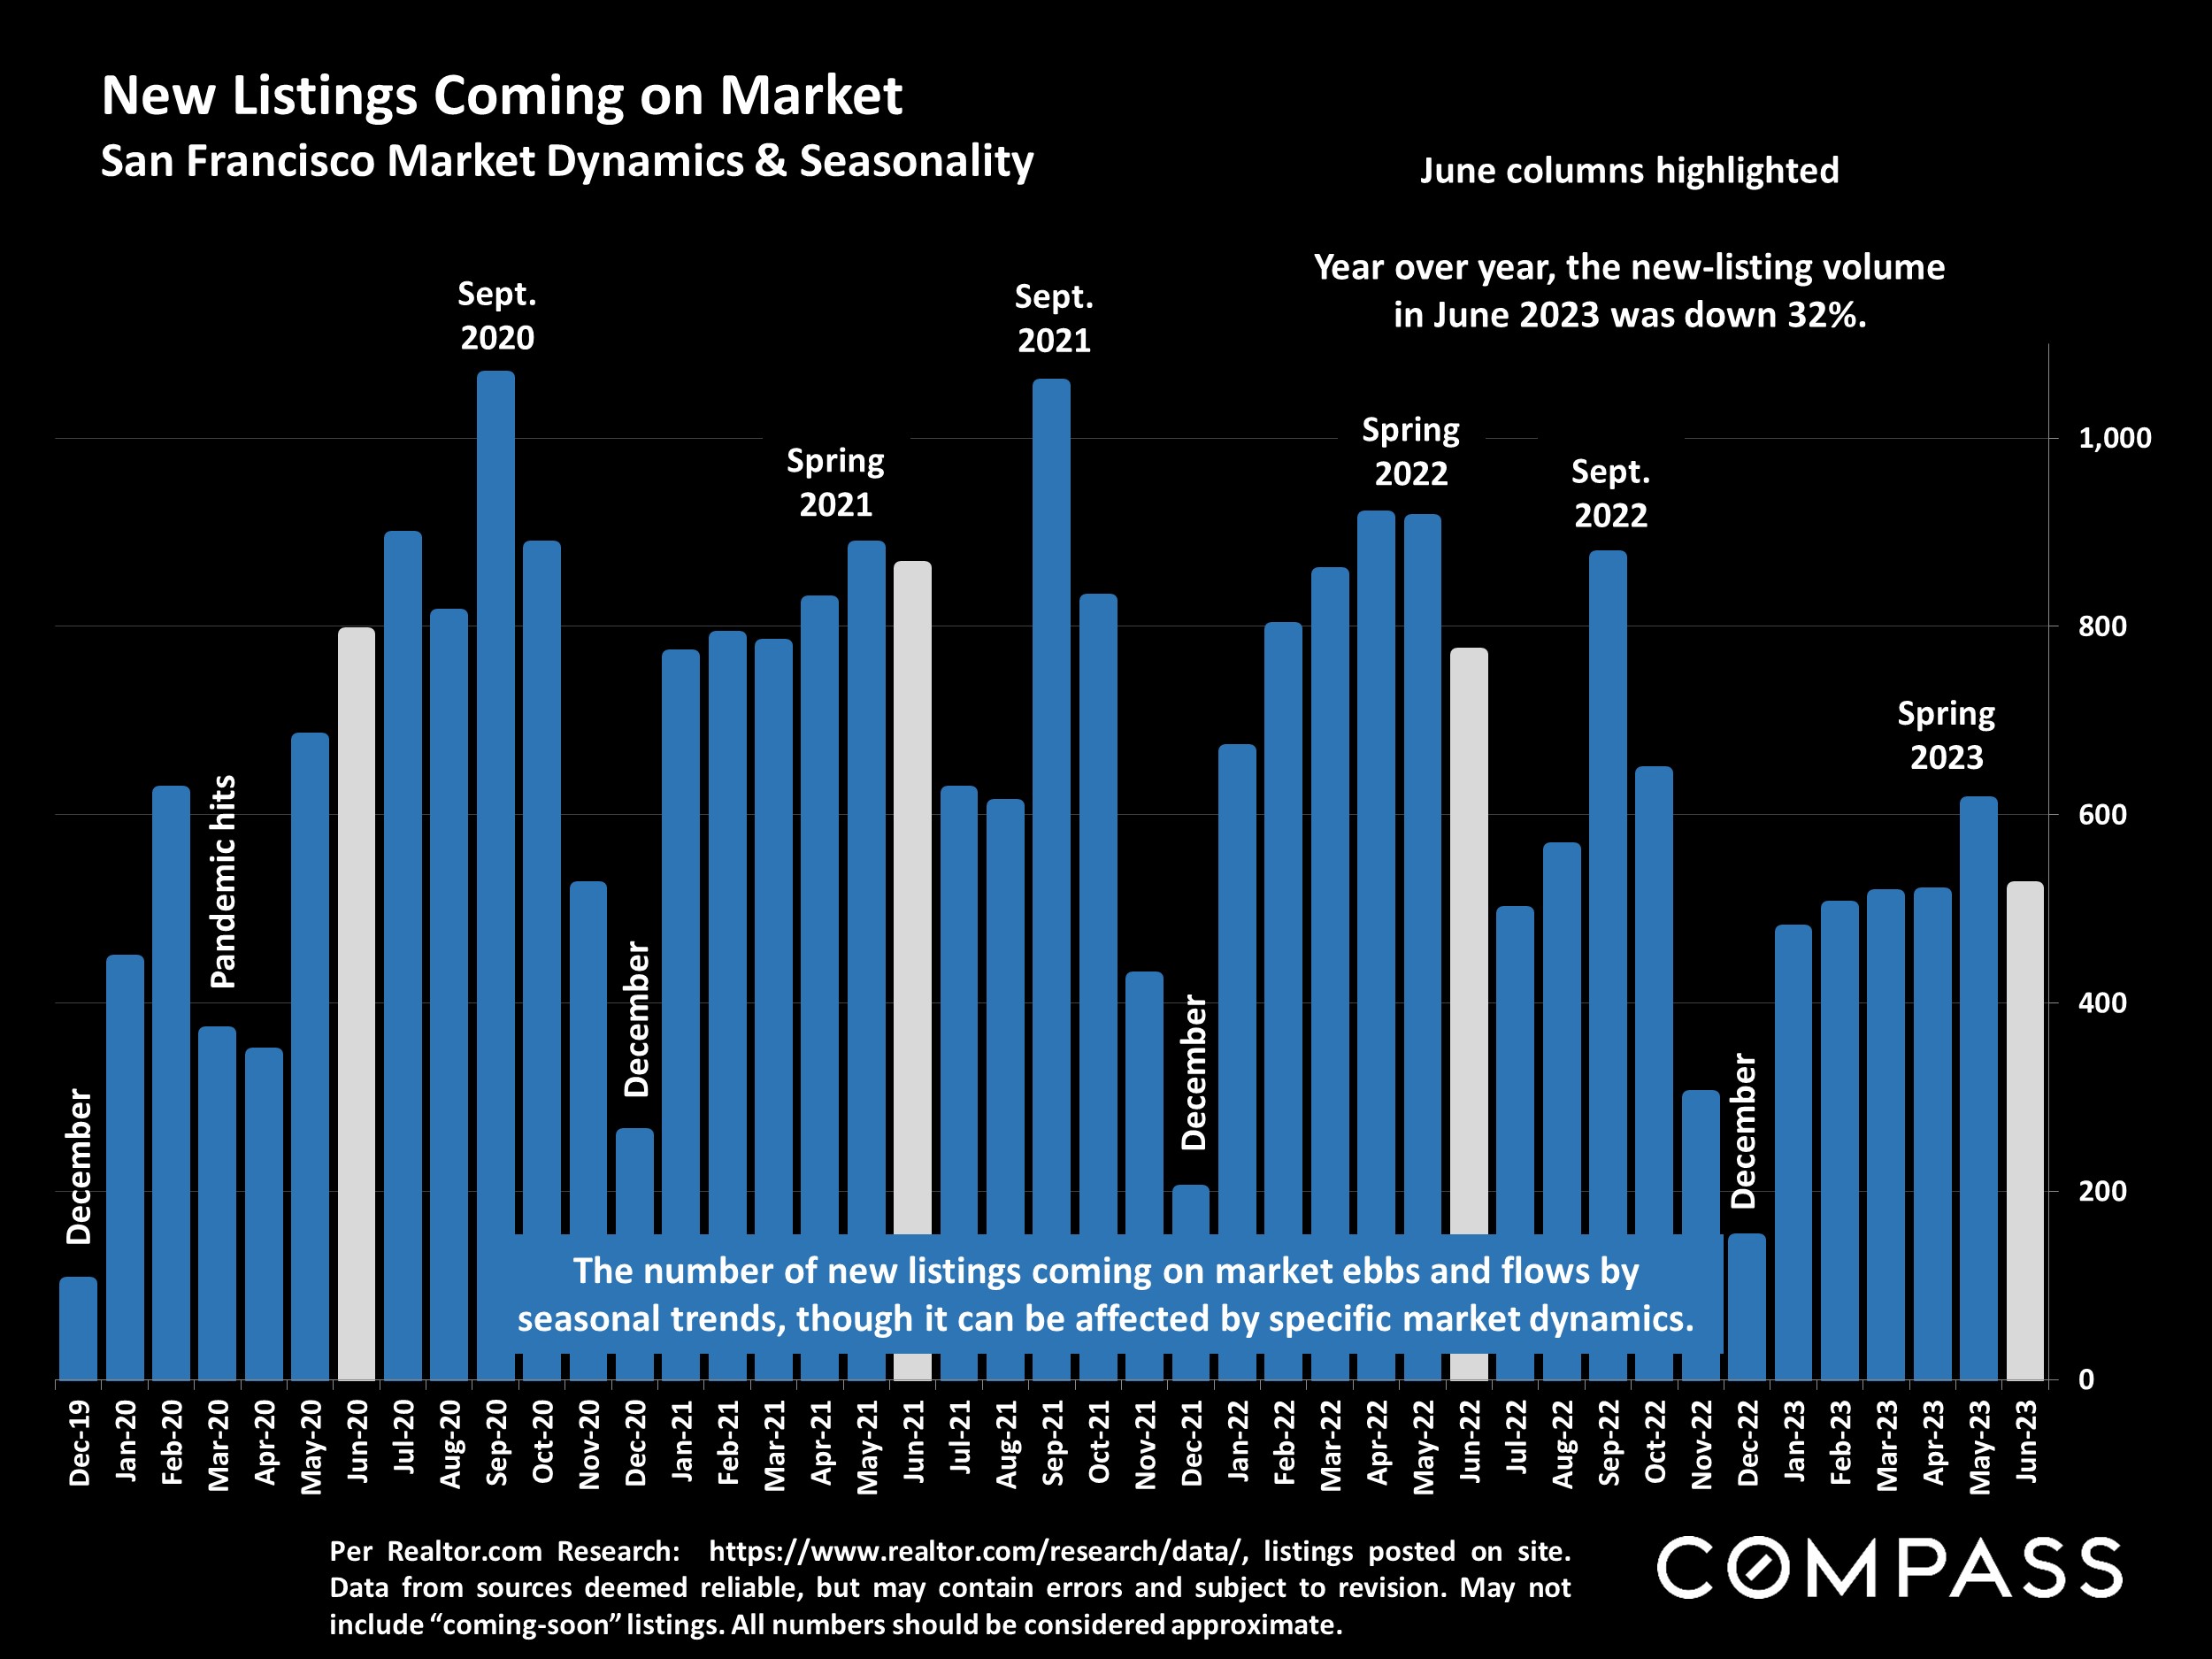
San Francisco monthly new-listing chart, December 2019–June 2023, with June columns highlighted and a 32% year-over-year decline noted.
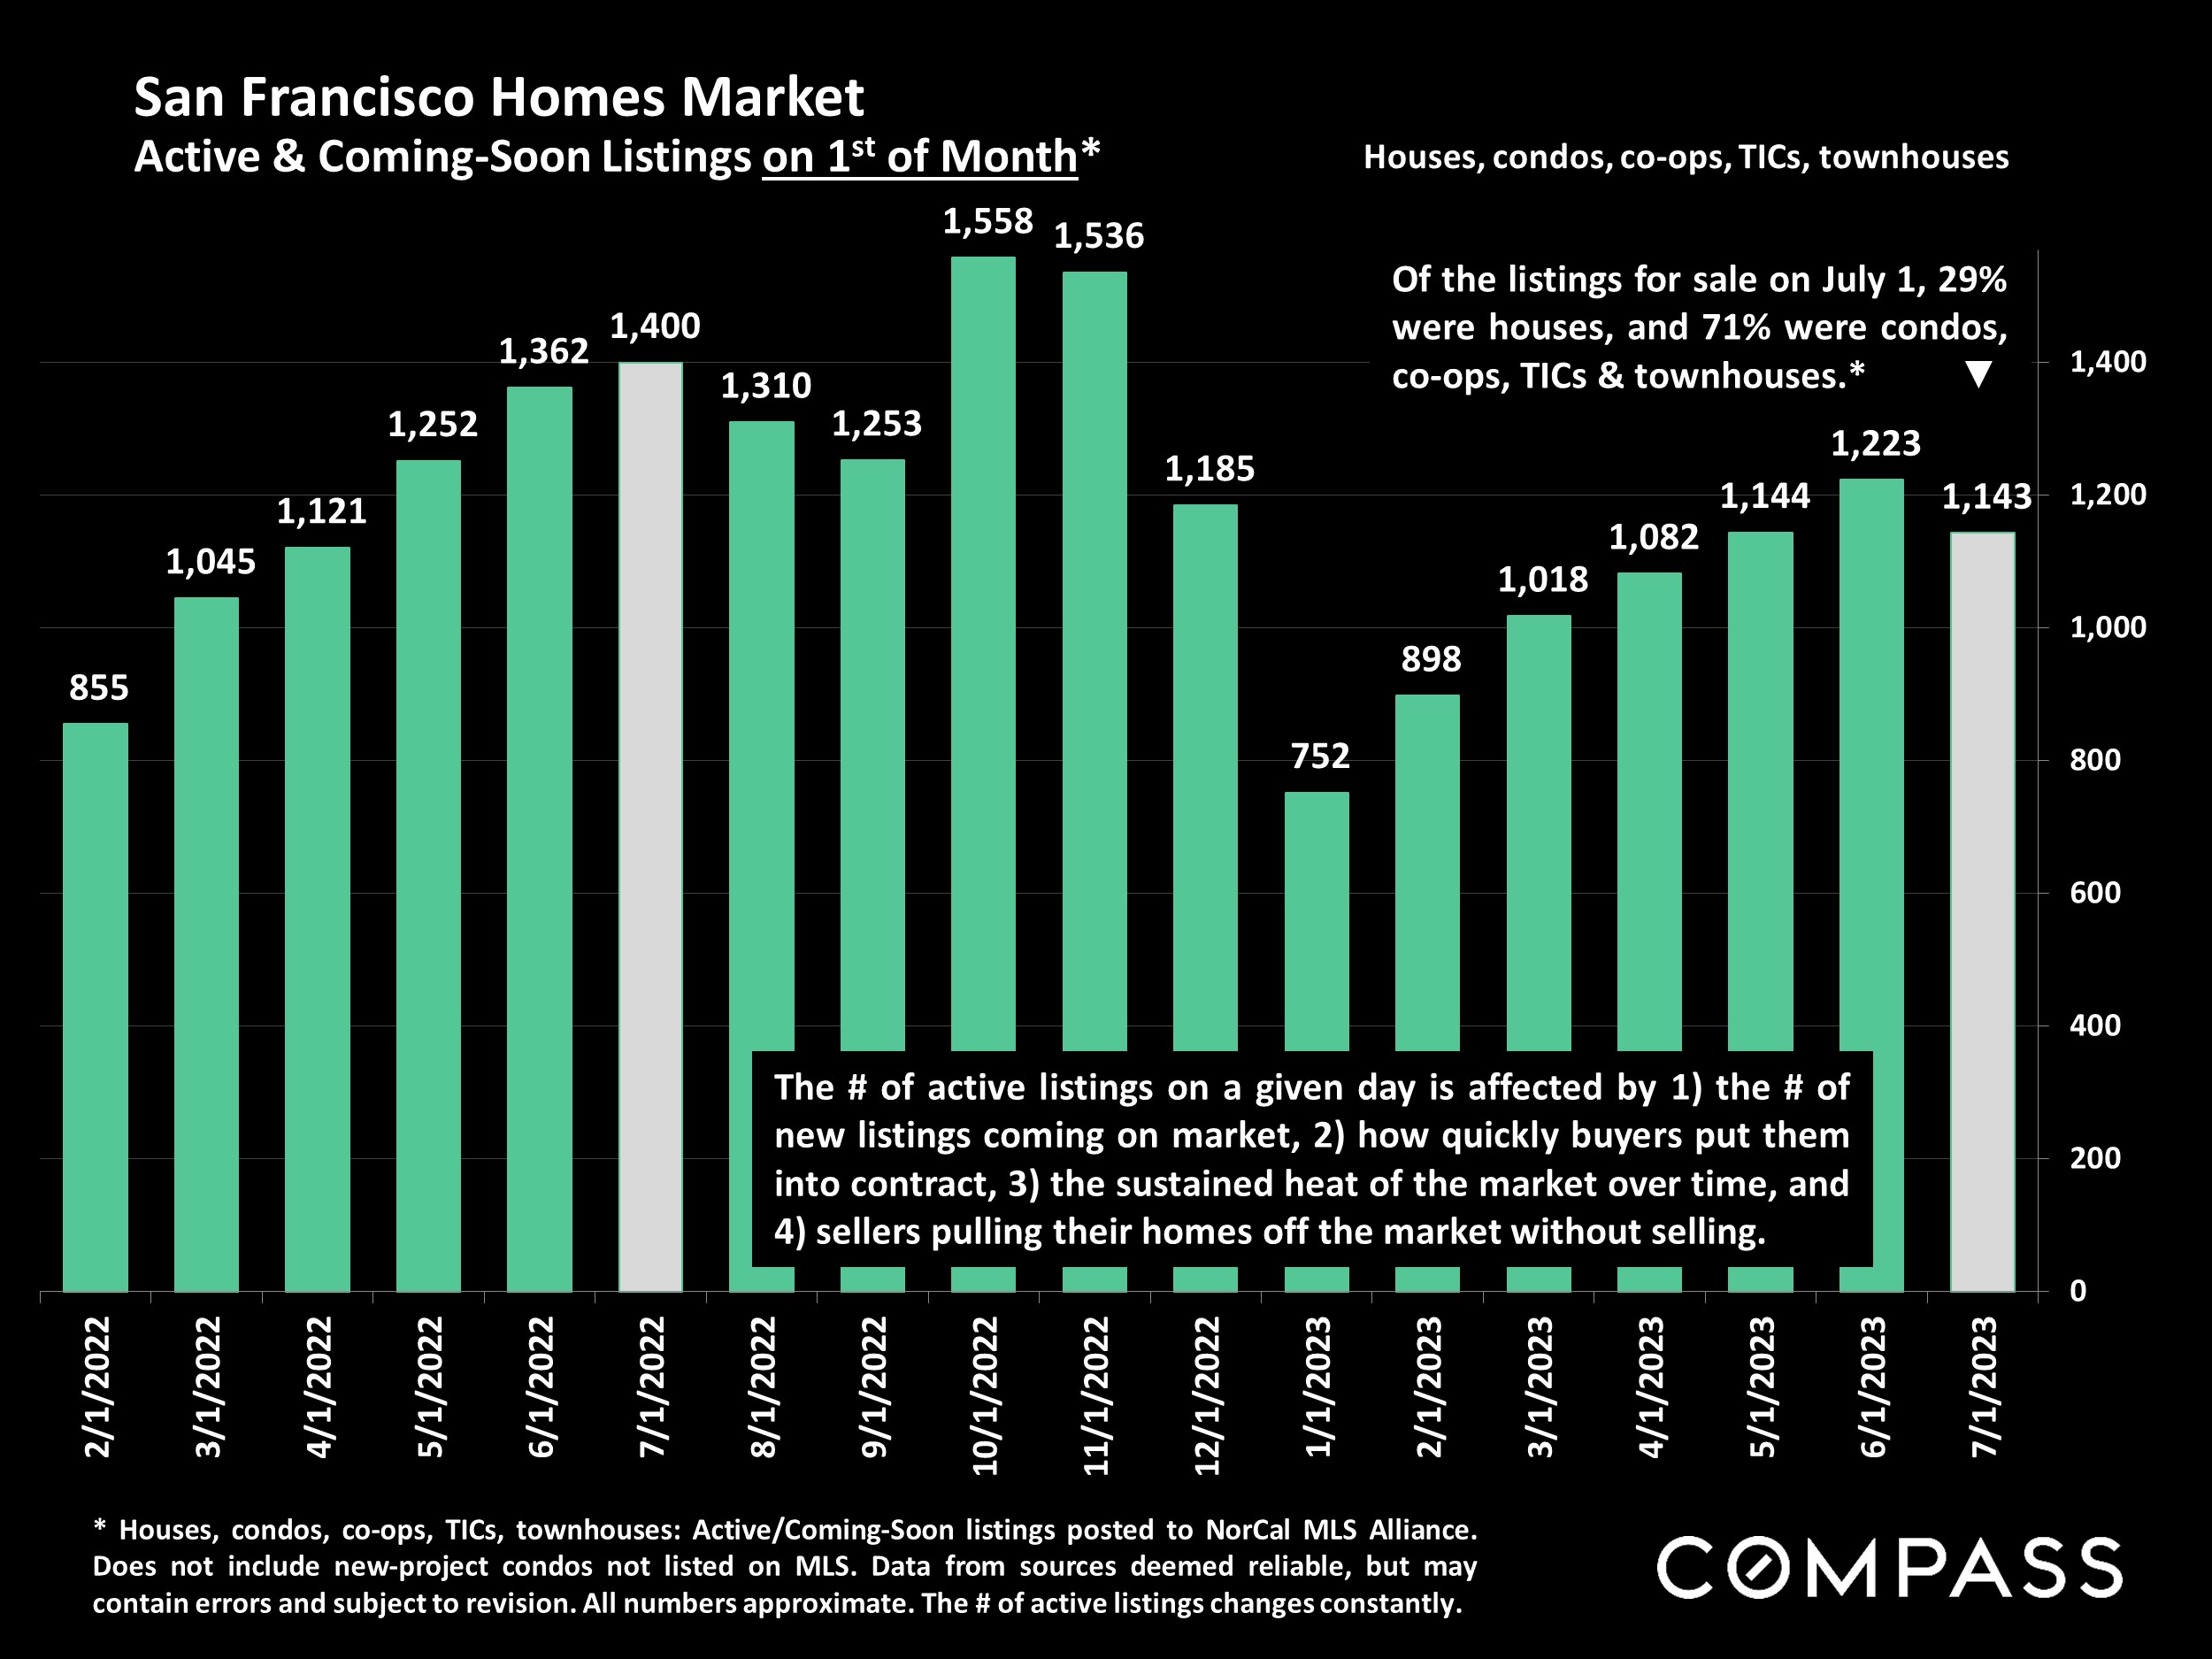
San Francisco active and coming-soon listings chart, February 2022–July 2023, peaking at 1,558 in October 2022.
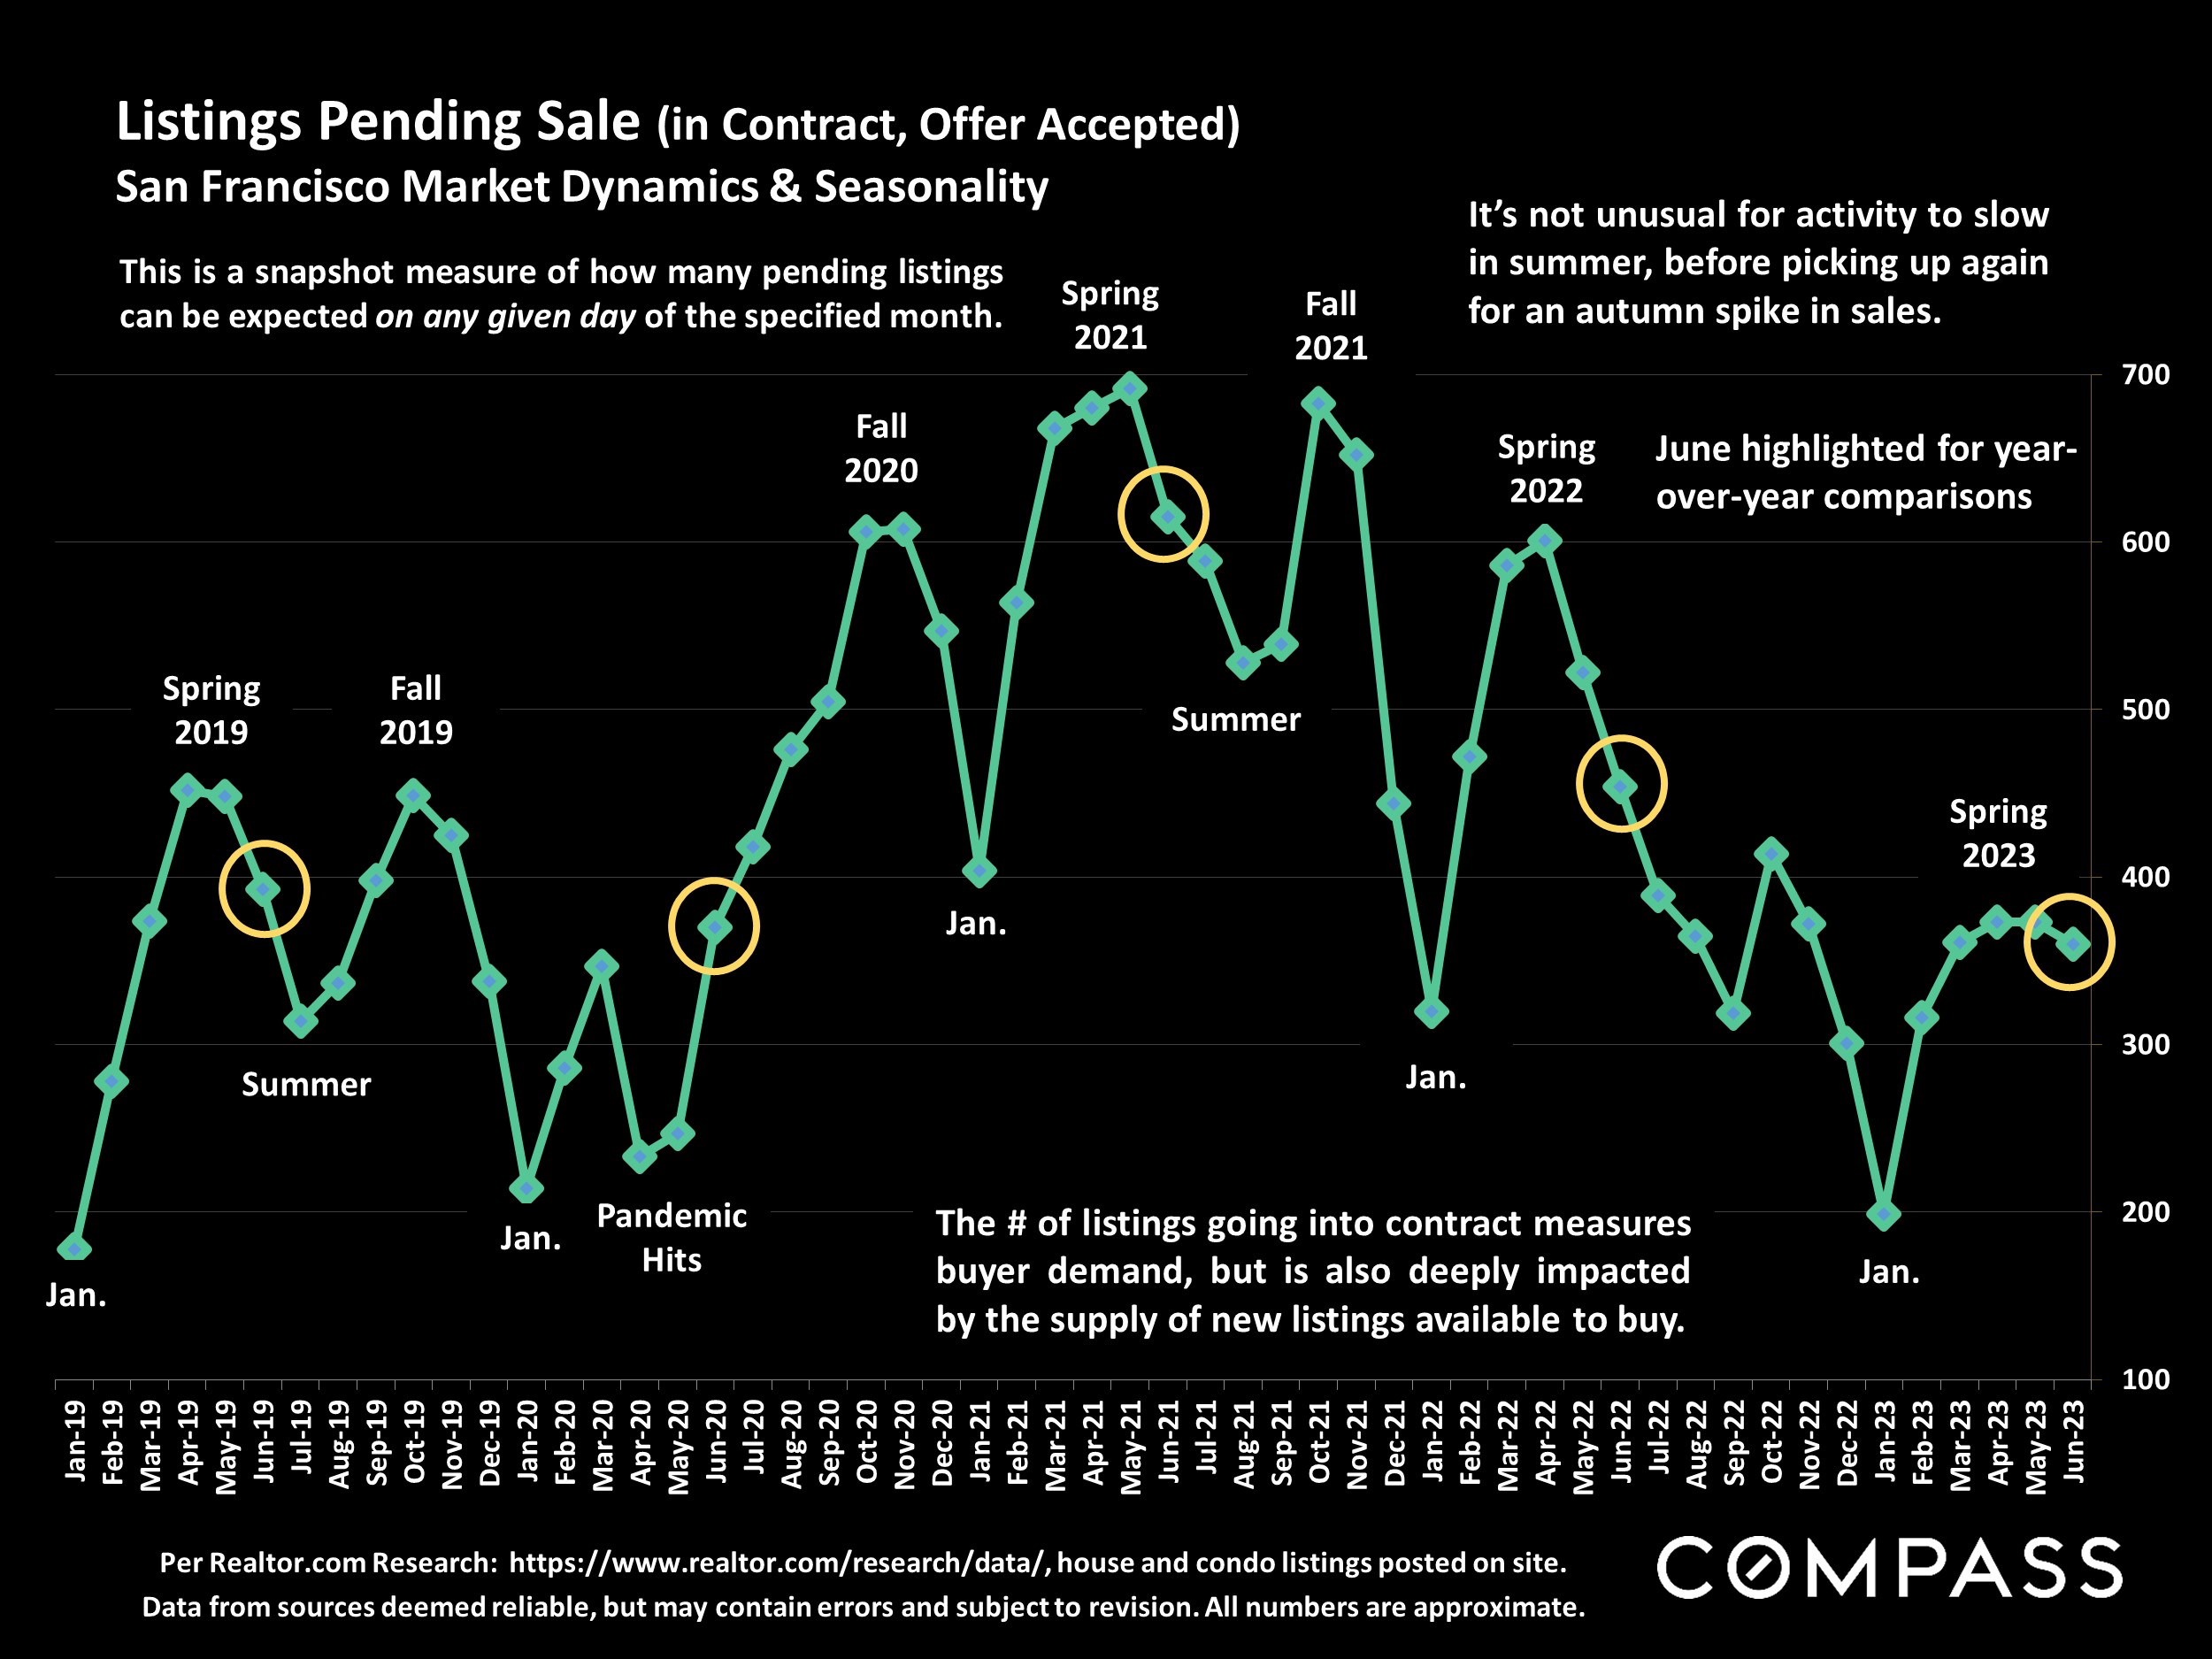
Chart of San Francisco pending listings from 2019 to June 2023, with seasonal peaks and dips highlighted.
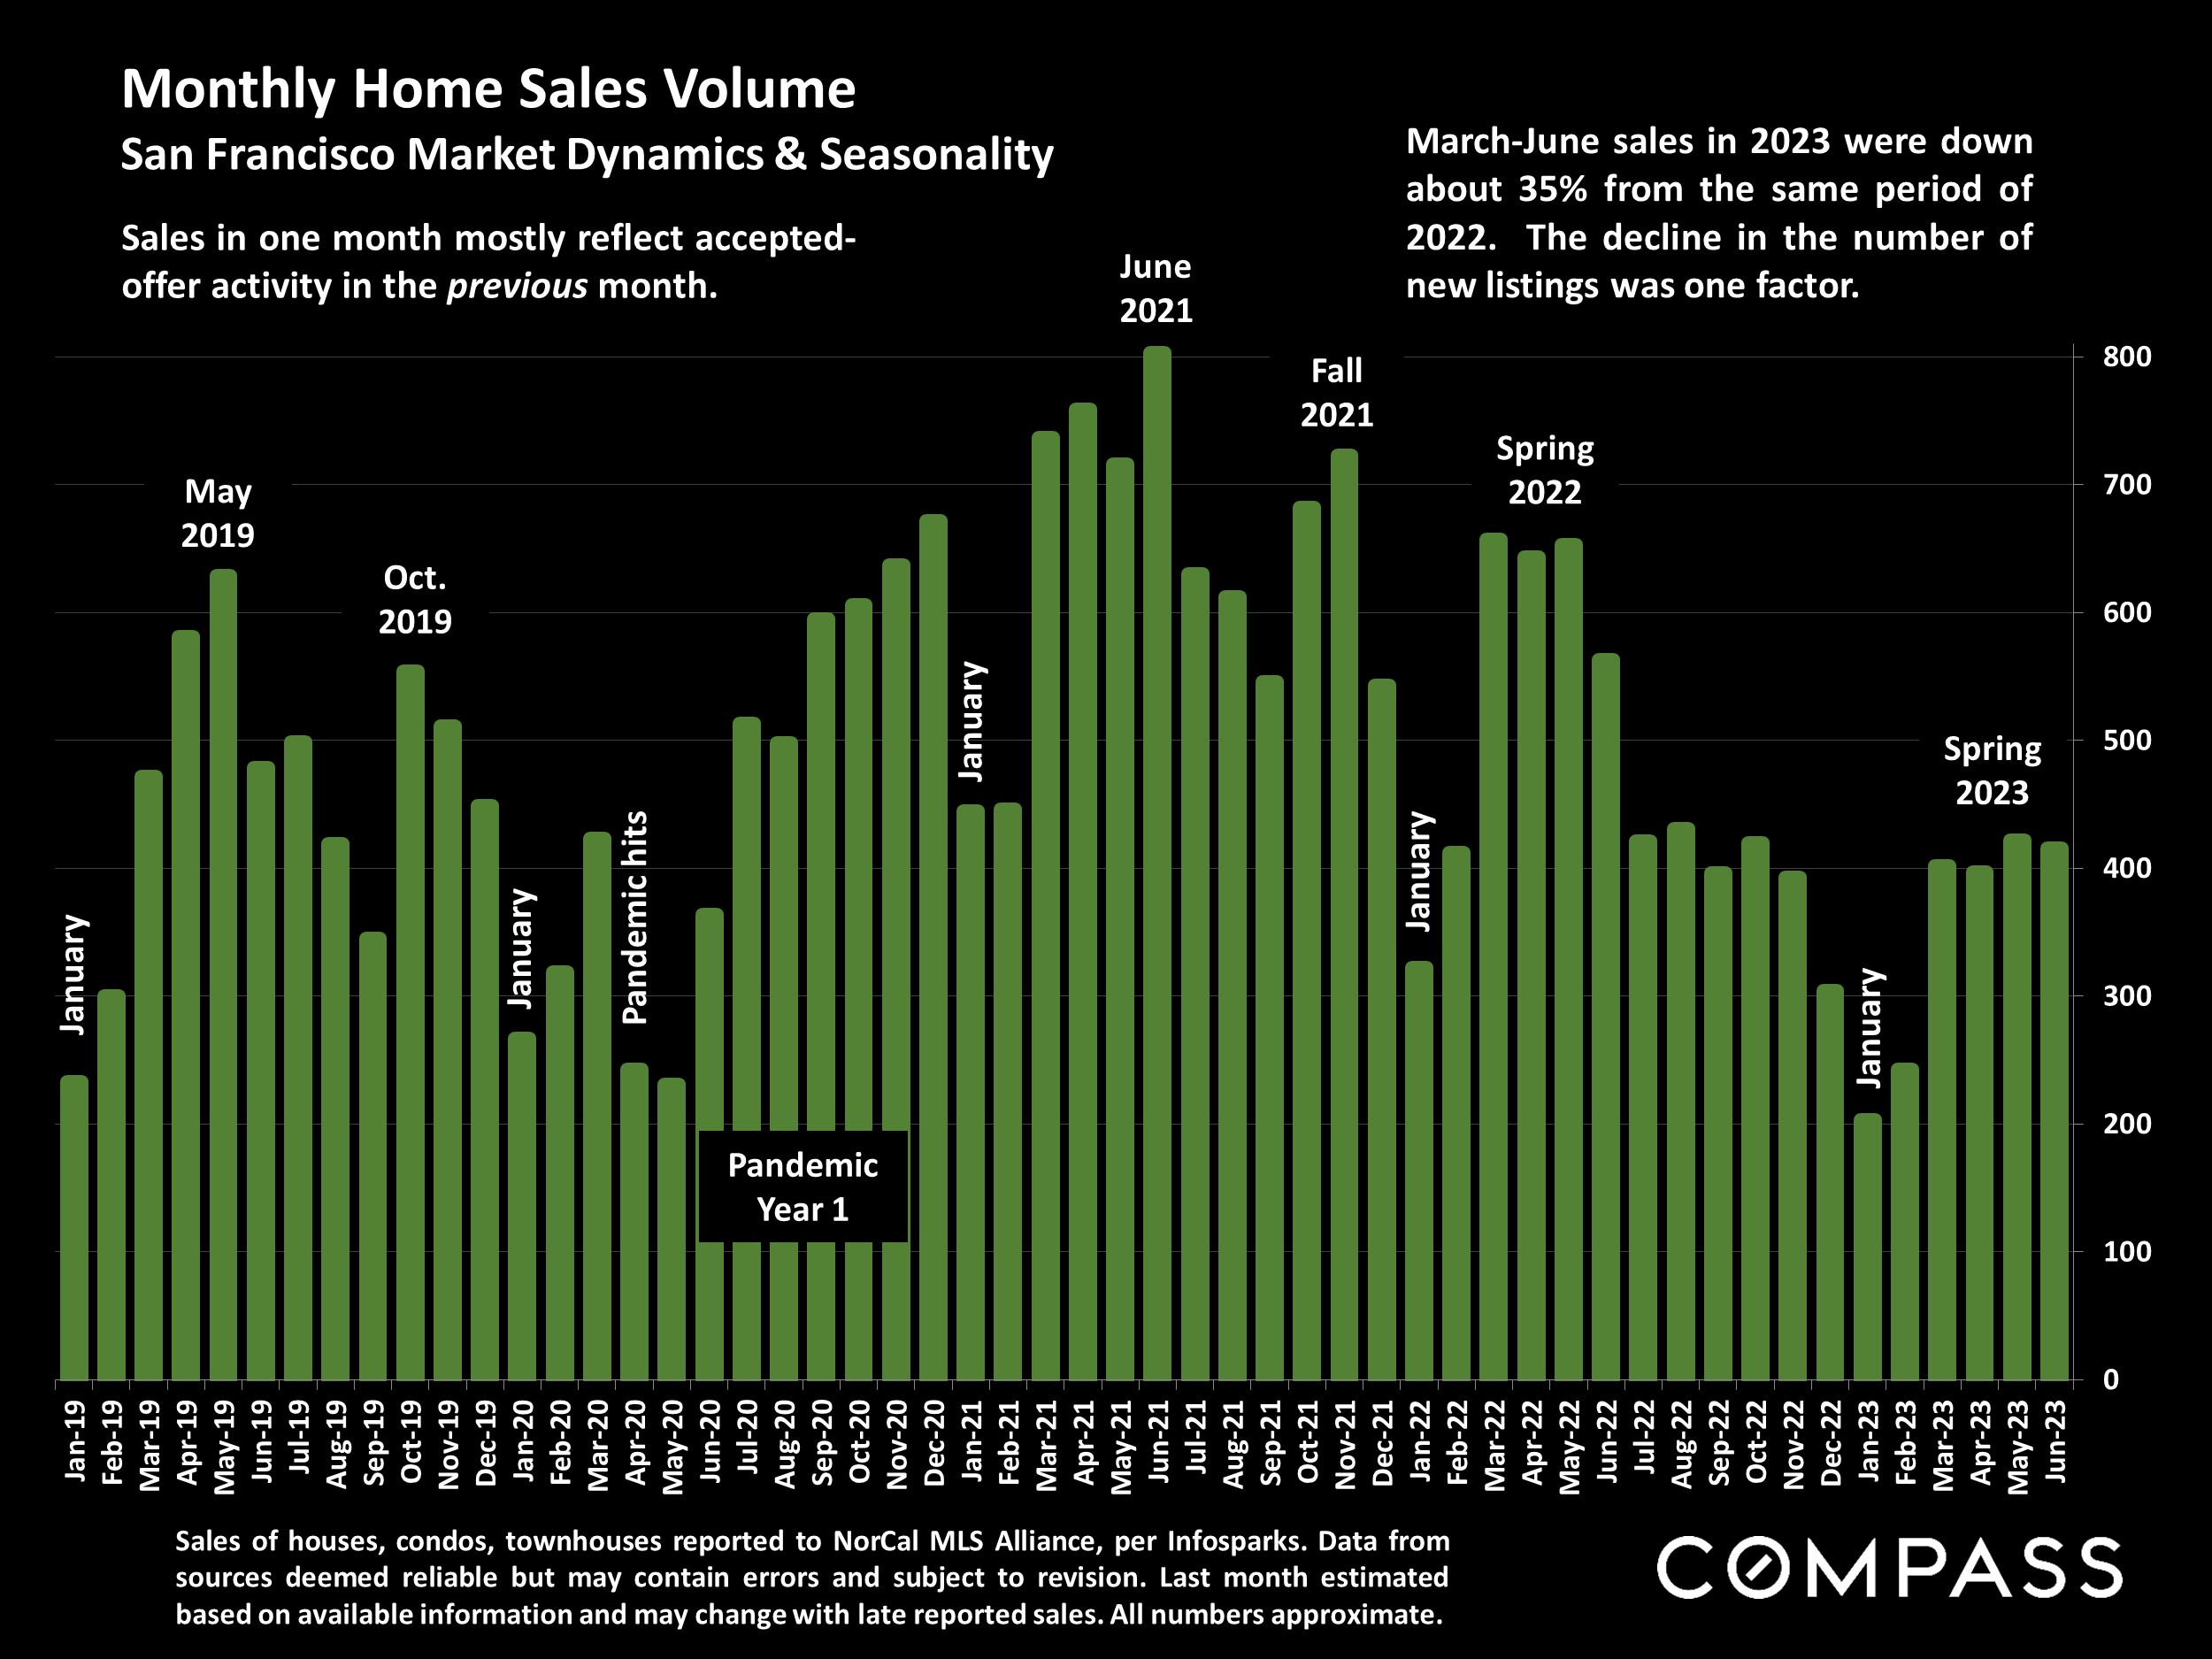
Chart of monthly San Francisco home sales, January 2019 to June 2023, with green bars and pandemic and seasonal annotations.
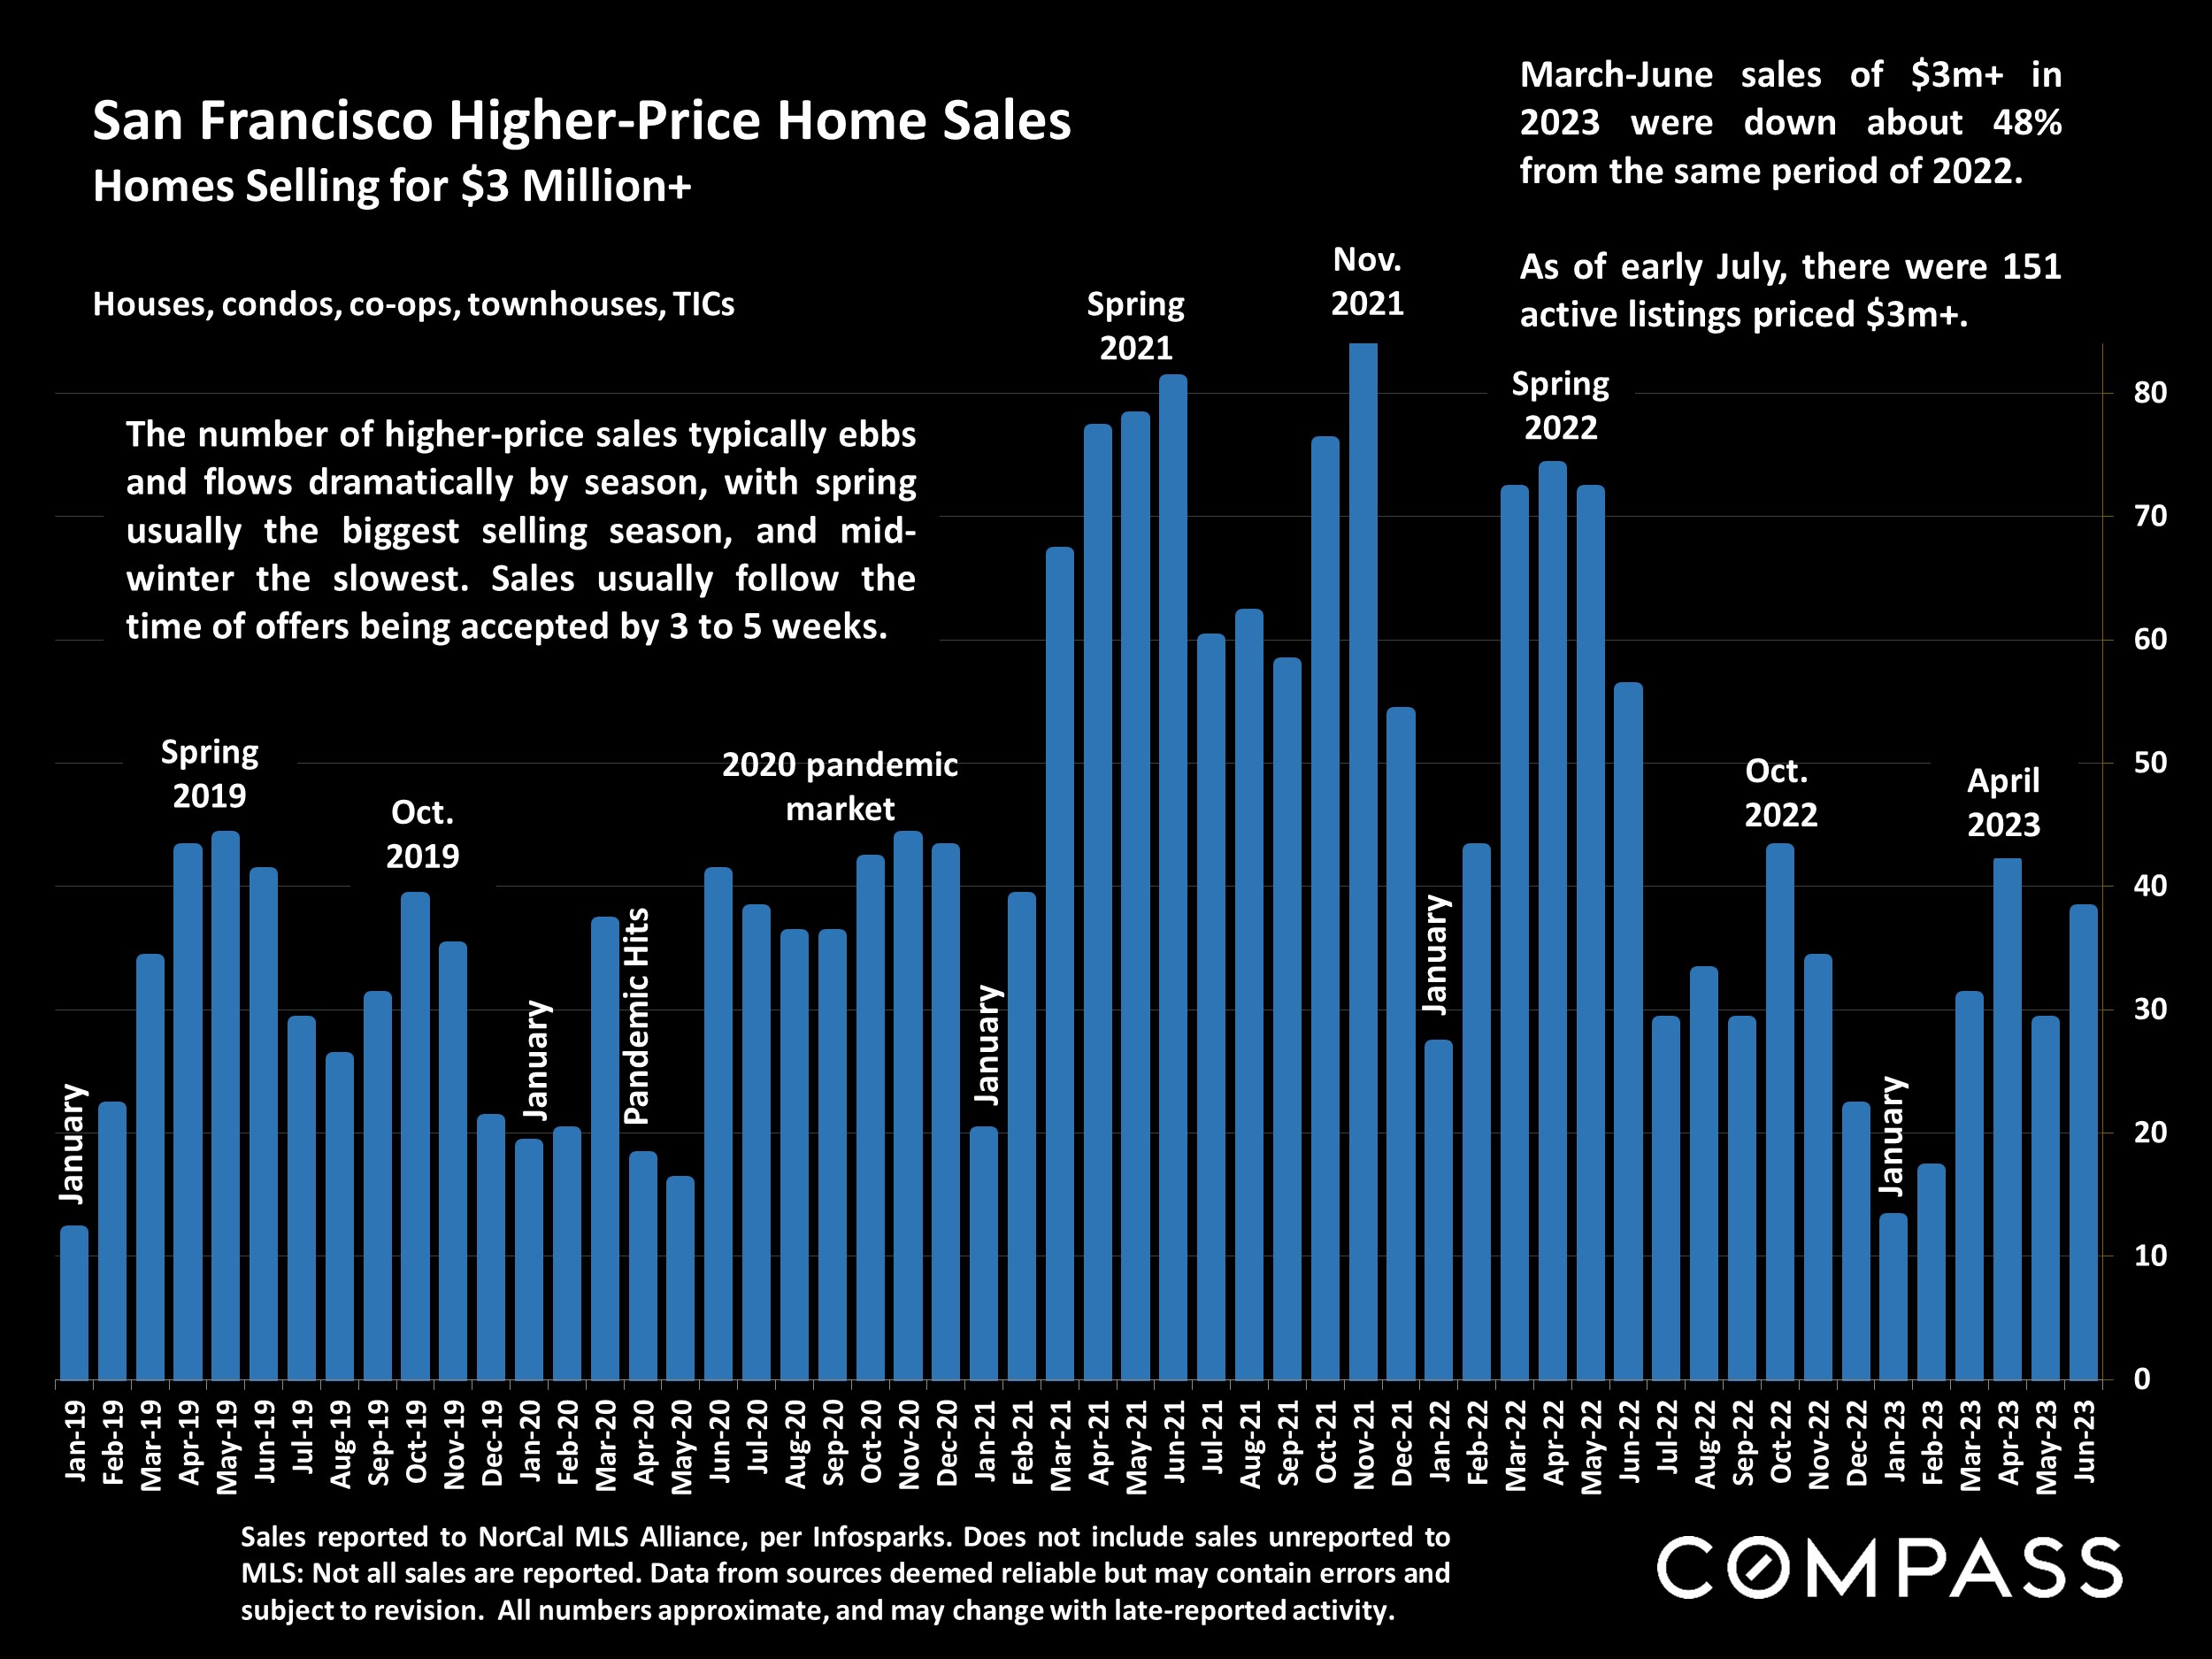
Bar chart of San Francisco $3 million-plus home sales by month, January 2019–June 2023.
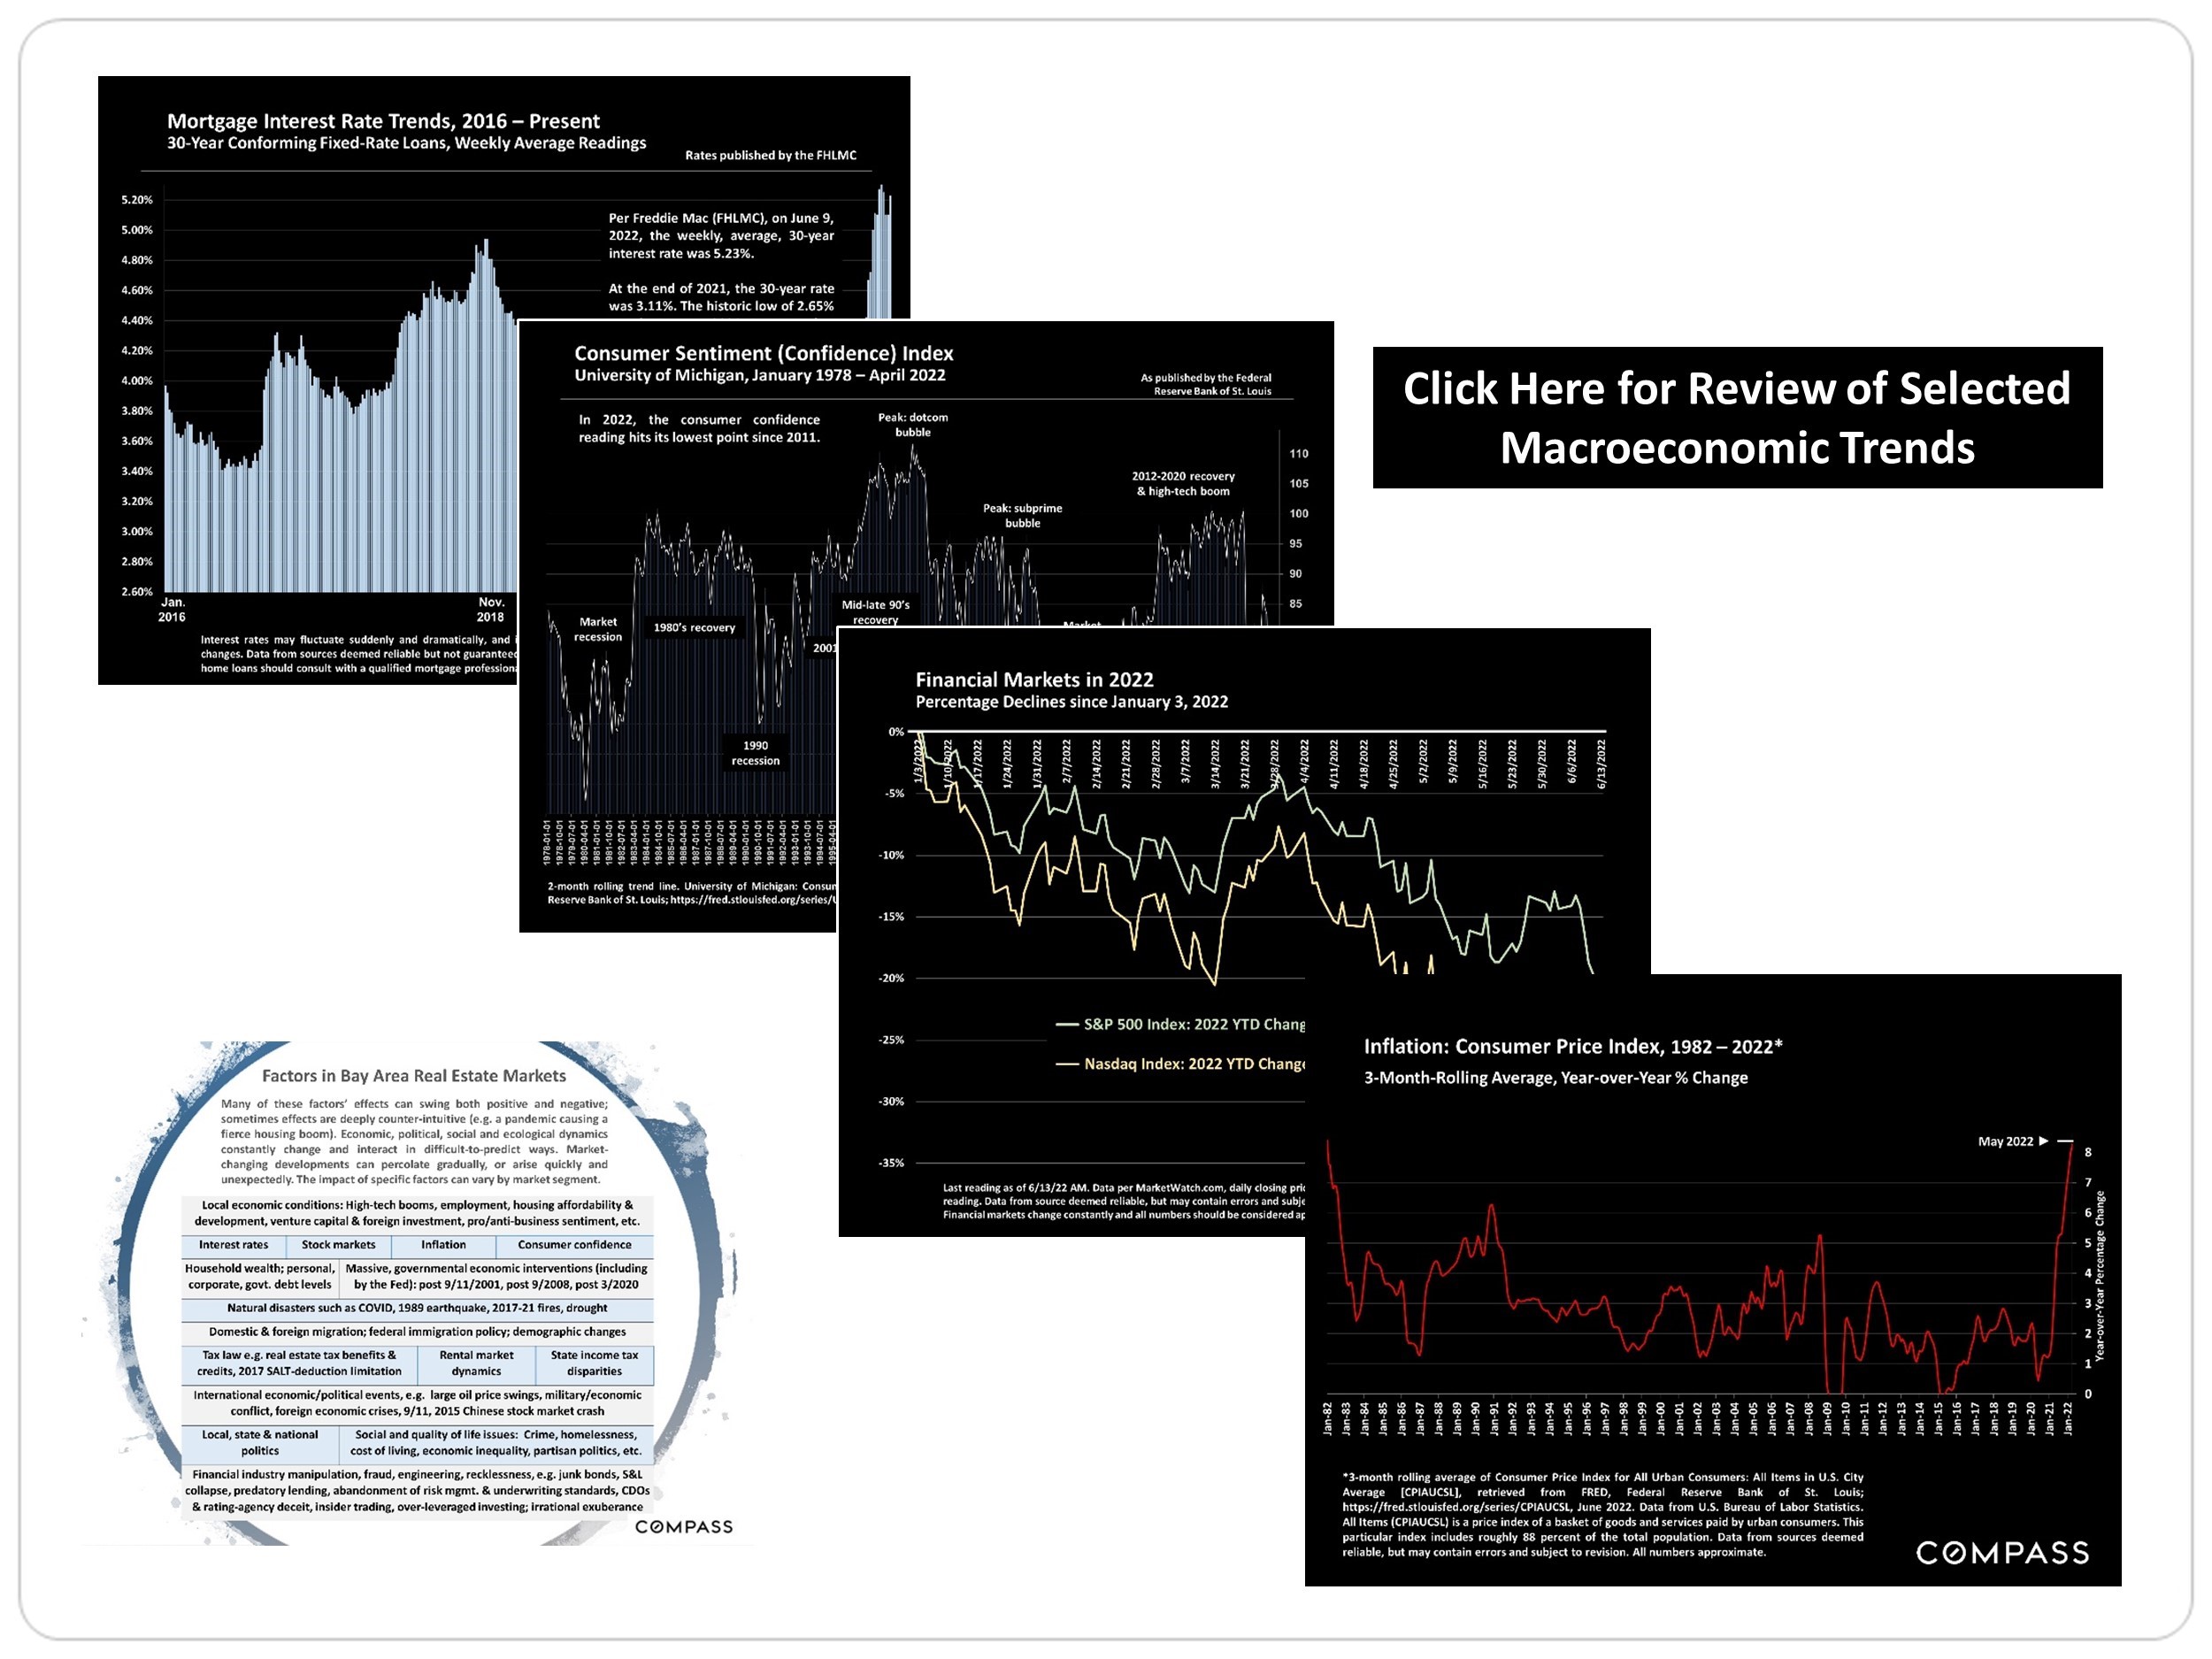
Economic charts on mortgage rates, consumer sentiment, markets, and inflation alongside a Bay Area real estate factors infographic.
 

Work With Jason

Drawing on his decade of experience in finance, investment management, and holistic financial planning, and as a Chartered Financial Analyst ( CFA ® ) charterholder, he leverages his financial acumen and analytical focus to help his clients navigate the sophisticated San Francisco market.
Contact
Follow Us