San Francisco Real Estate Market Update | February 2023

A review of house and condo prices, appreciation rates, supply and demand, overbidding, time and market, luxury home sales and macroeconomic factors pertinent to the San Francisco real estate market.

San Francisco real estate February 2023 report cover with a foggy, tree-lined pond.

Market update text describes early 2023 signs of rebounding buyer demand in the Bay Area.

Real estate market commentary on early 2023 conditions and the Bay Area spring selling season, with a Compass wordmark.

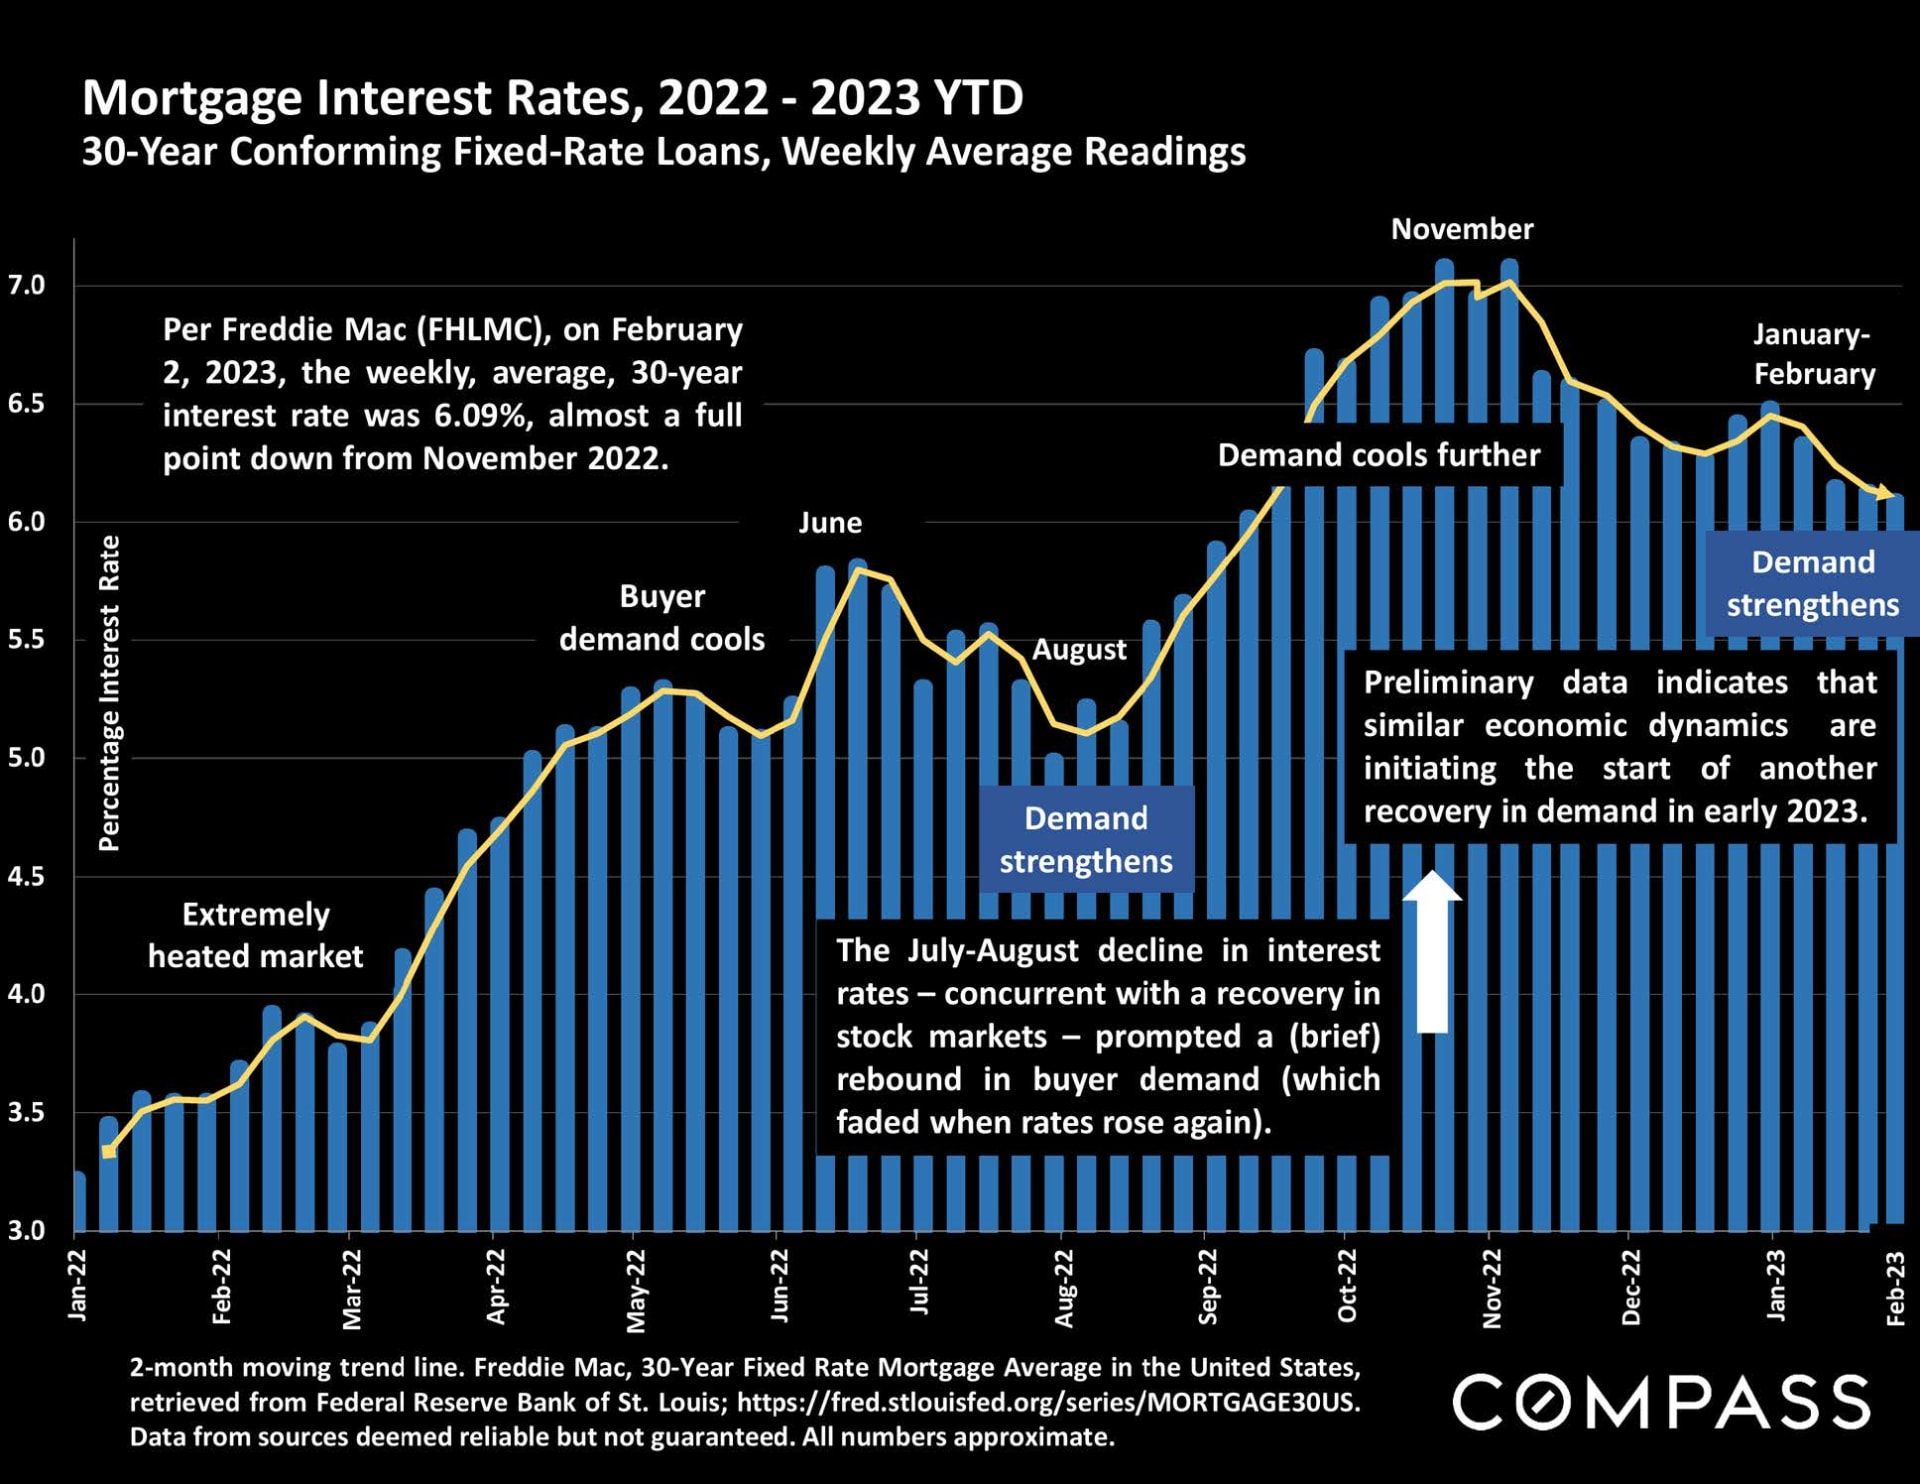
Mortgage rate chart shows 30-year fixed rates peaking near 7% in November 2022 before falling to 6.09% in February 2023.

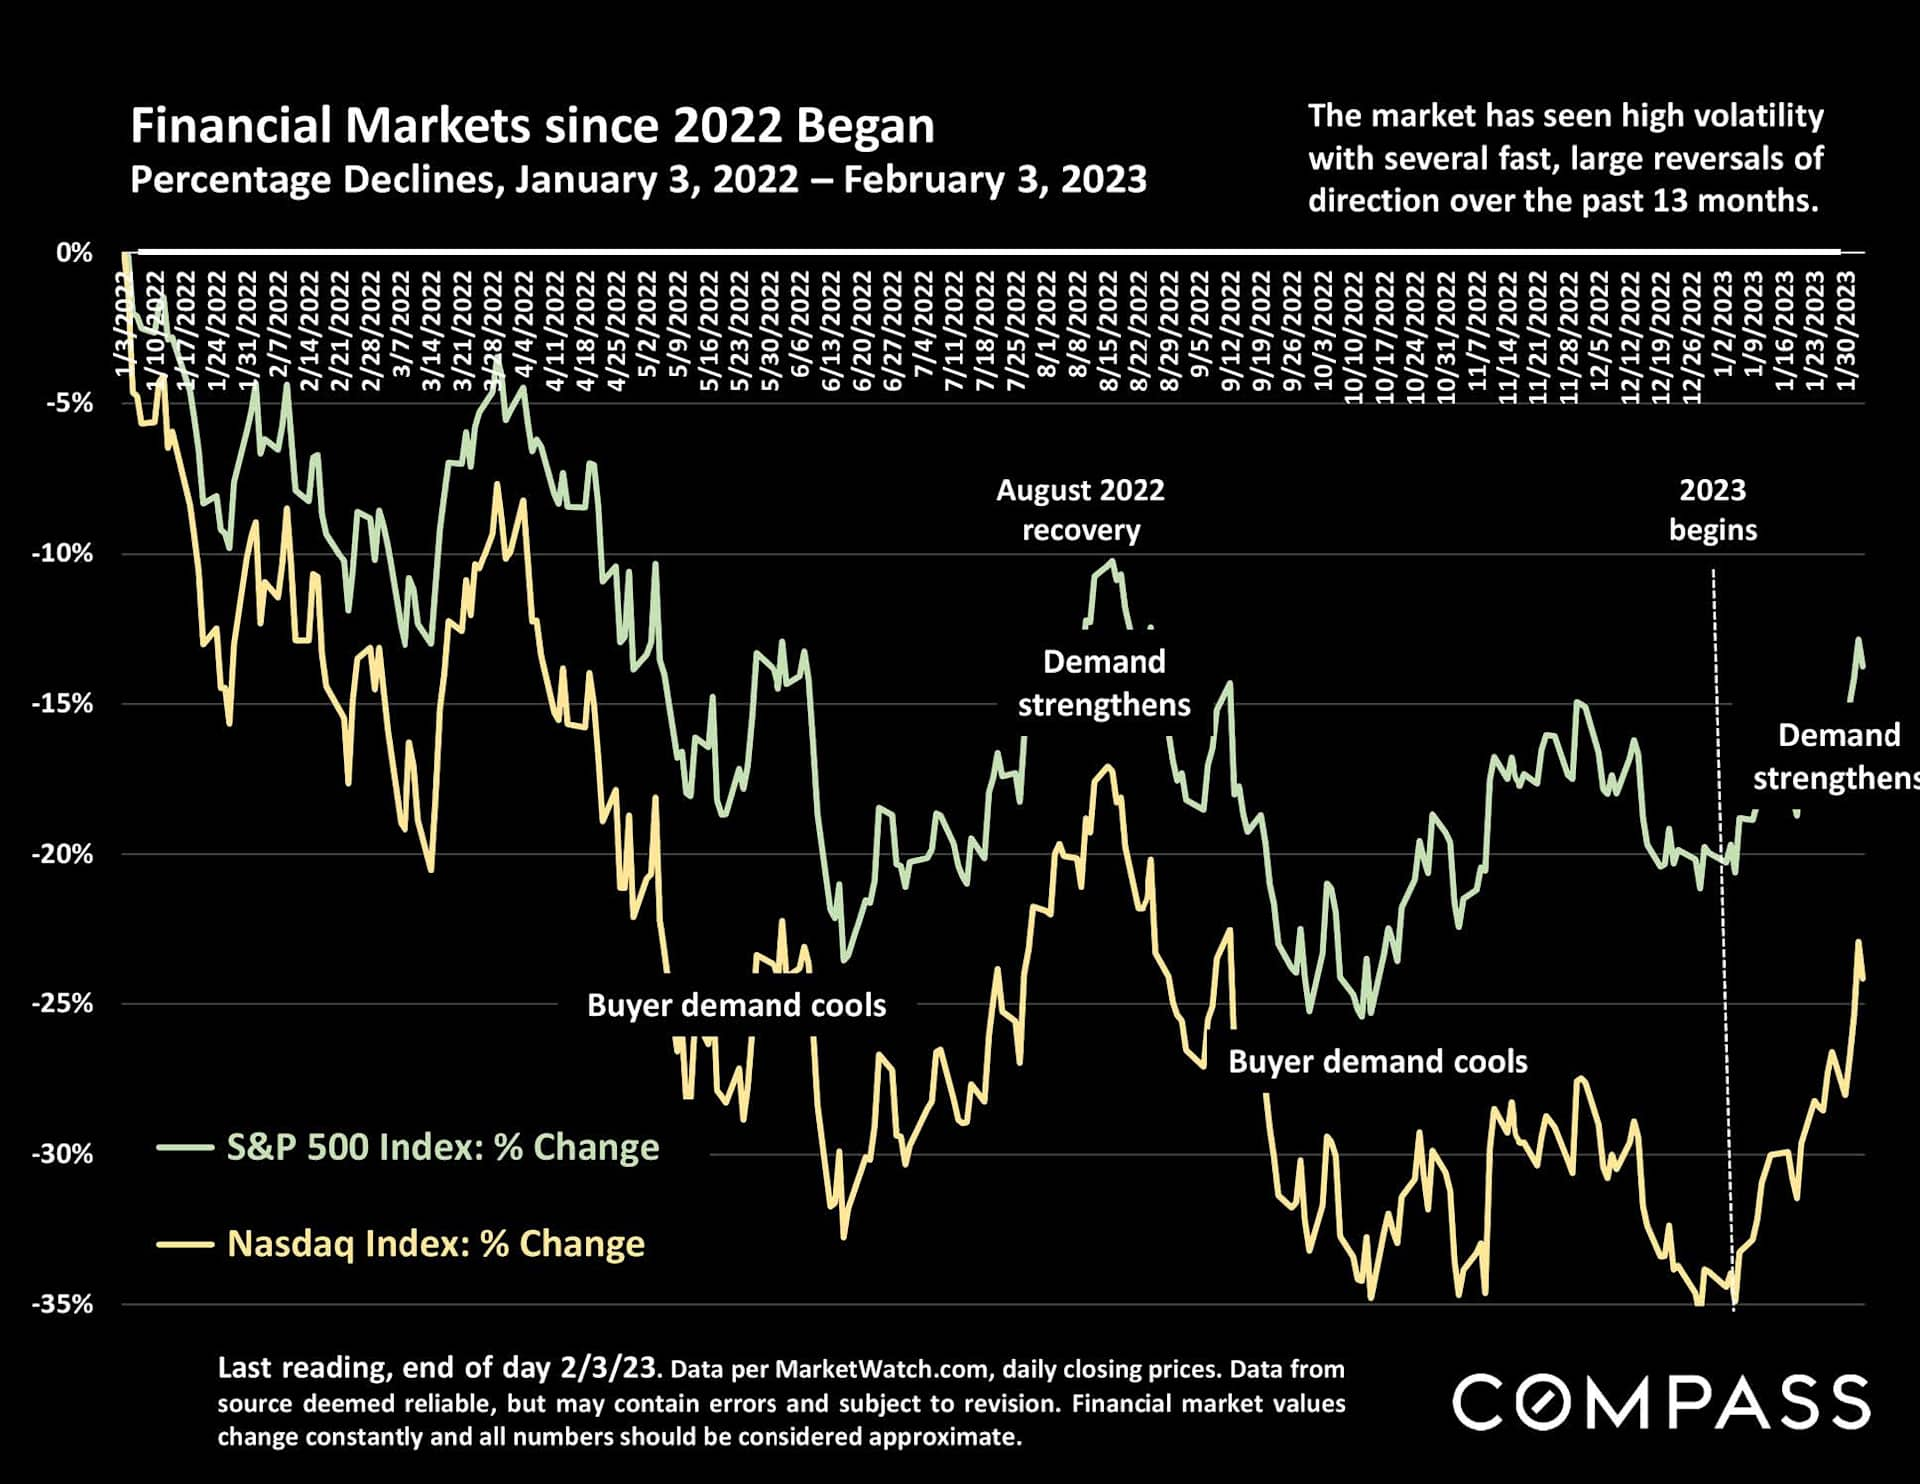
Chart comparing S&P 500 and Nasdaq declines, with annotations through February 3, 2023.

Chart of San Francisco median house prices from 1990 to January 2023, with a recent decline to $1.5 million.

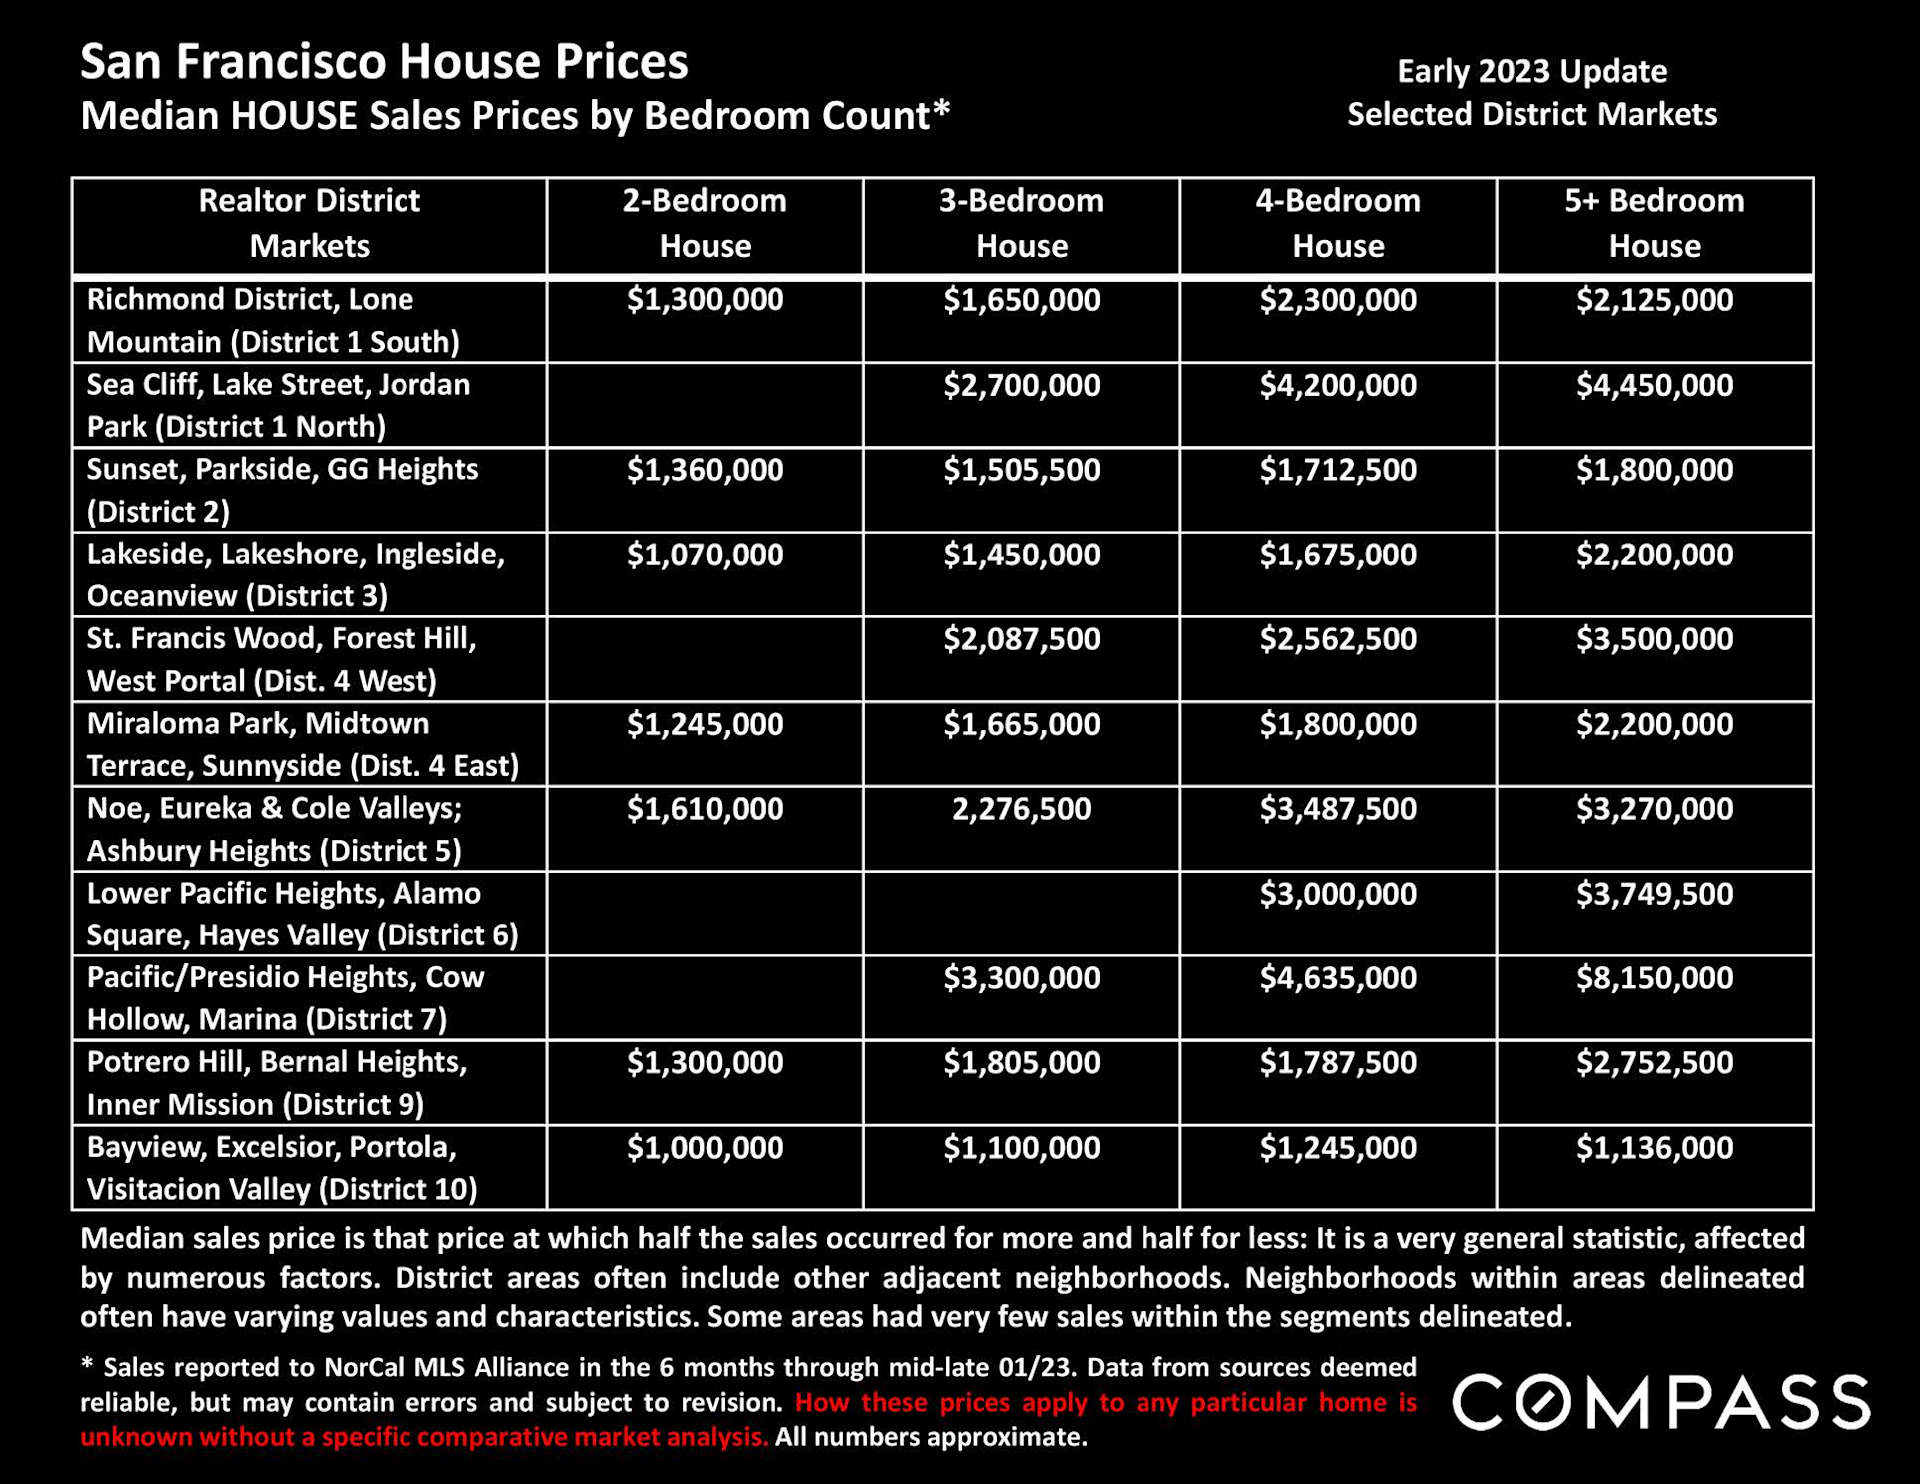
Chart of median San Francisco house prices by bedroom count across selected districts, early 2023.

San Francisco house-price chart by bedroom count, showing quarterly medians from 2018 to 2022.

Bar chart of San Francisco two-plus-bedroom house sales by price and bedroom count over six months through January 2023.

Chart of San Francisco luxury house sales by district and price range, with District 5 and District 7 showing the most sales.

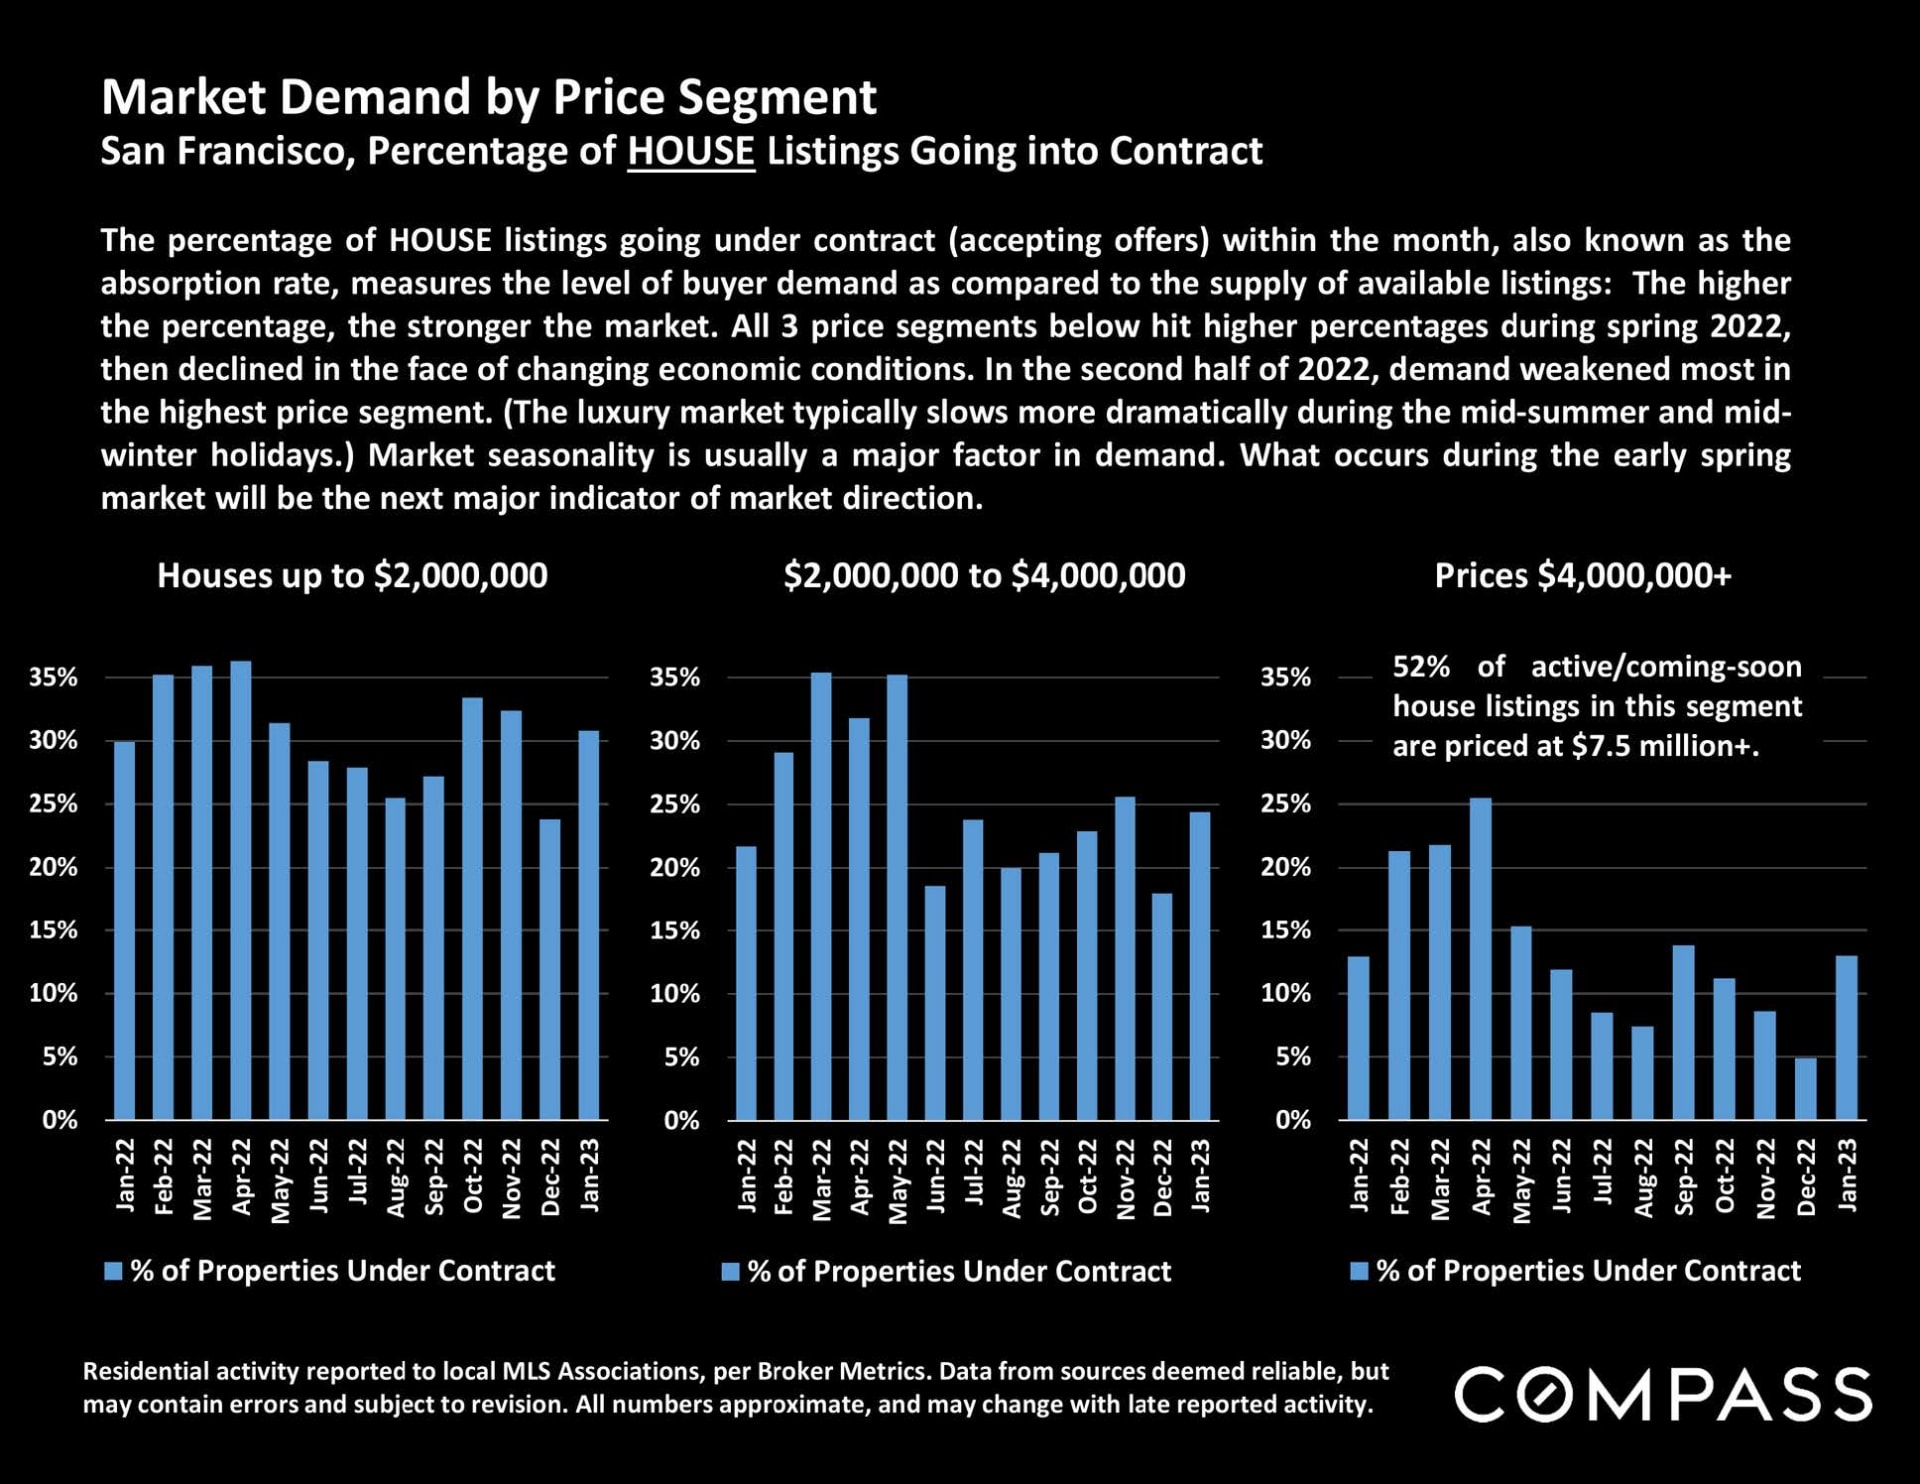
San Francisco home market demand chart comparing monthly contract rates across three price ranges, January 2022 to January 2023.

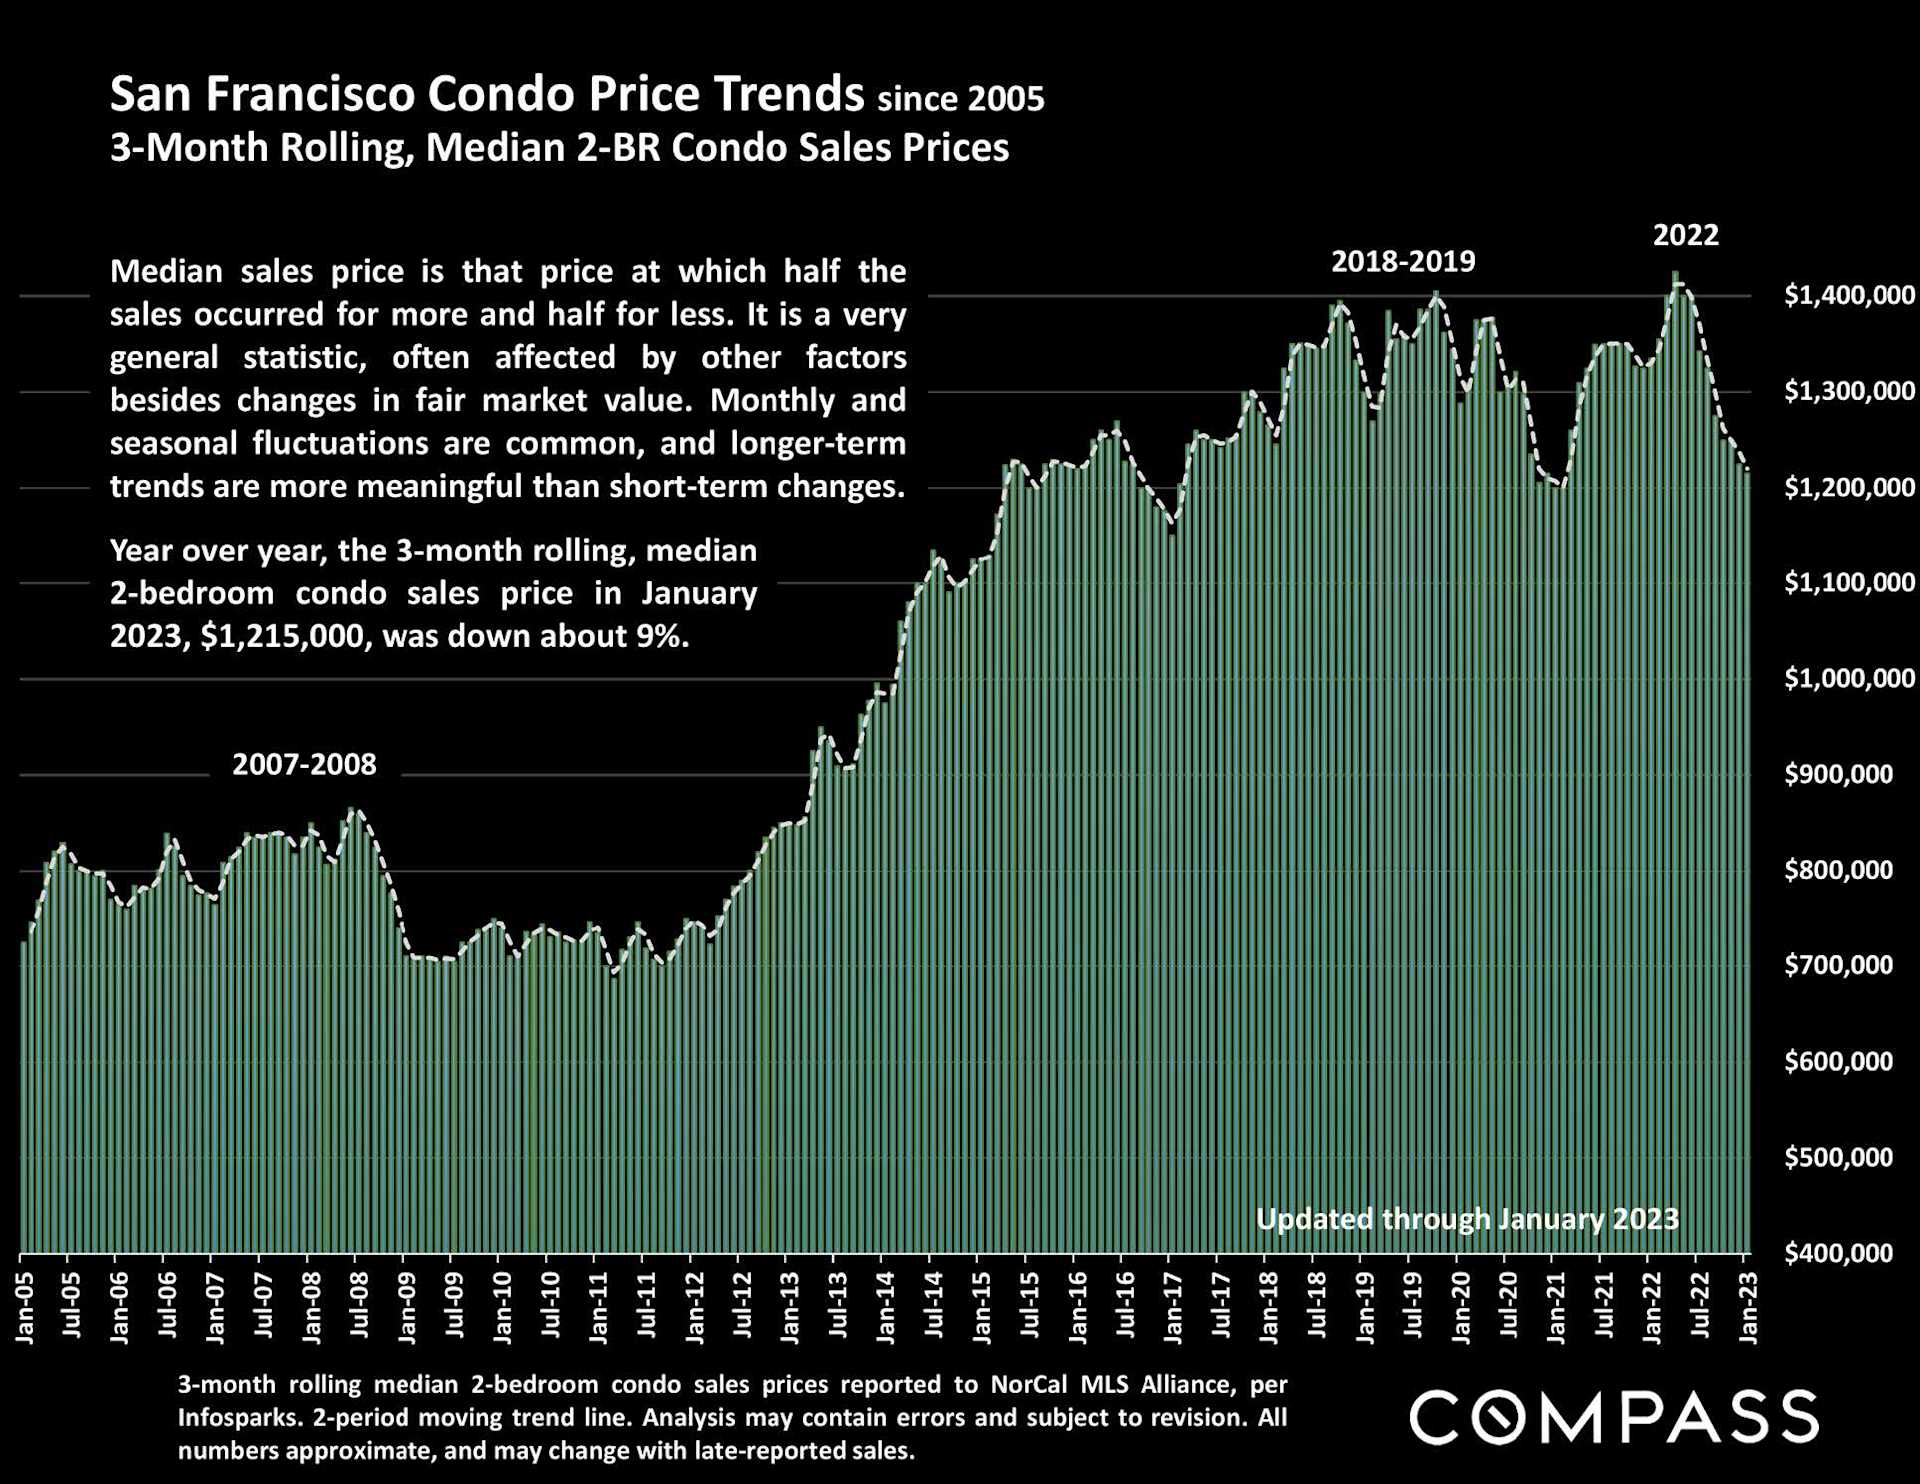
Chart of San Francisco two-bedroom condo prices, peaking above $1.4 million in 2022 before declining in January 2023.

San Francisco condo price table comparing median prices by bedroom count across selected districts.

Chart of San Francisco condo prices by bedroom count, showing quarterly median prices from 2018 to 2022 and Q4 declines.

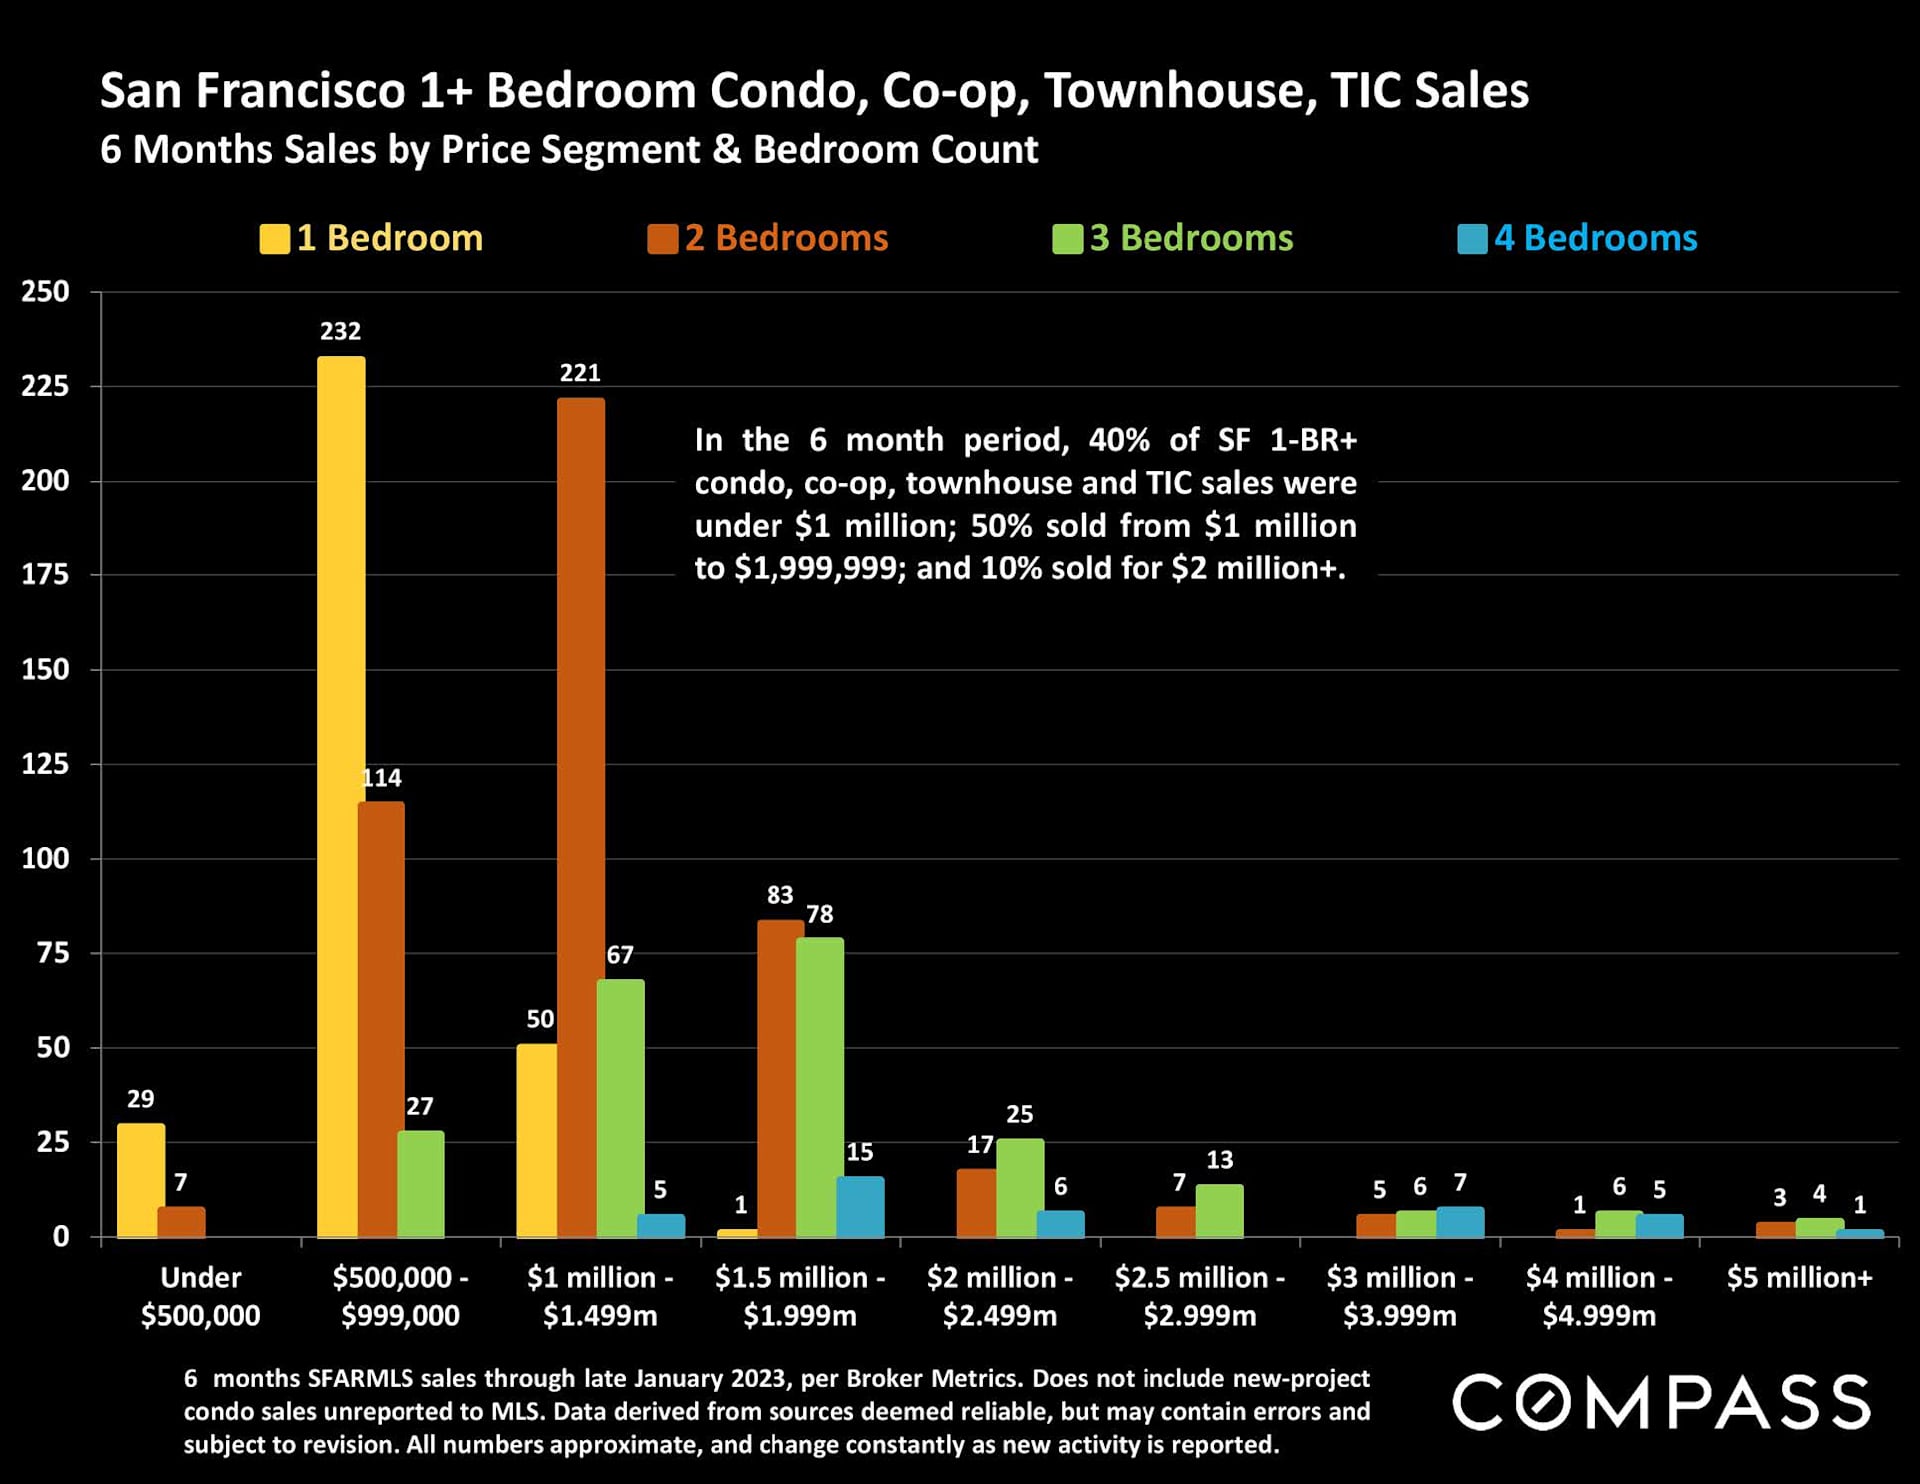
Chart of six-month San Francisco home sales by price range and bedroom count, through late January 2023.

Chart of San Francisco luxury condo, co-op, and TIC sales by district and price segment.

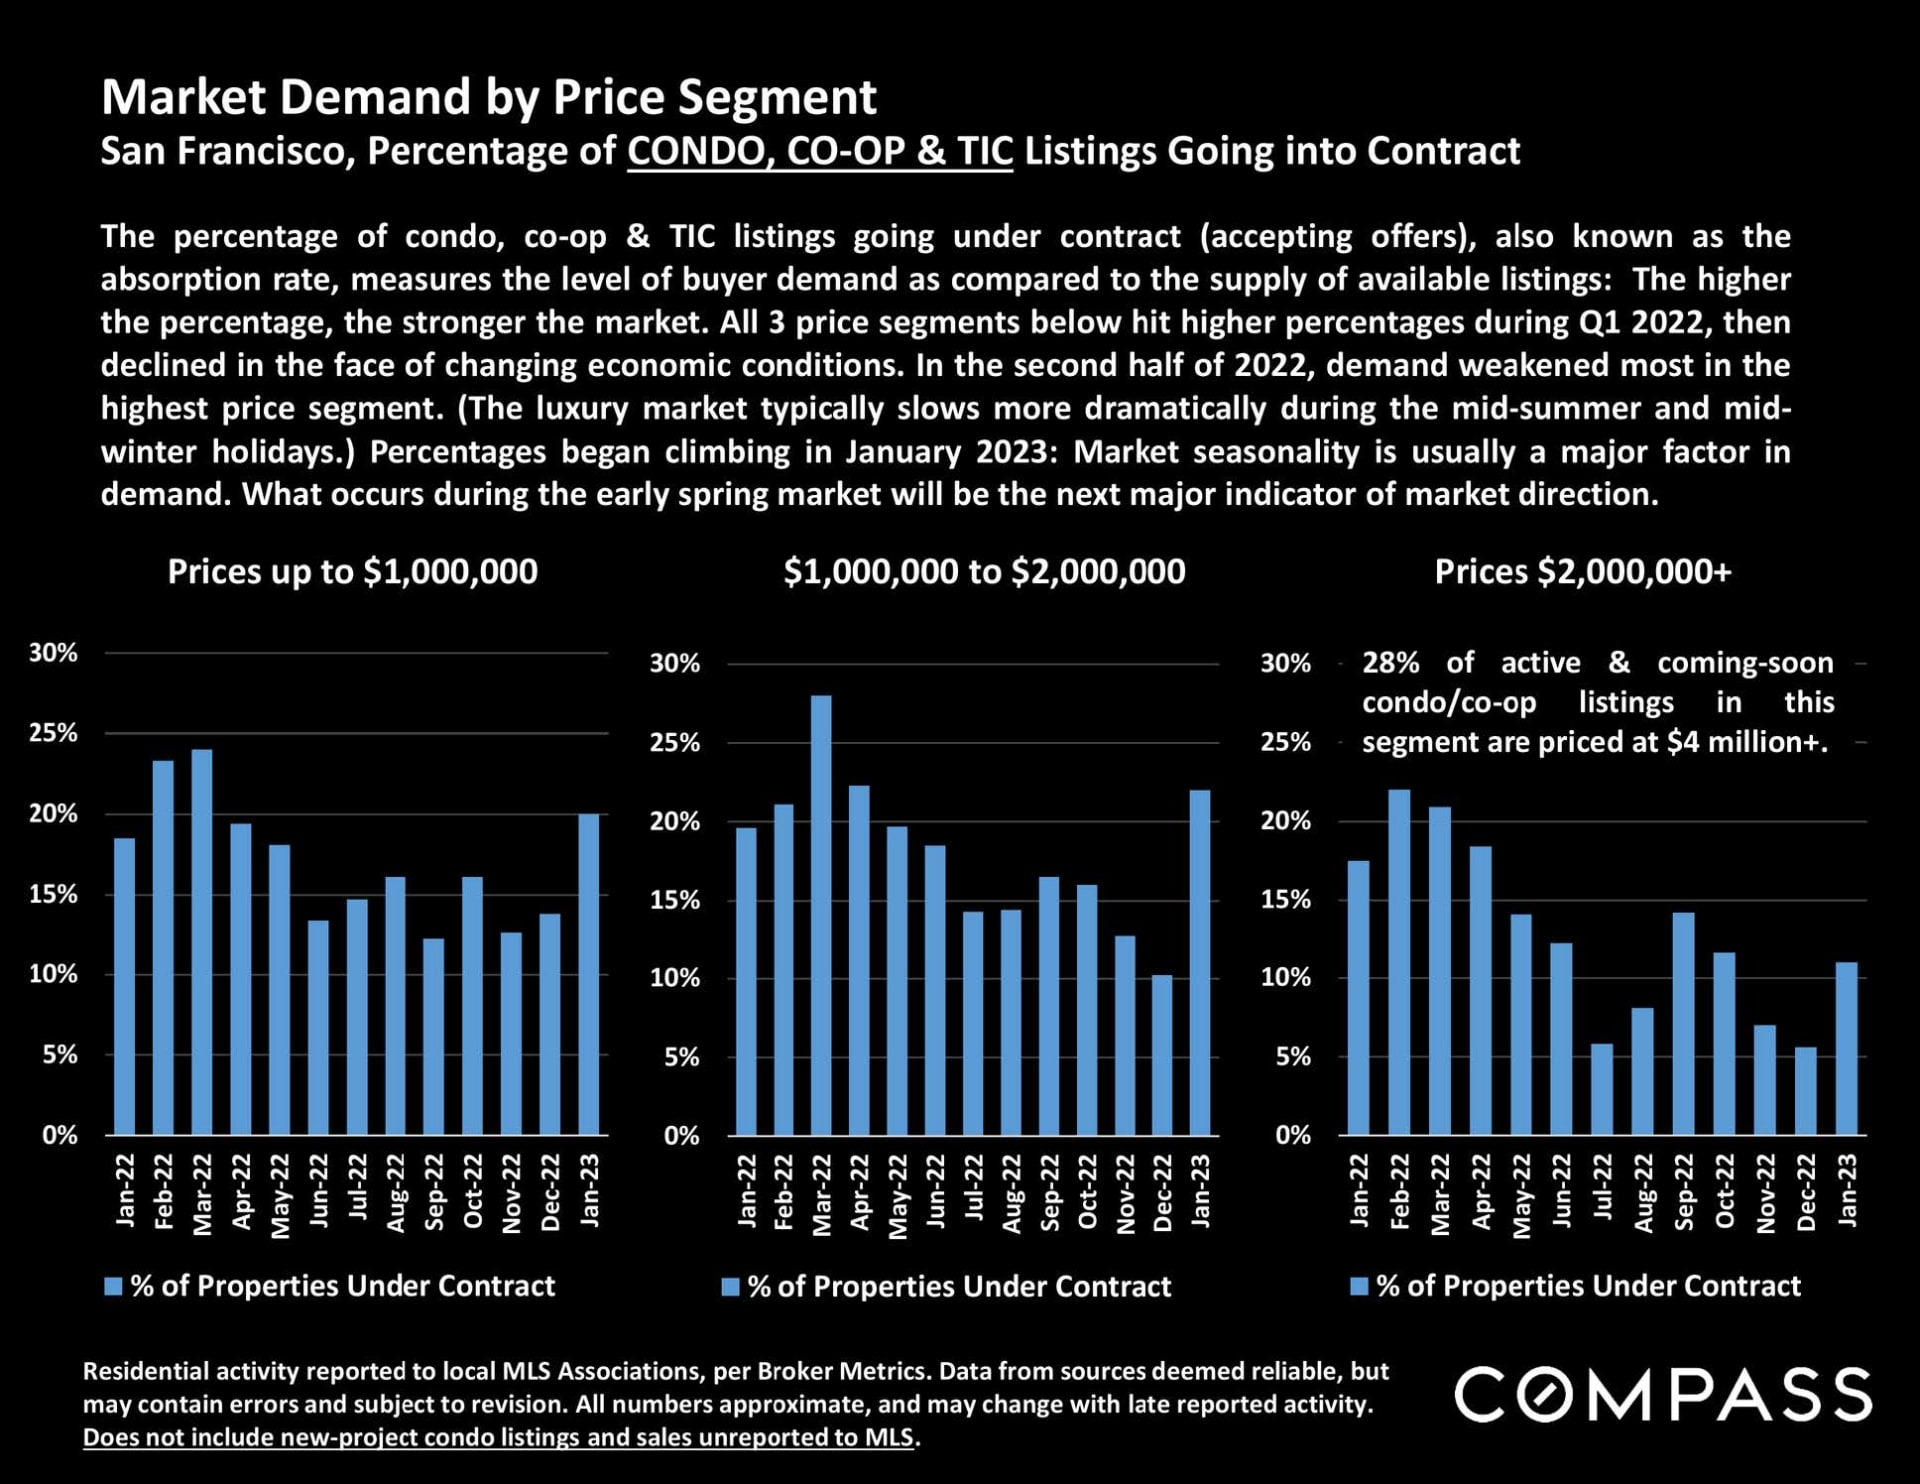
San Francisco market-demand infographic charts contract rates by price segment from January 2022 to January 2023.

Chart of San Francisco new listings from 2018 to 2023, with recurring seasonal peaks and a pandemic annotation.

Bar chart of San Francisco home listings, showing monthly inventory from February 2022 to February 2023.

Bar chart of San Francisco active listings from January 2018 through January 2023, with seasonal trends and a 2020 supply surge.

Chart of San Francisco listings accepting offers from 2019 to 2023, showing spring peaks and a sharp decline in late 2022.

Chart of San Francisco monthly home sales, January 2019–January 2023, with January 2023 the lowest since 2009.

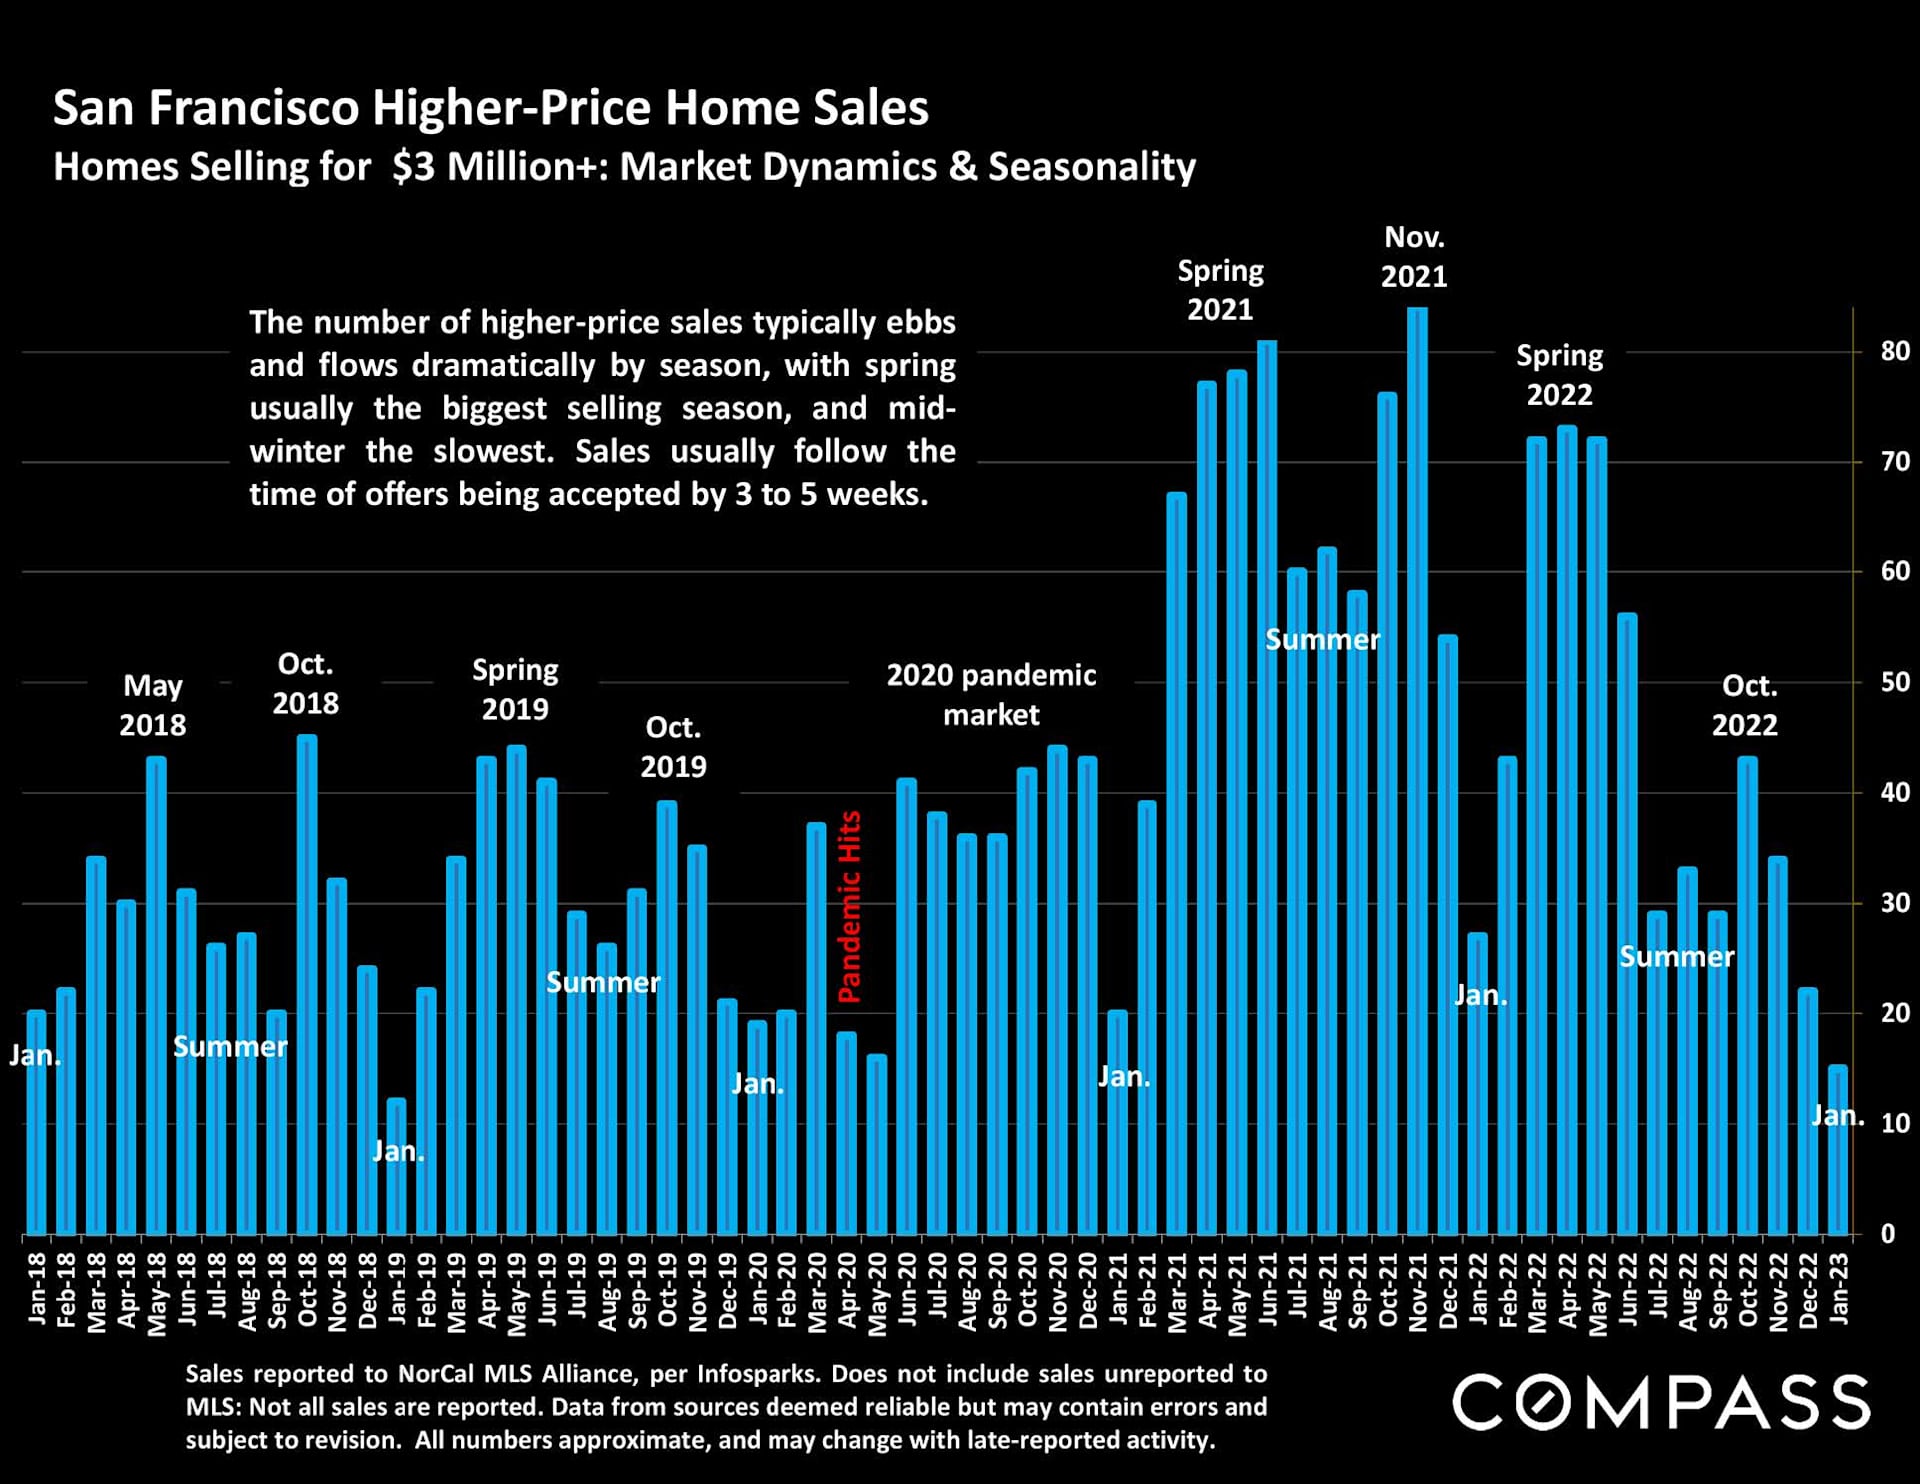
Bar chart of San Francisco home sales over $3 million, with monthly figures from 2018 to early 2023 and seasonal peaks.

Chart of Bay Area $5 million-plus home sales, showing monthly totals from January 2021 through January 2023.

Bar chart of San Francisco listings withdrawn without sale, peaking near 400 in December 2022.

Chart of San Francisco active-listing price reductions, with red monthly bars and October peaks from 2018 to 2022.

Chart of San Francisco home sales closing over list price, falling from 73% in April 2022 to 31%.

Chart of San Francisco house and condo sale prices versus list price, January 2019–January 2023.

San Francisco sold-listing days-on-market chart comparing houses and condos from 2019 to January 2023.

San Francisco Bay Area population and migration infographic with a satellite map and a link to the full report.

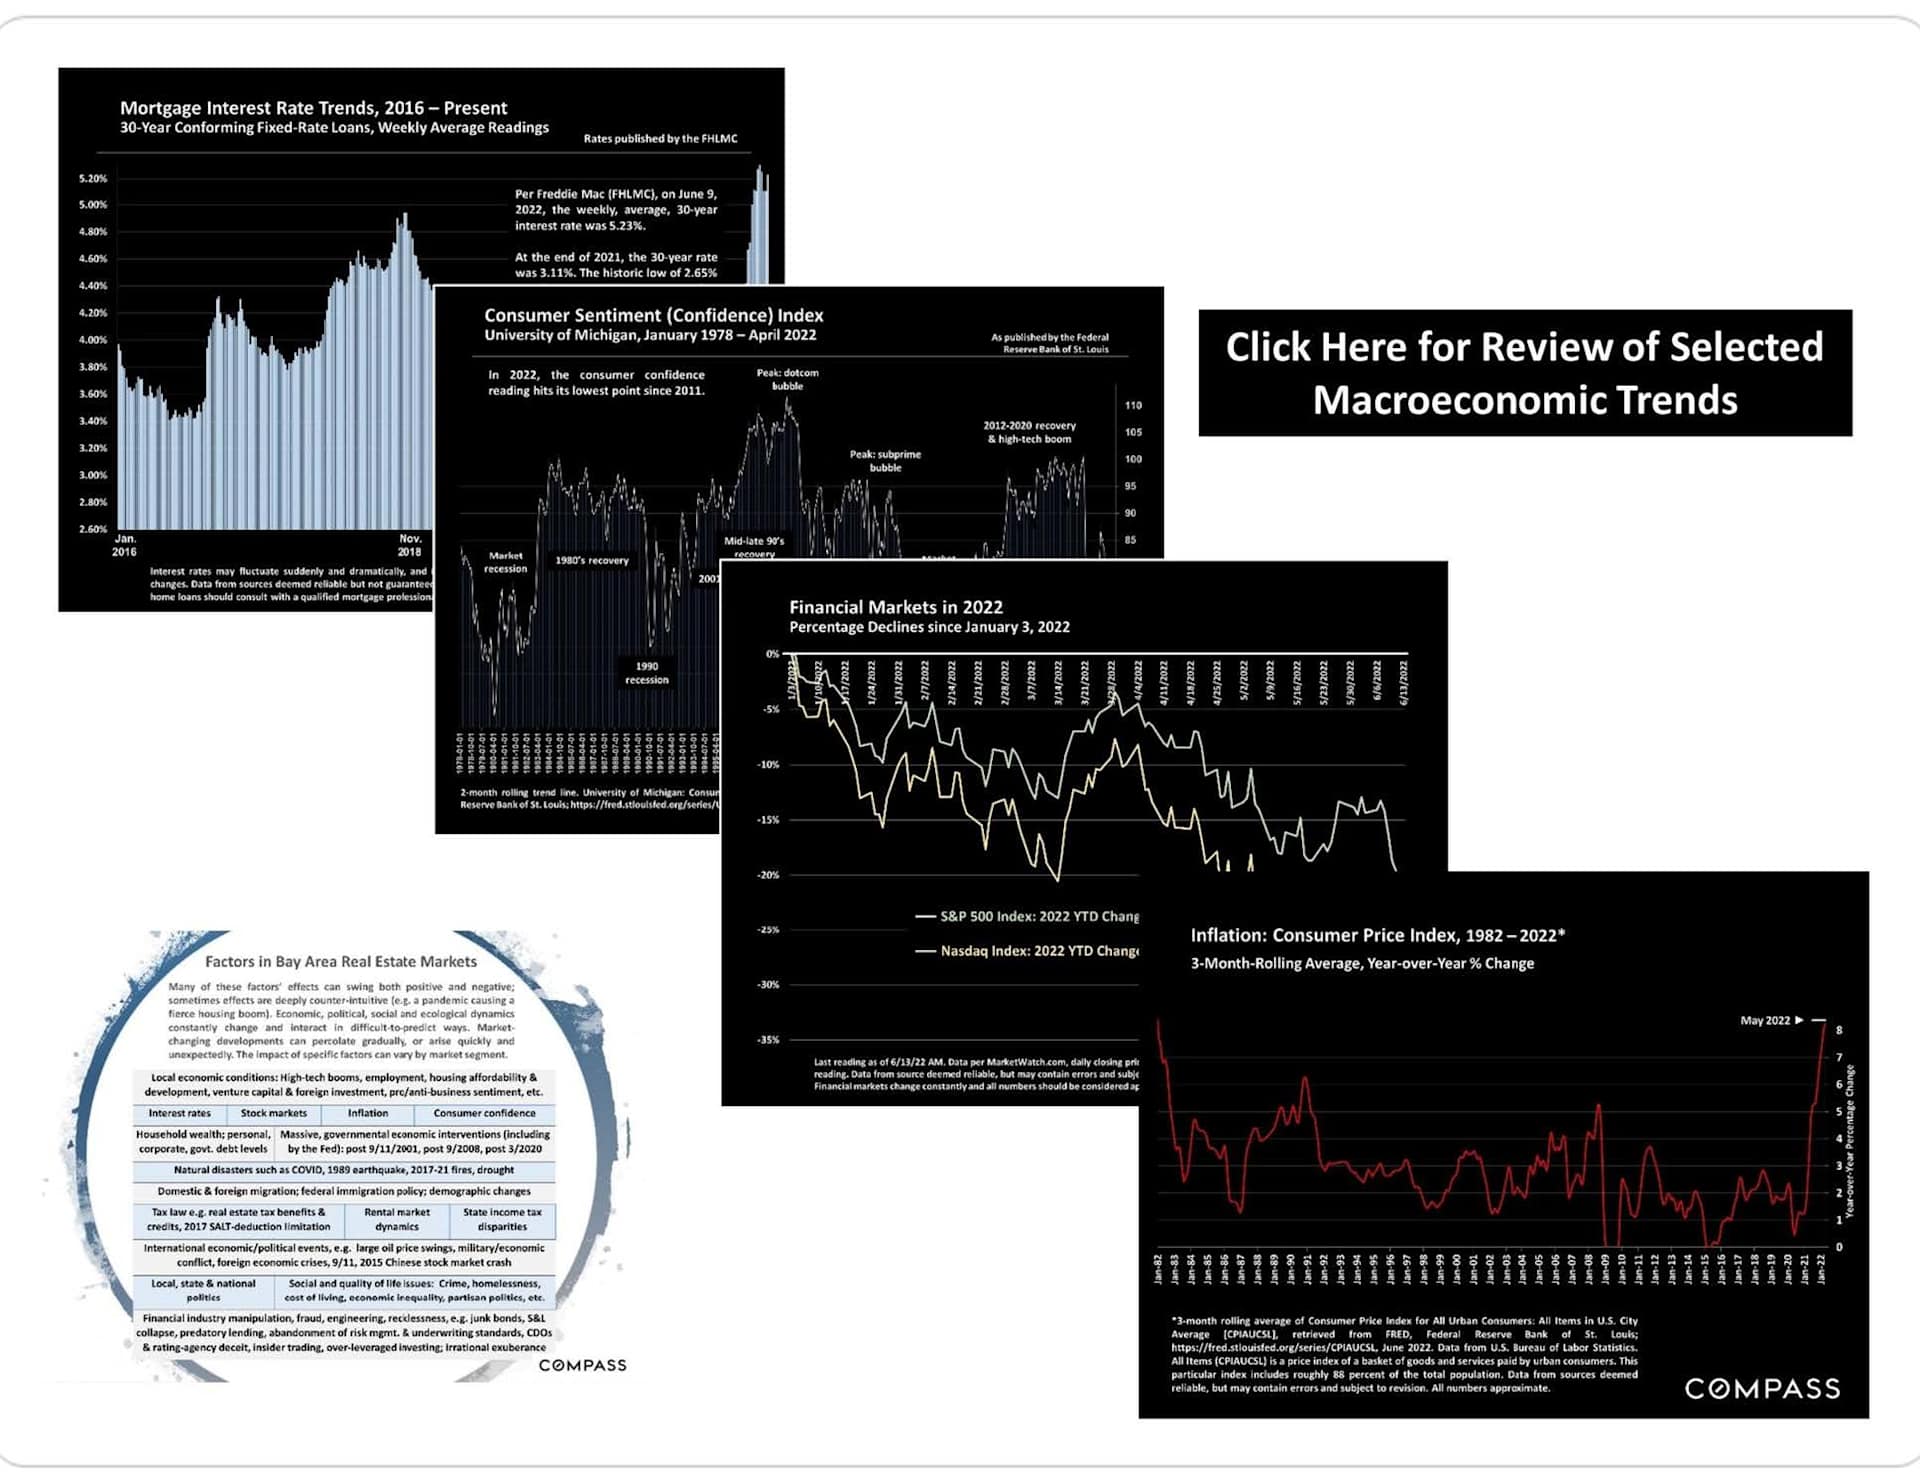
Economic charts on mortgage rates, consumer confidence, financial markets, inflation, and factors in Bay Area real estate markets.

Chart of San Francisco median house prices, 1993–2022, with historical market annotations.

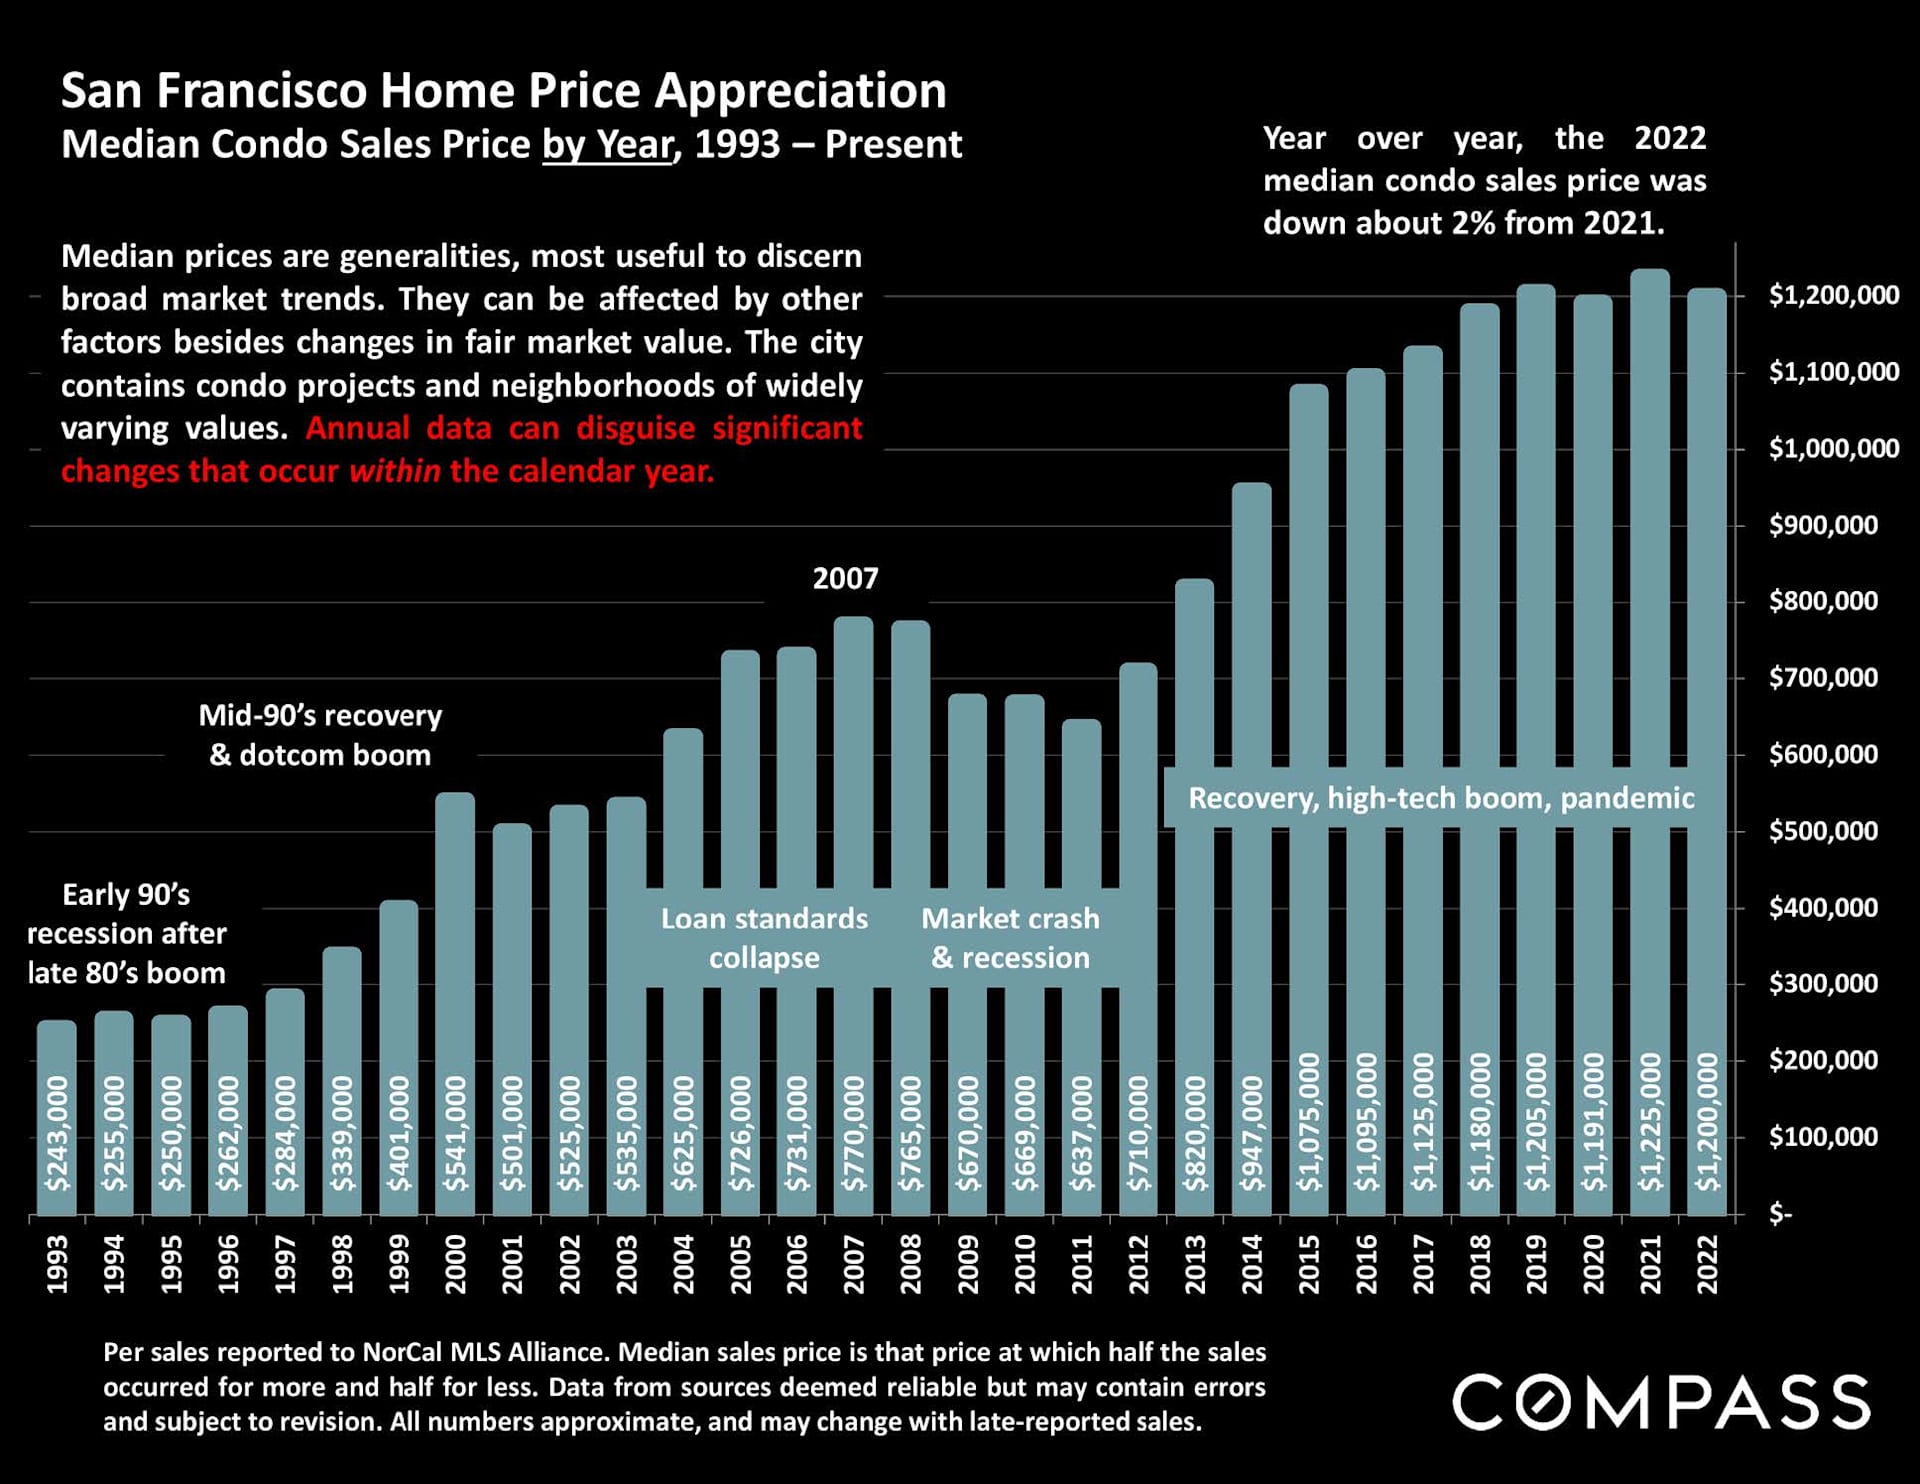
Bar chart of San Francisco median condo prices, 1993–2022, peaking at $1.225 million in 2021.

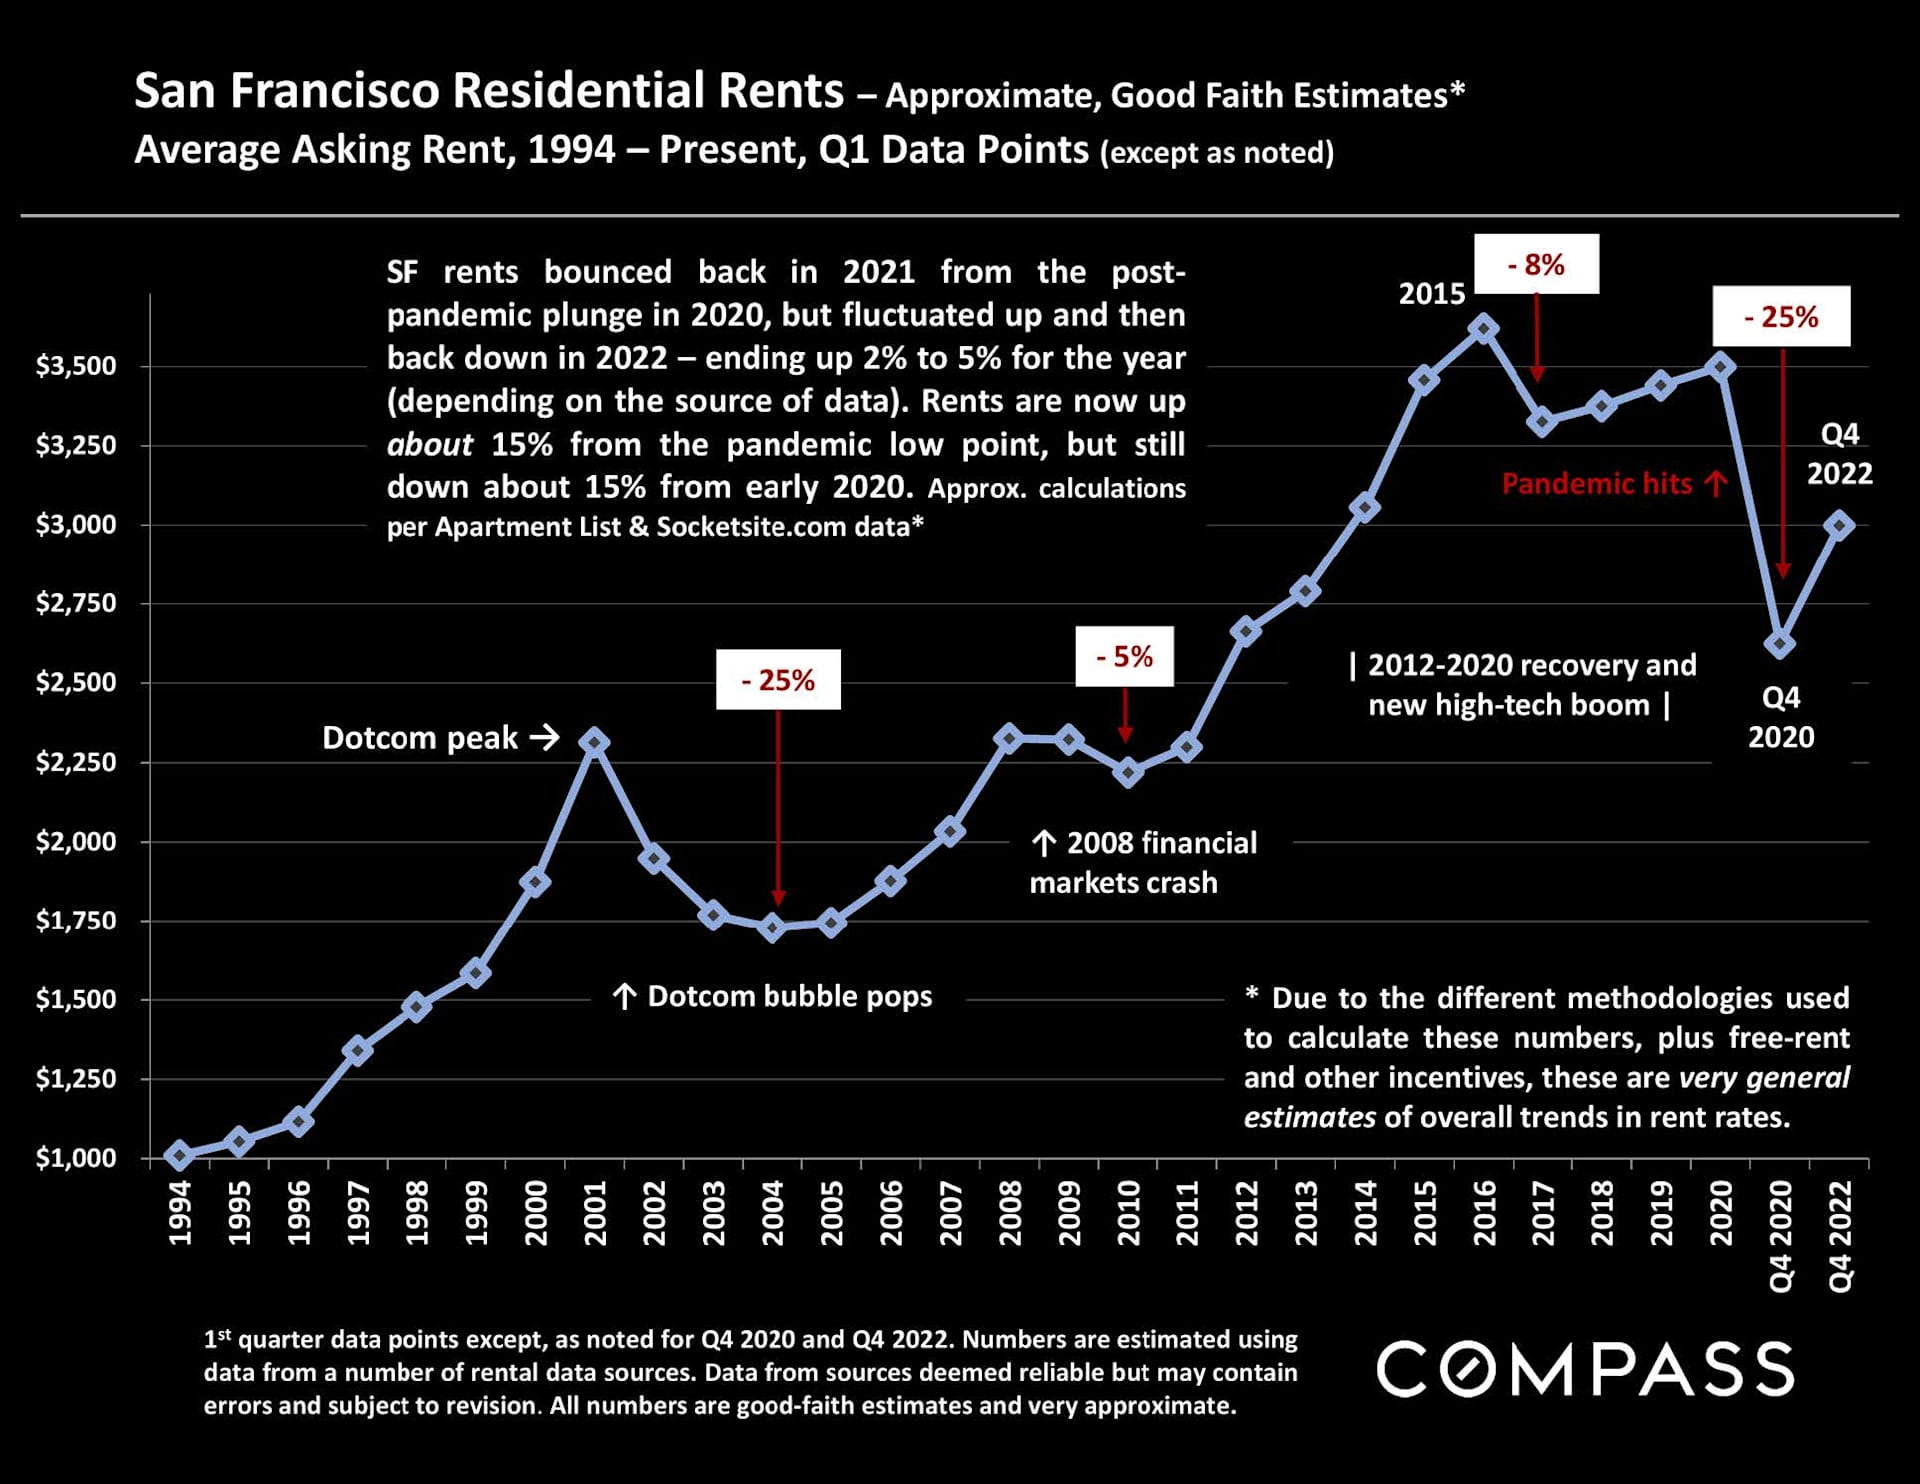
Chart of San Francisco residential rents from 1994 to 2022, showing a sharp 2020 decline and partial recovery.

Chart of San Francisco home sales volumes, showing a 2021 peak and a roughly 26% decline in 2022.

Pie chart comparing 2022 San Francisco home sales by property type; condos outnumber houses.

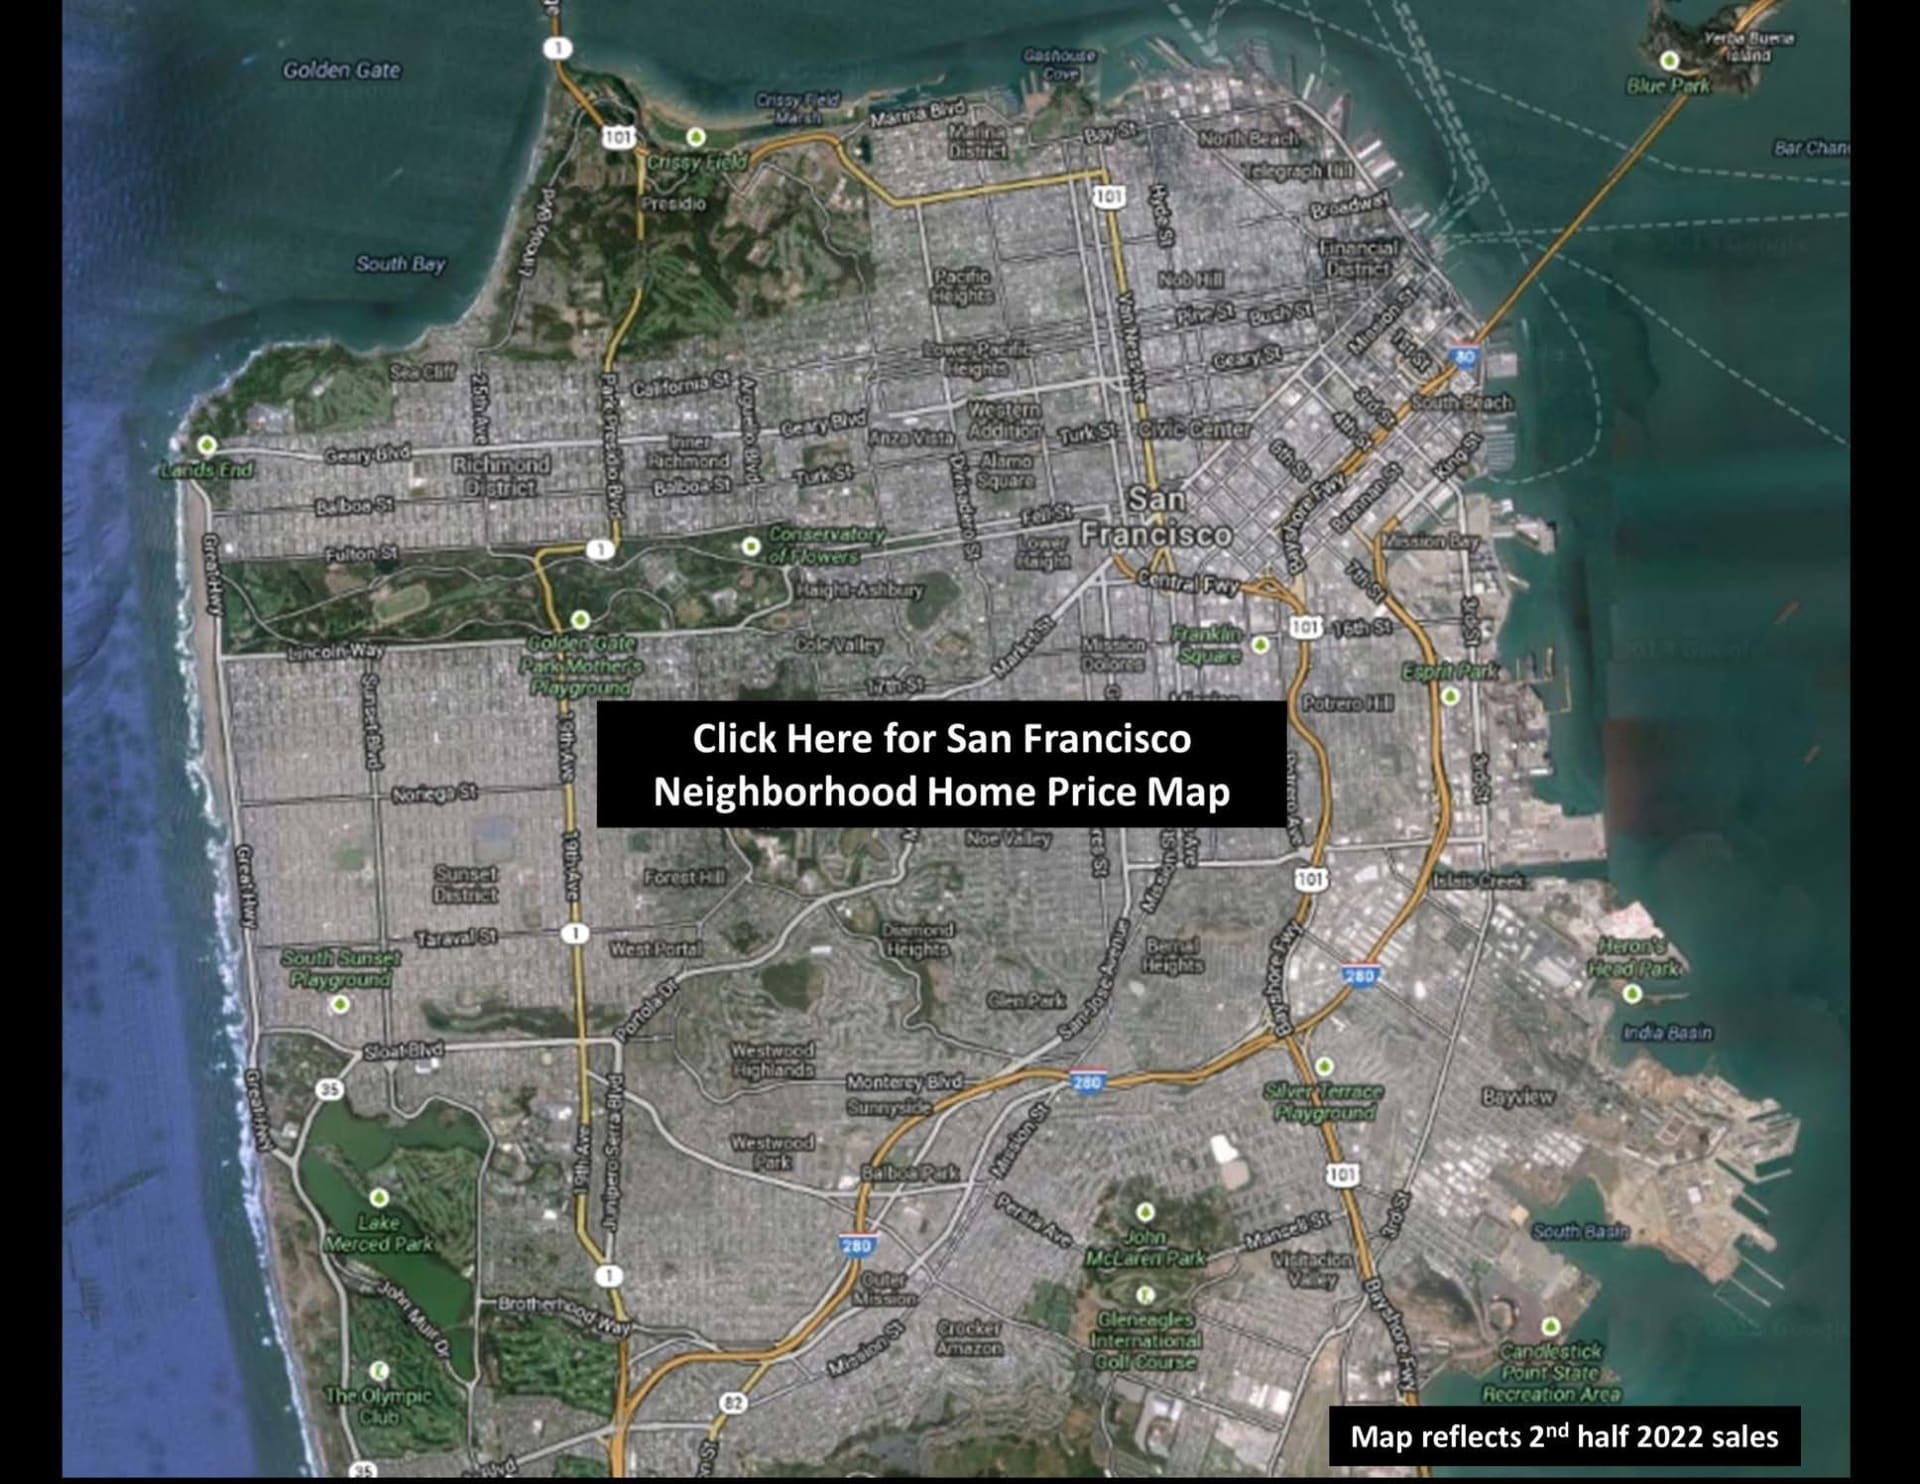
Map of San Francisco neighborhoods with a home price map link; reflects second-half 2022 sales.

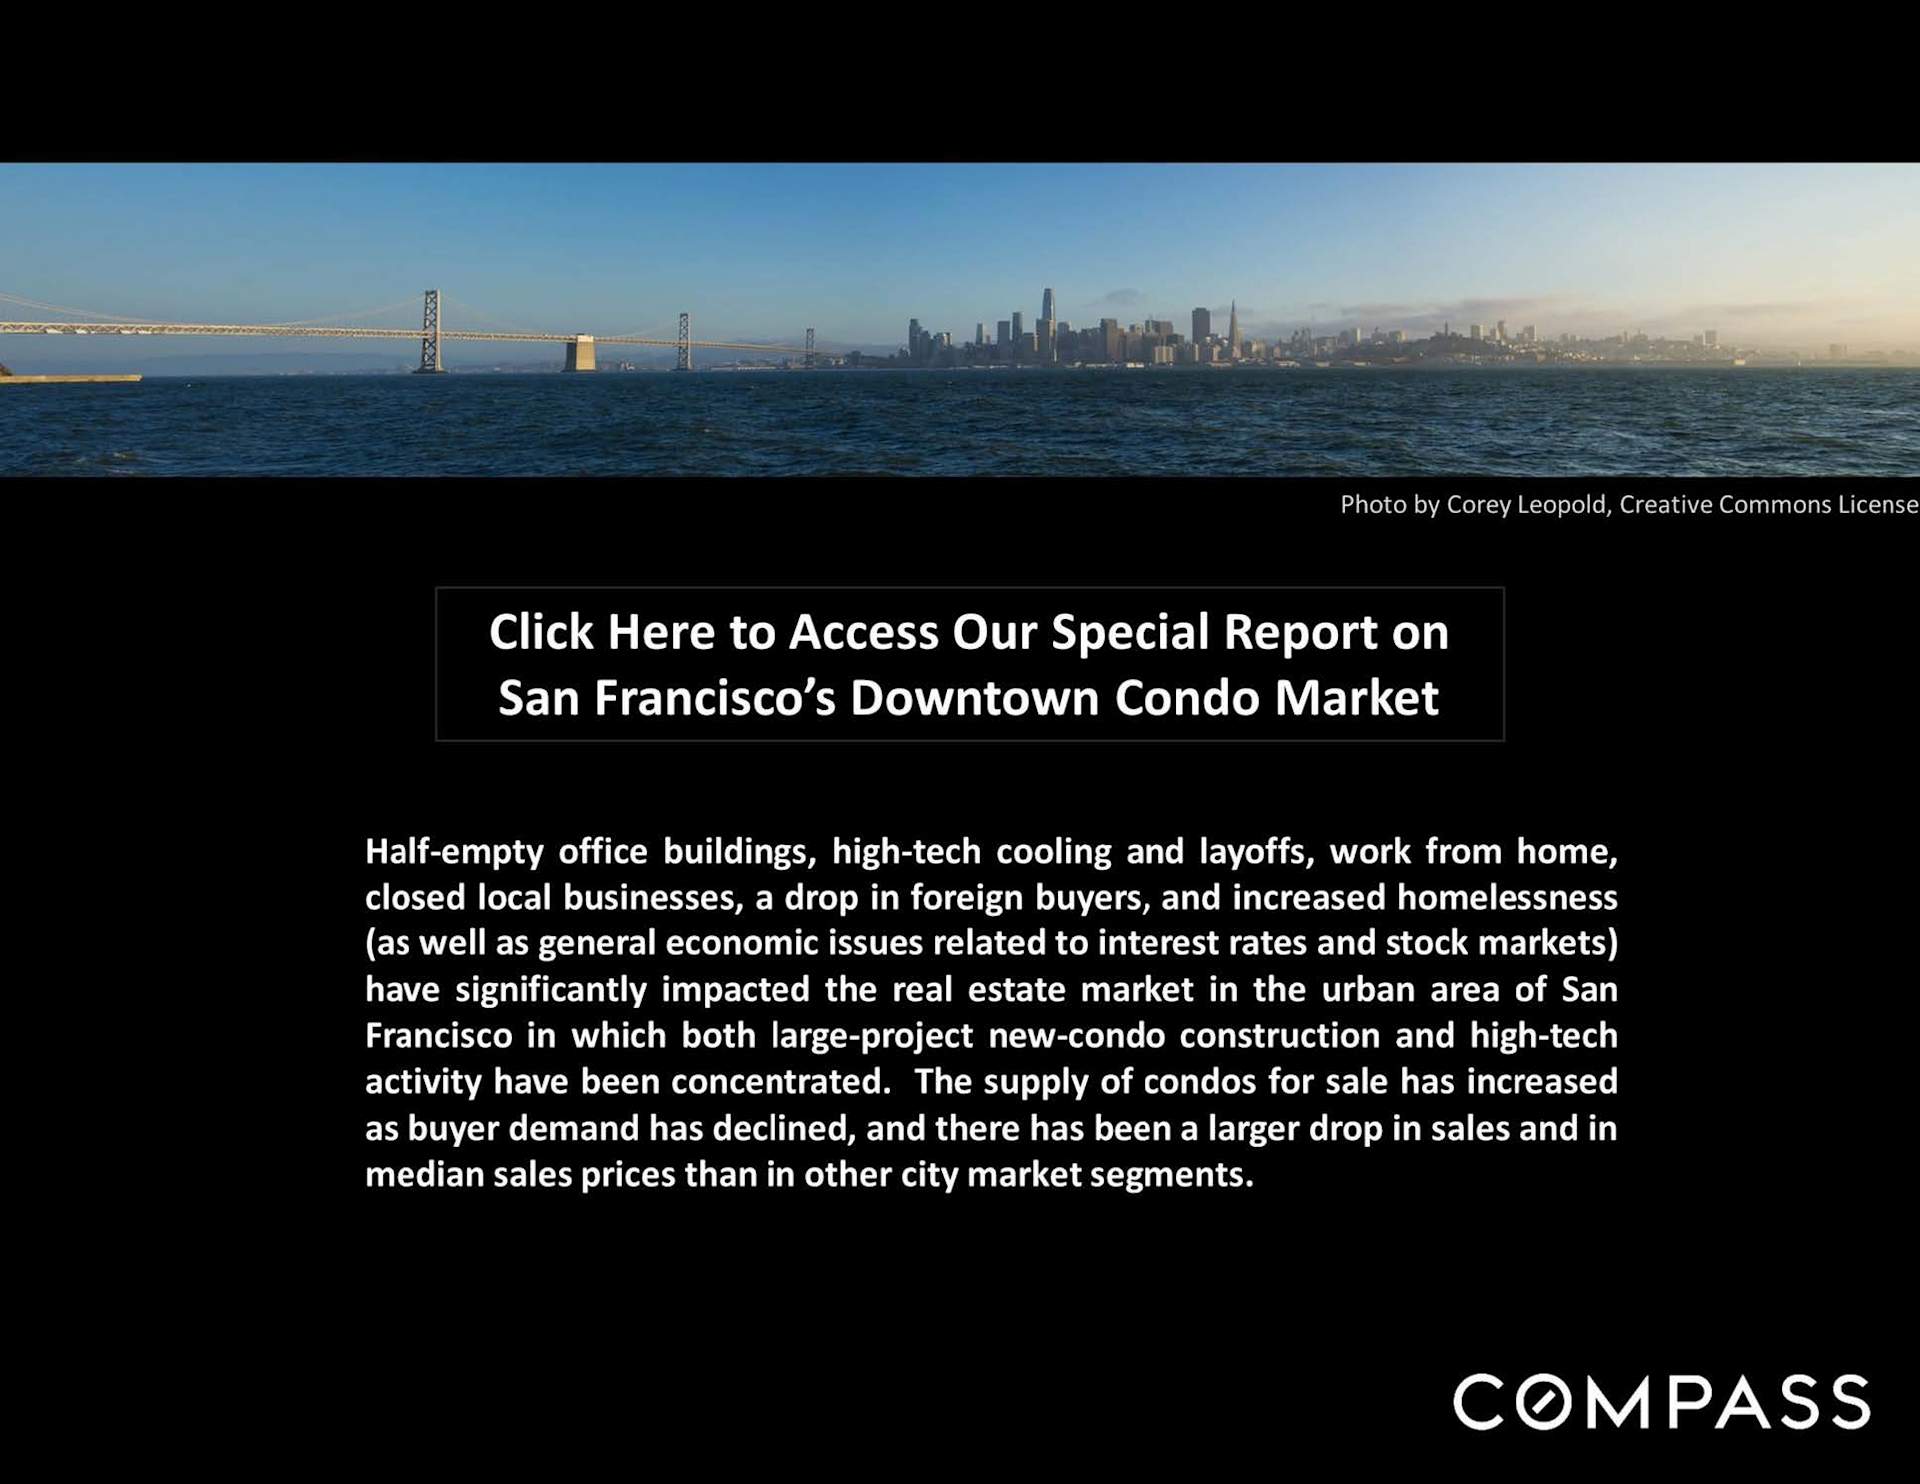
San Francisco skyline and Bay Bridge above a market update on downtown condo supply, demand, sales, and prices.

San Francisco Bay Area home price appreciation report cover, with a Golden Gate Bridge and regional landscape collage.

Market report notes explain statistical limitations, sales-price and square-foot calculations, and the Compass disclaimer.


Work With Jason

Drawing on his decade of experience in finance, investment management, and holistic financial planning, and as a Chartered Financial Analyst ( CFA ® ) charterholder, he leverages his financial acumen and analytical focus to help his clients navigate the sophisticated San Francisco market.
Contact
Follow Us