San Francisco Real Estate Market Update | December 2022

A review of house and condo prices, appreciation rates, supply and demand, overbidding, time and market, luxury home sales and macroeconomic factors pertinent to the San Francisco real estate market.

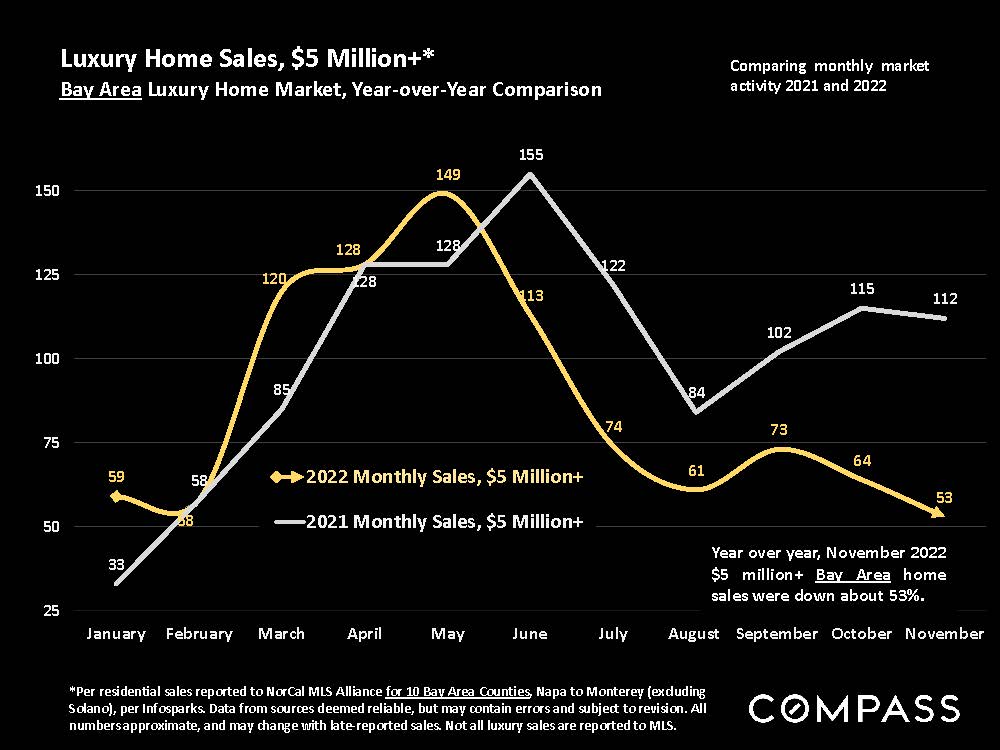
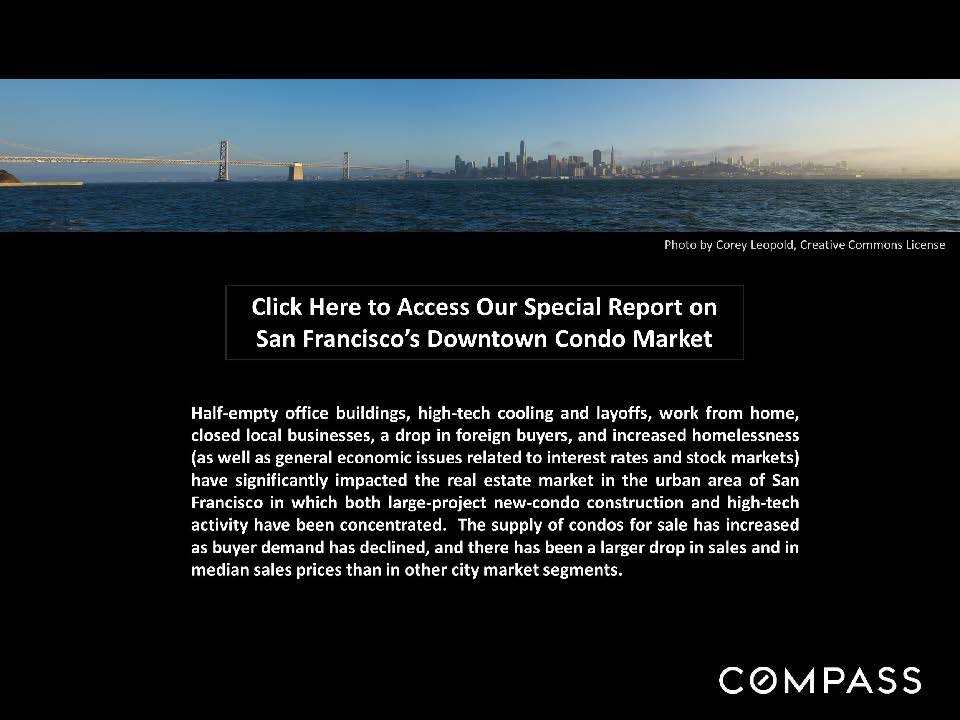
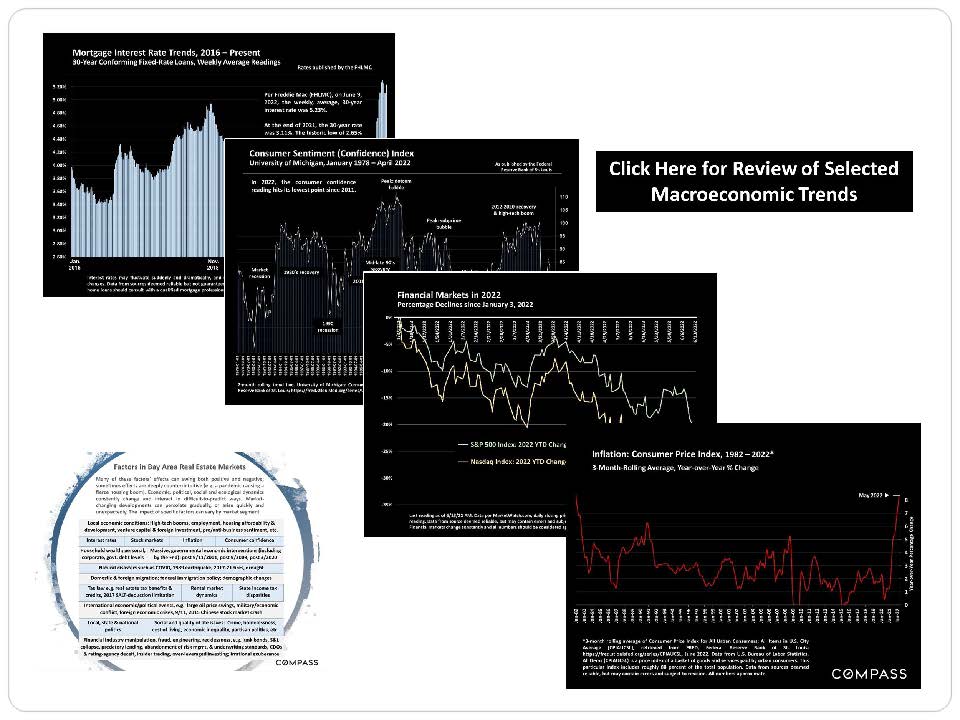
San Francisco Real Estate December 2022 Report, with a satellite map of the Bay Area and San Francisco circled.San Francisco real estate market update discussing 2022 market conditions, December activity, and interest rates.Chart of San Francisco median house prices from 1990 to November 2022, with recession and pandemic annotations.Bar chart of San Francisco annual median house price appreciation rates from 1990 through 2022 year to date.San Francisco house sales pie chart by price segment, August–November 2022, with bedroom-count totals.Chart of San Francisco two-bedroom condo prices since 2005, with November 2022 median at $1.25 million, down about 6% year over year.Chart of San Francisco condo price appreciation rates, with annual changes from 1995 to 2022 and market-cycle annotations.Pie chart of San Francisco condo, co-op, townhouse, and TIC sales by price segment, August–November 2022.Bay Area table comparing large-home sale prices and property details across 11 counties, August–November 2022.Bay Area county home-value chart comparing median prices, square footage, and price per square foot by bedroom and bath count.Infographic comparing Bay Area county home values for condos and townhouses, with San Francisco’s condo figures highlighted.Bar chart tracks monthly San Francisco home sales, 2019–2022, highlighting seasonal swings and a 45% November decline.Chart of San Francisco $3 million-plus home sales, January 2018–November 2022, with November 2022 sales down 55% year over year.Chart comparing monthly Bay Area luxury home sales over $5 million in 2021 and 2022.Chart of all-cash California home purchases, 1998–2022; the share peaked at 30% in 2012 and was 22% in 2022.San Francisco housing supply by construction era: 44%, 18%, 15%, 10%, and 13% across five periods.Chart comparing San Francisco median house sizes by construction era, from 1,424 square feet in 1940–1959 to 2,957 after 2000.Chart of San Francisco home sales over list price, 2018–2022, with November 2022 at 44%.Chart of San Francisco house and condo sale prices versus list prices, with both trends falling in 2022.Chart comparing average days on market for San Francisco condos and houses, January 2019–November 2022.Chart of San Francisco new listings from 2018–2022, showing seasonal peaks and a decline in 2022.Chart of San Francisco listings accepting offers, showing seasonal patterns from 2019 to 2022 and pandemic-era changes.San Francisco active and coming-soon listings chart, February–December 2022, peaking at 1,558 in October.Bar chart tracks San Francisco active listings, peaking in October 2020 before rising again in 2022.Chart of San Francisco active-listing price reductions from 2018 to 2022, with October peaks and a pandemic annotation.San Francisco neighborhood home sales statistics table for summer–fall 2022, comparing prices, sales, and market times.San Francisco neighborhood condo sales statistics for two-bedroom, two-bath condos, summer–fall 2022.San Francisco market update graphic with a panoramic skyline, downtown condo market report link, and market summary.Economic chart collage showing mortgage rates, consumer sentiment, 2022 market performance, inflation, and Bay Area real estate factors.San Francisco Bay Area real estate survey graphic with the Golden Gate Bridge and a prompt to access the full report.Real estate market report notes and Compass disclaimers explain statistics, median sales price, and price per square foot.

Work With Jason

Drawing on his decade of experience in finance, investment management, and holistic financial planning, and as a Chartered Financial Analyst ( CFA ® ) charterholder, he leverages his financial acumen and analytical focus to help his clients navigate the sophisticated San Francisco market.
Contact
Follow Us