San Francisco Real Estate Market Update | August 2023

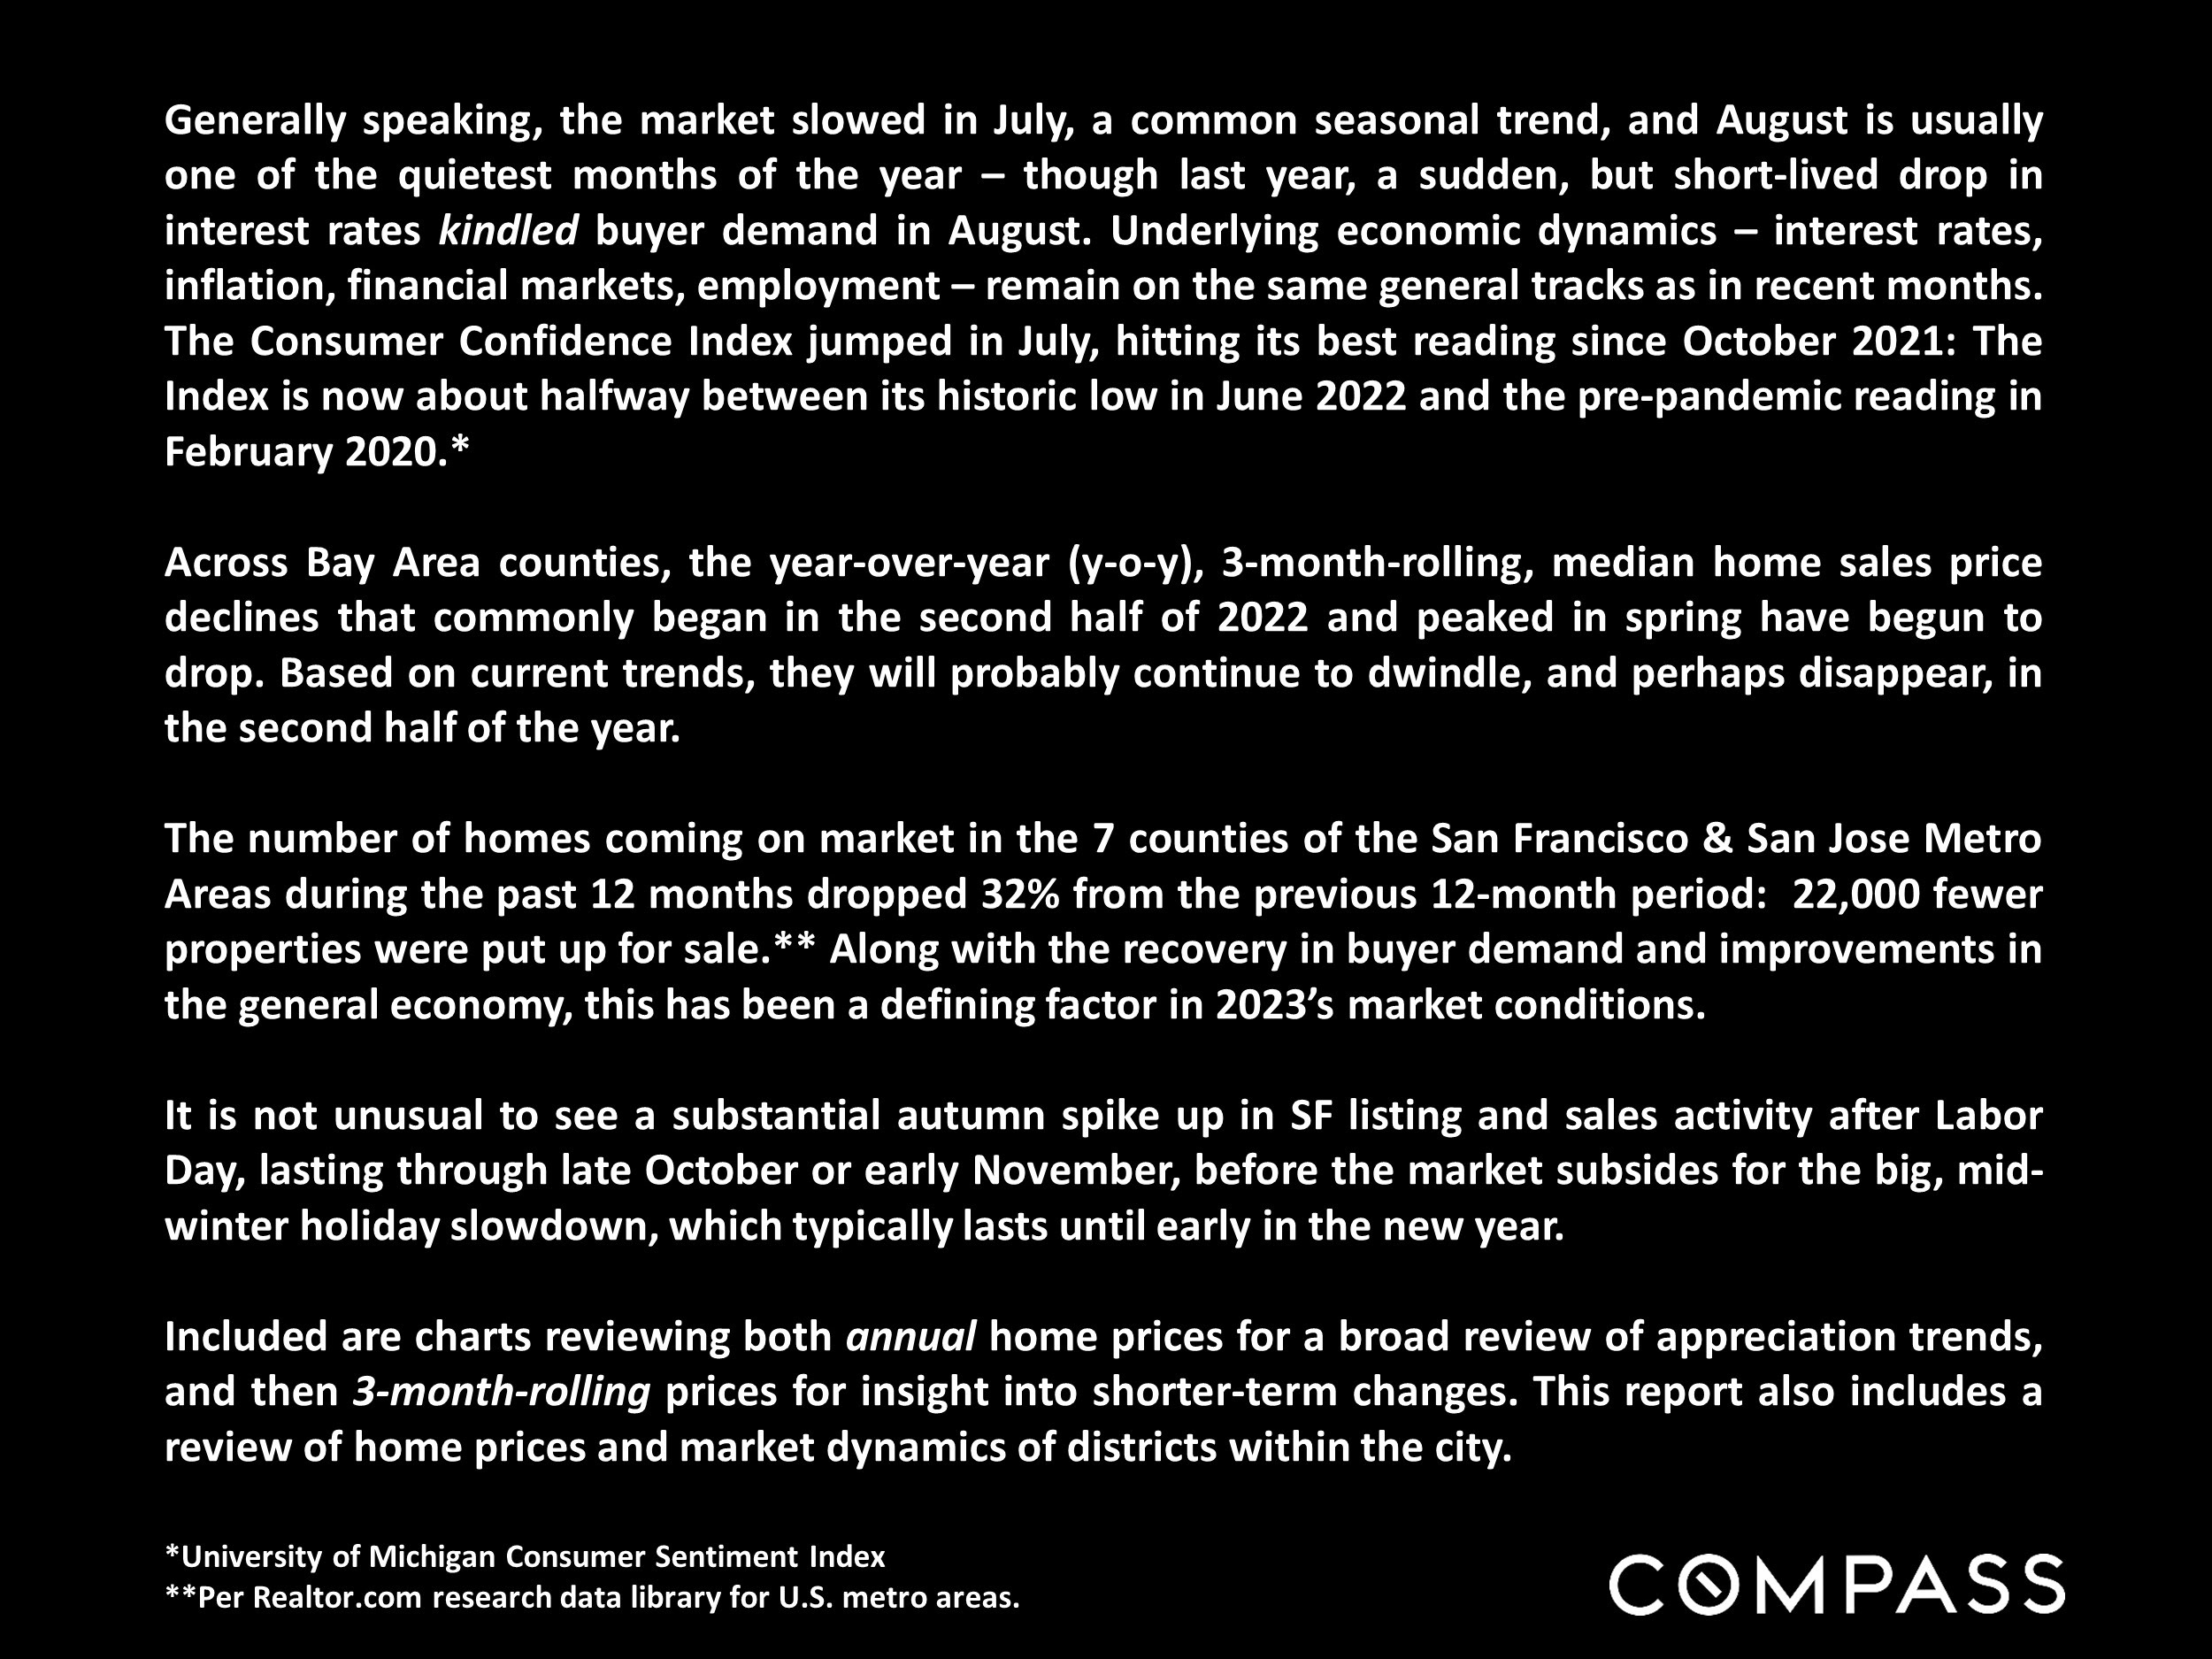
Generally speaking, the market slowed in July, a common seasonal trend, and August is usually one of the quietest months of the year - though last year, a sudden, but short-lived drop in interest rates kindled buyer demand in August. Underlying economic dynamics - interest rates, inflation, financial markets, employment - remain on the same general tracks as in recent months. The Consumer Confidence Index jumped in July, hitting its best reading since October 2021: The Index is now about halfway between its historic low in June 2022 and the pre-pandemic reading in February 2020.*

San Francisco real estate market report cover, August 2023.

Text summary of San Francisco and Bay Area real estate market trends, with a Compass wordmark.

San Francisco median house prices, 1993–2023: green bars peak in 2021 and decline through July 2023.

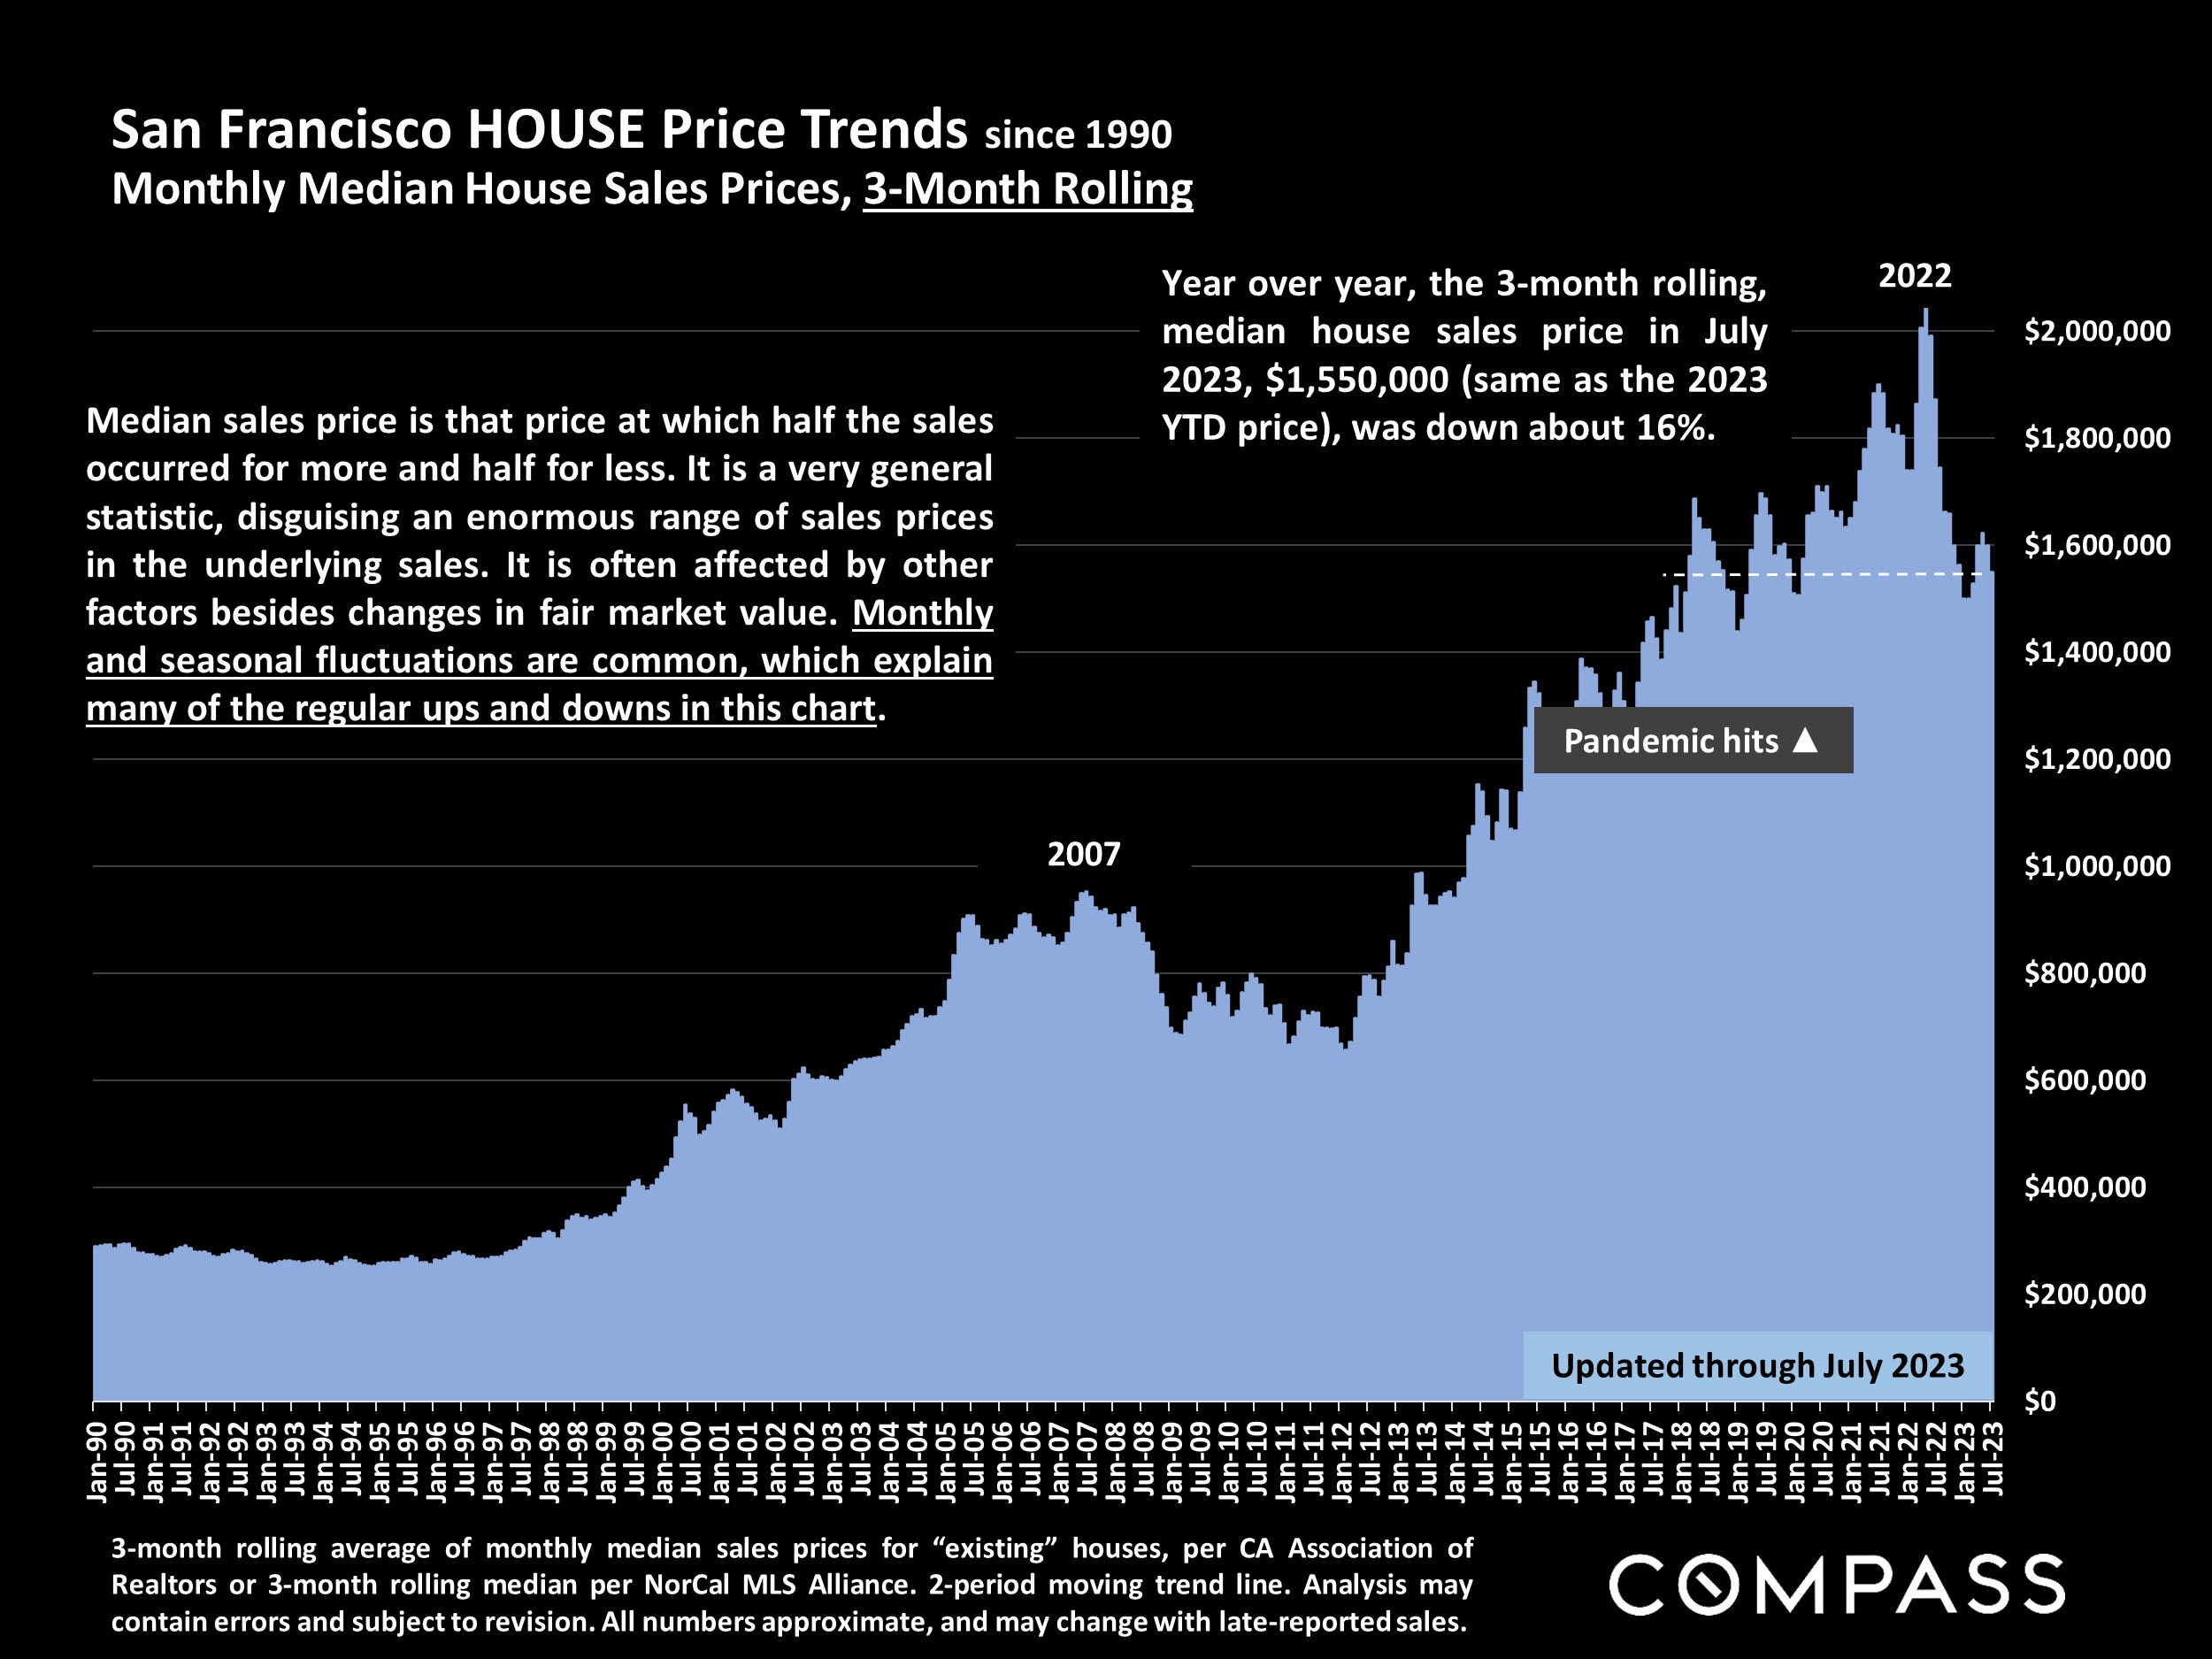
San Francisco median house prices, 1990–2023, peaking above $2 million in 2022 before declining.

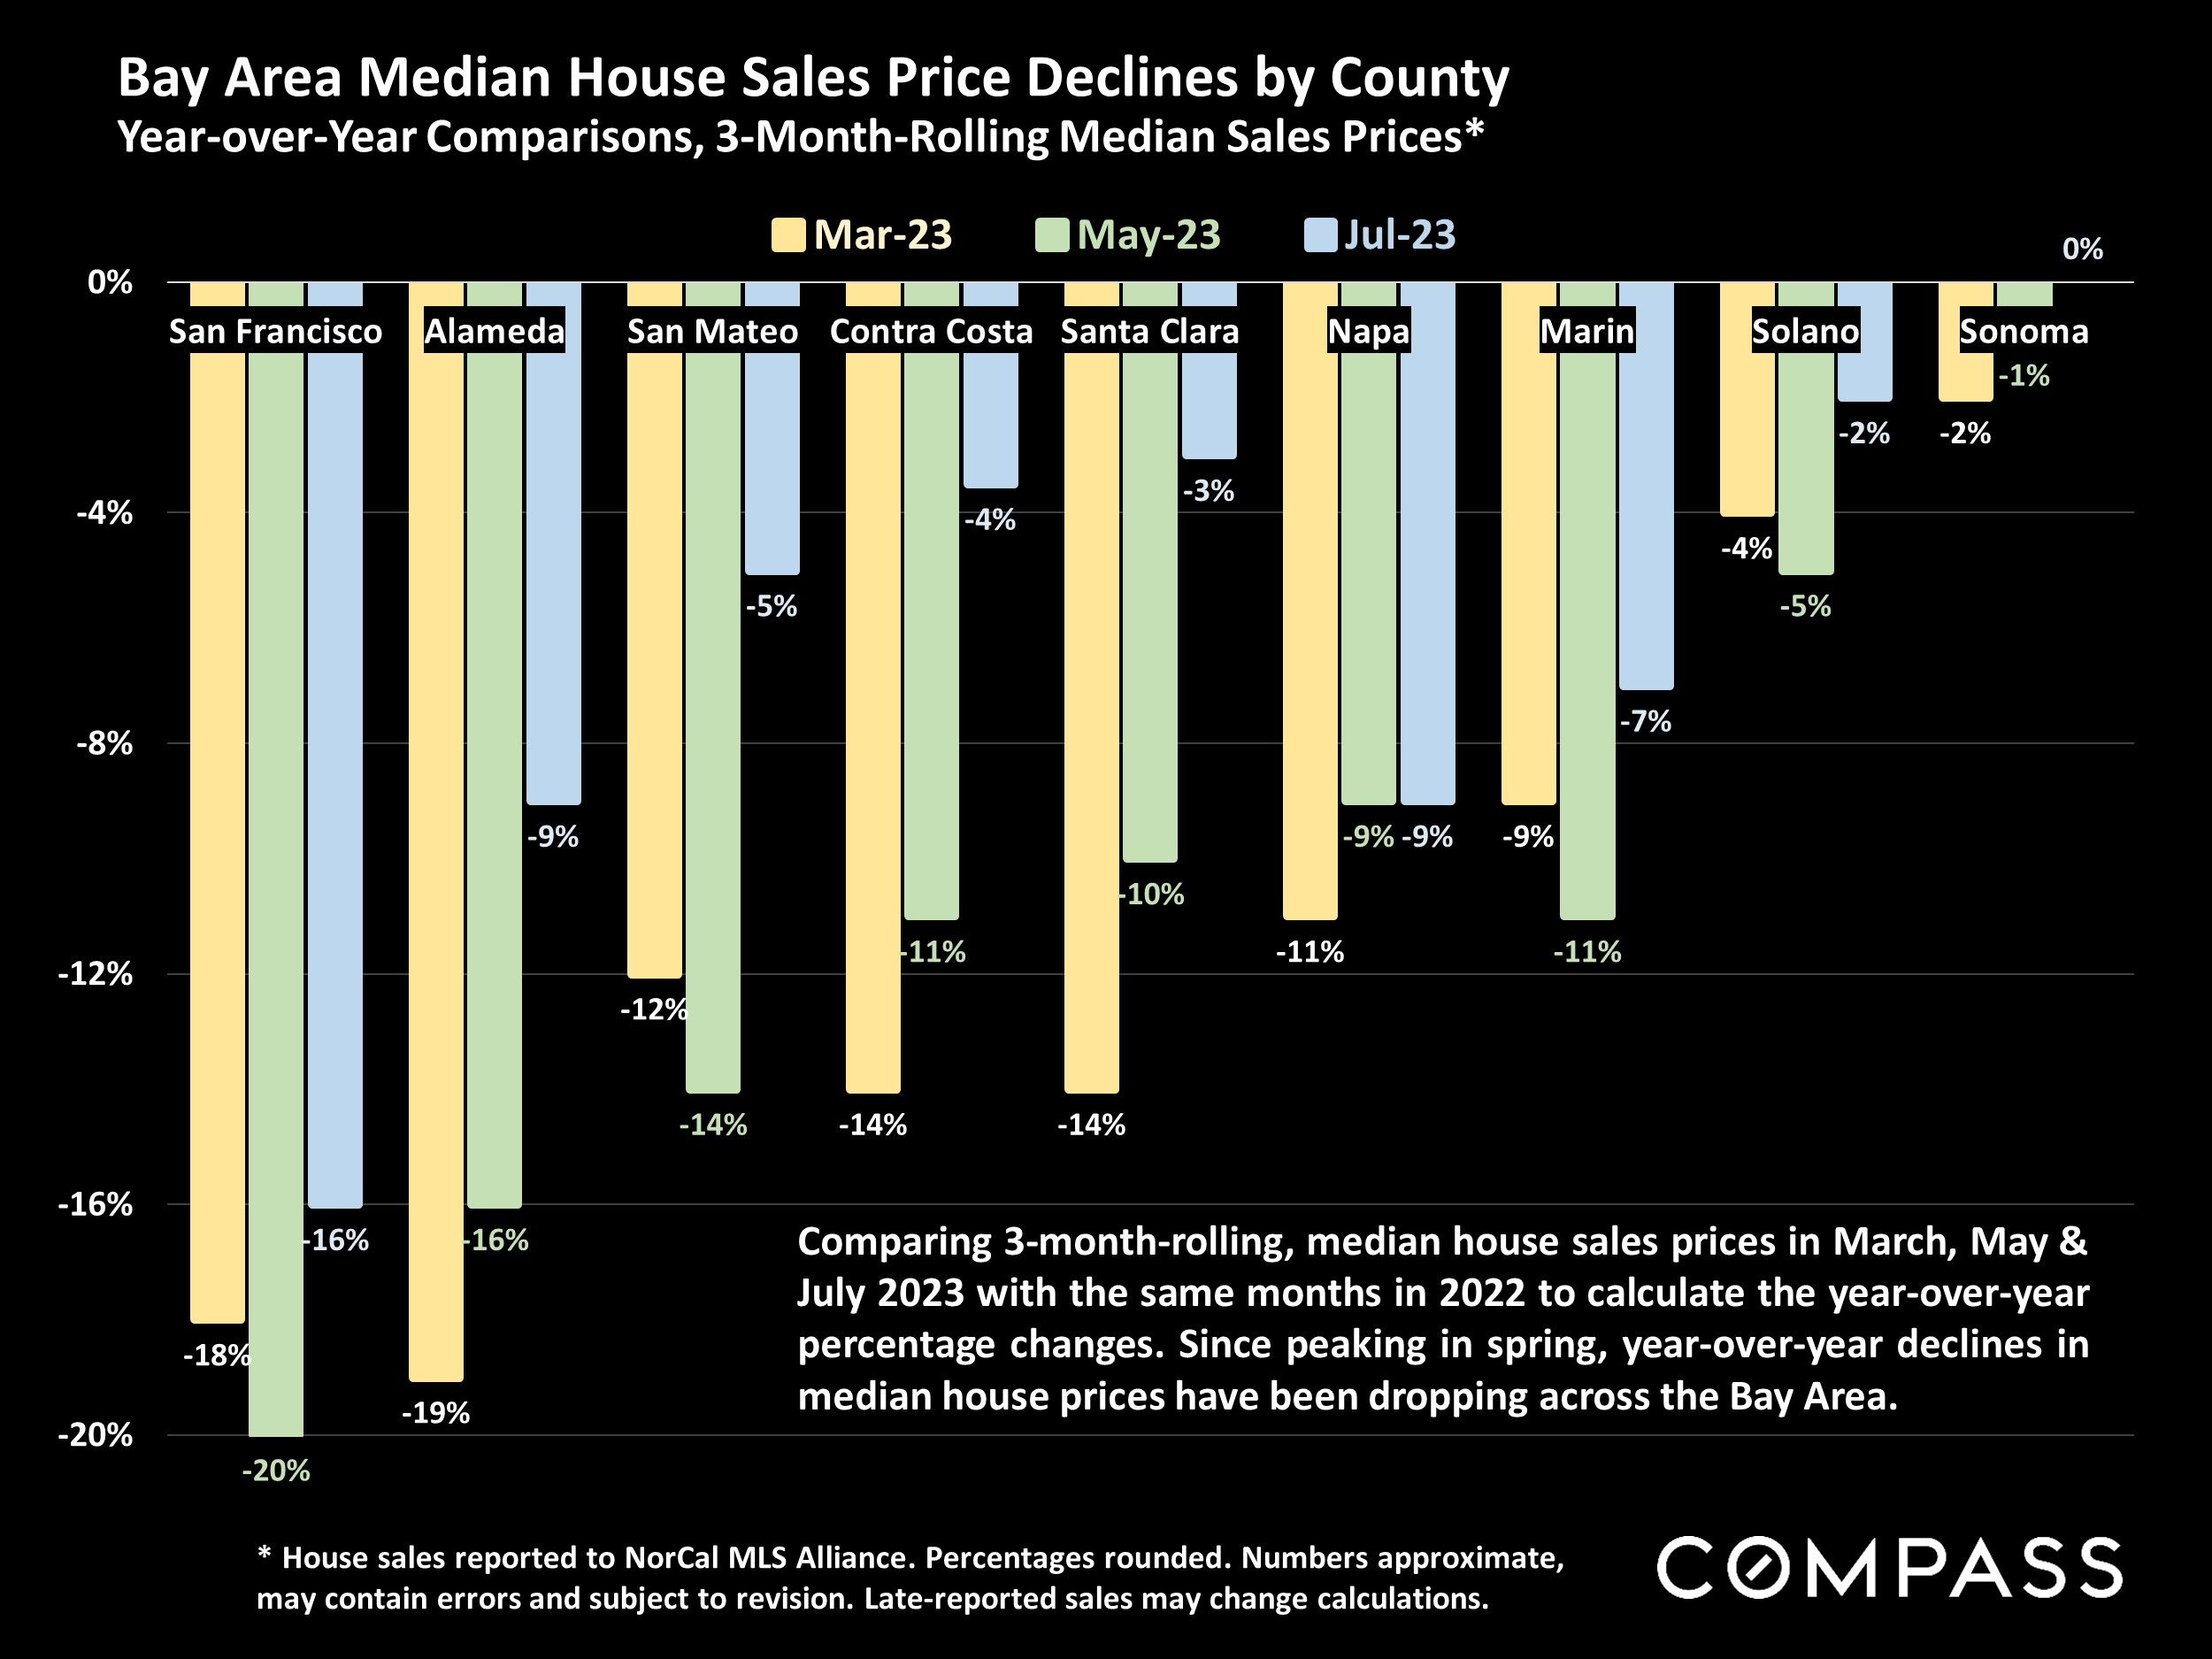
Chart comparing year-over-year median house price declines across nine Bay Area counties in March, May, and July 2023.

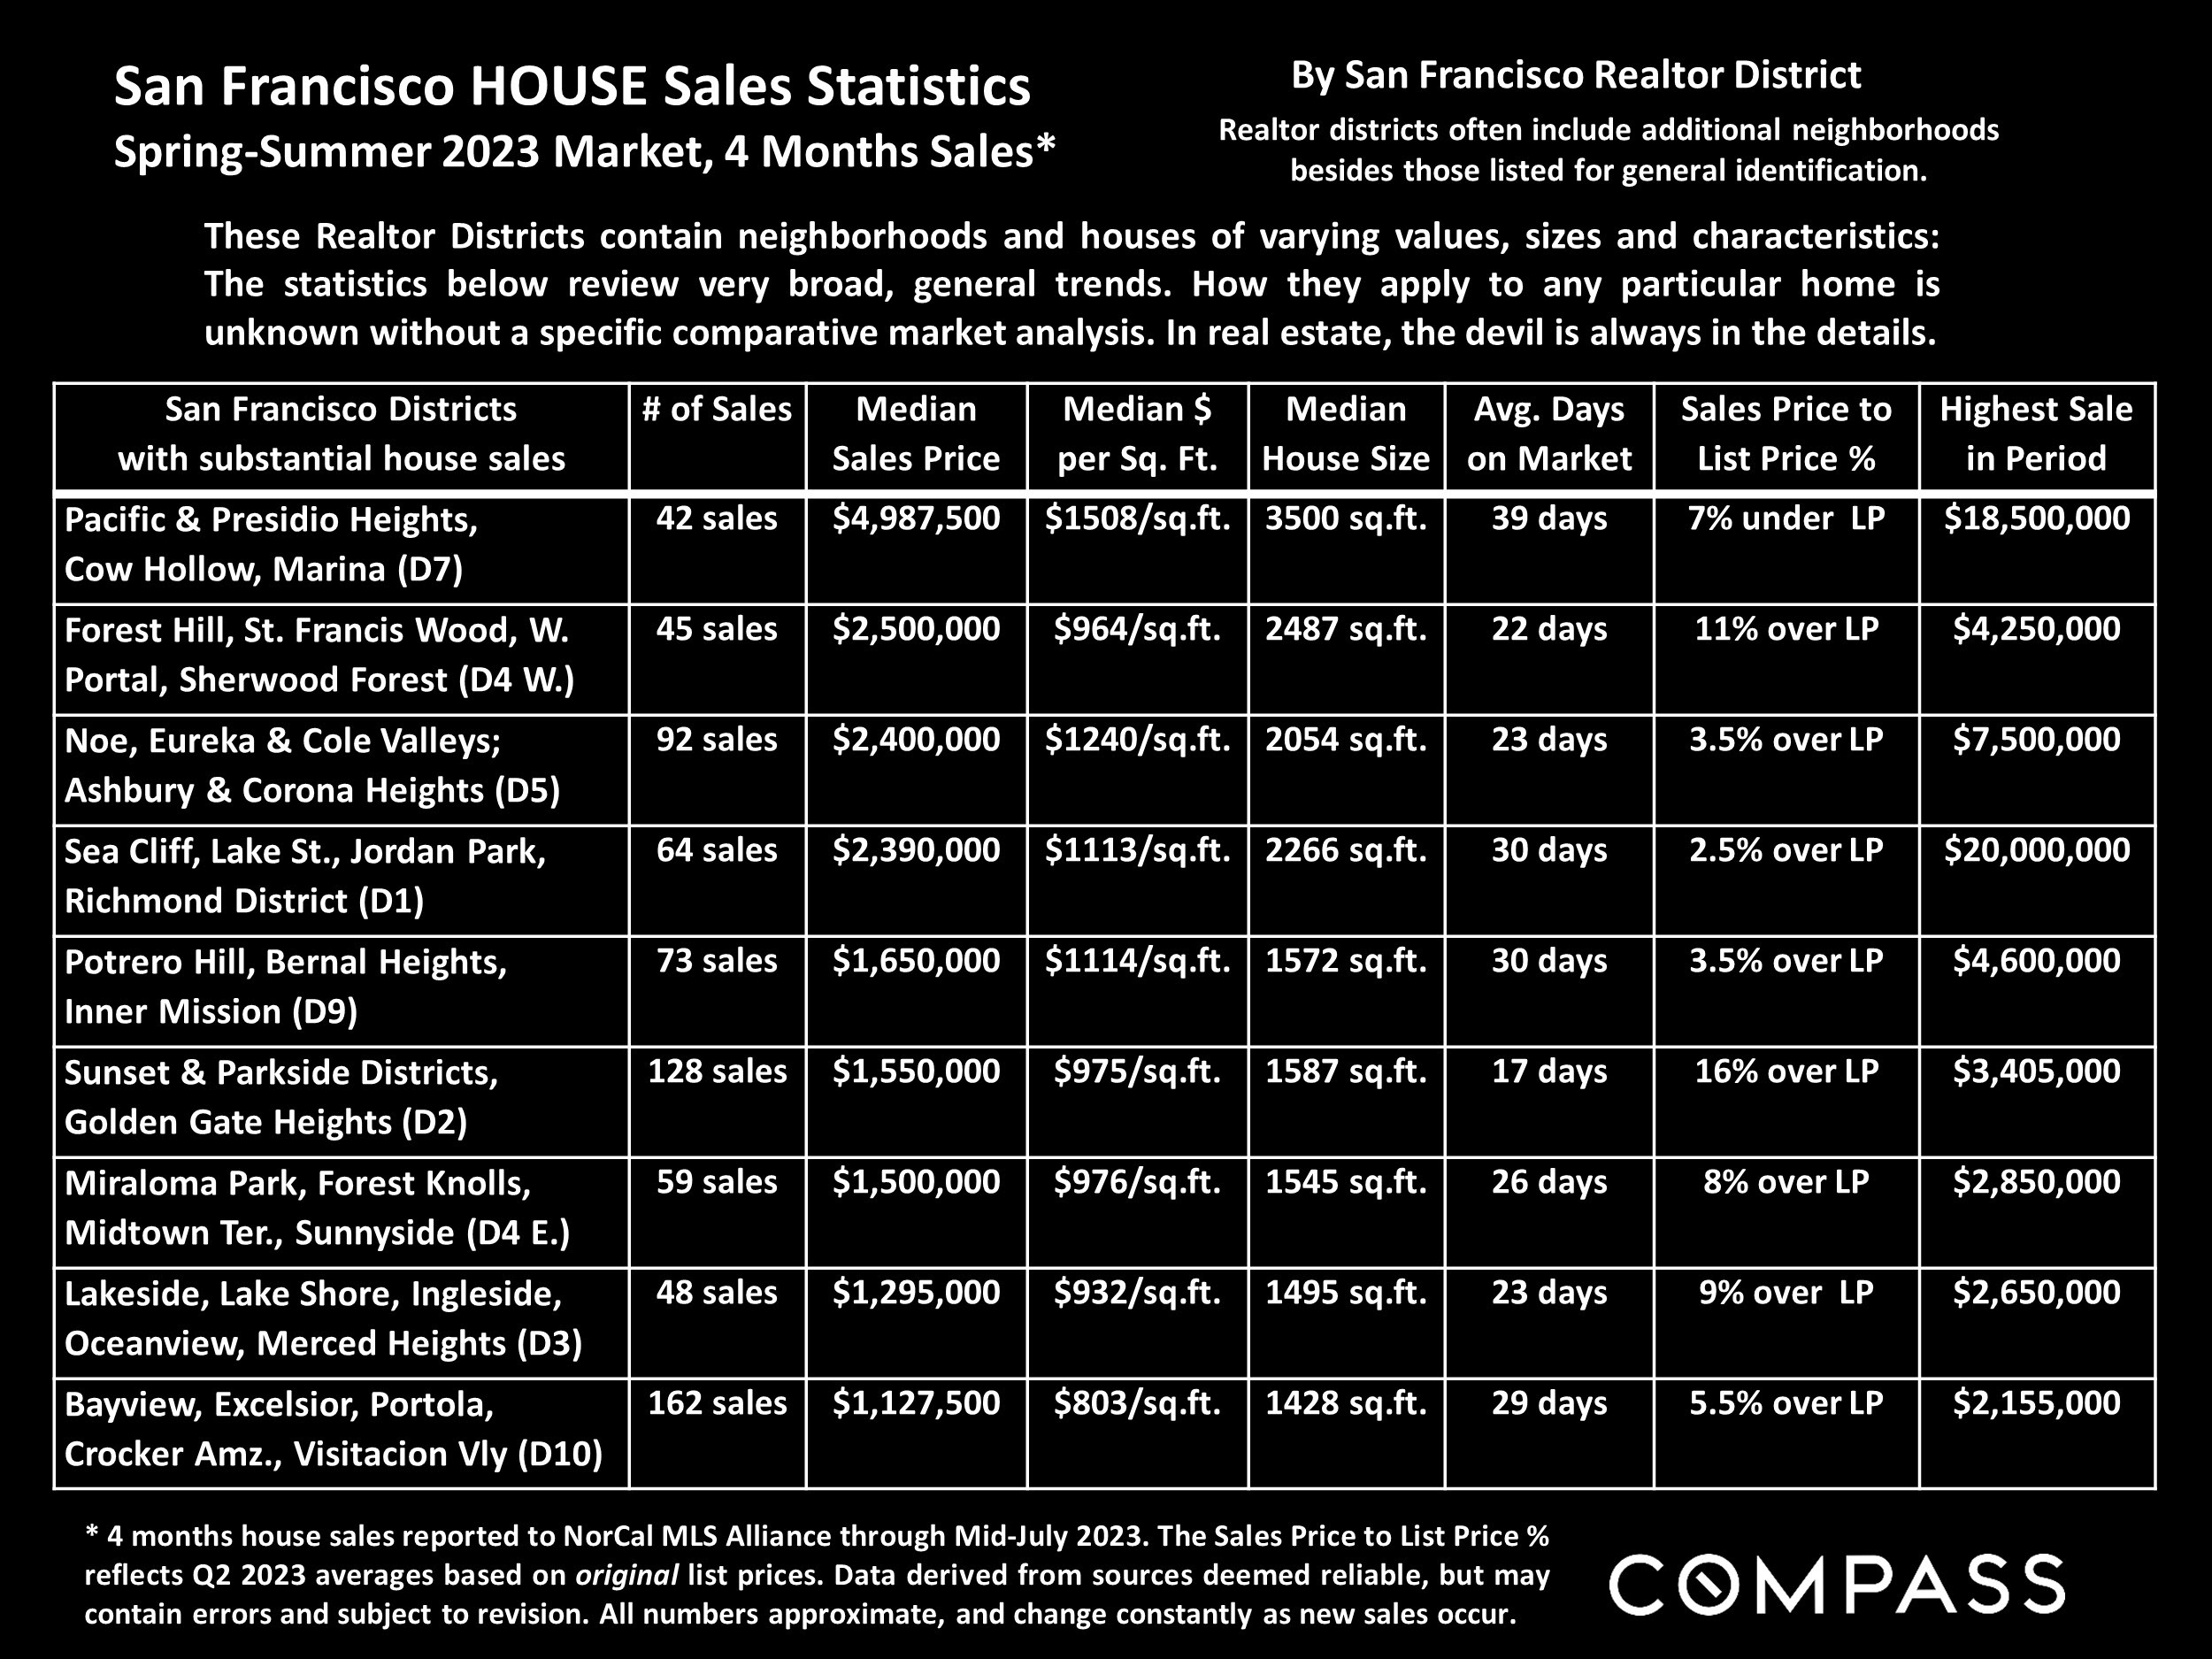
San Francisco spring–summer 2023 home-sale statistics by Realtor district, with prices, sale counts, and market metrics.

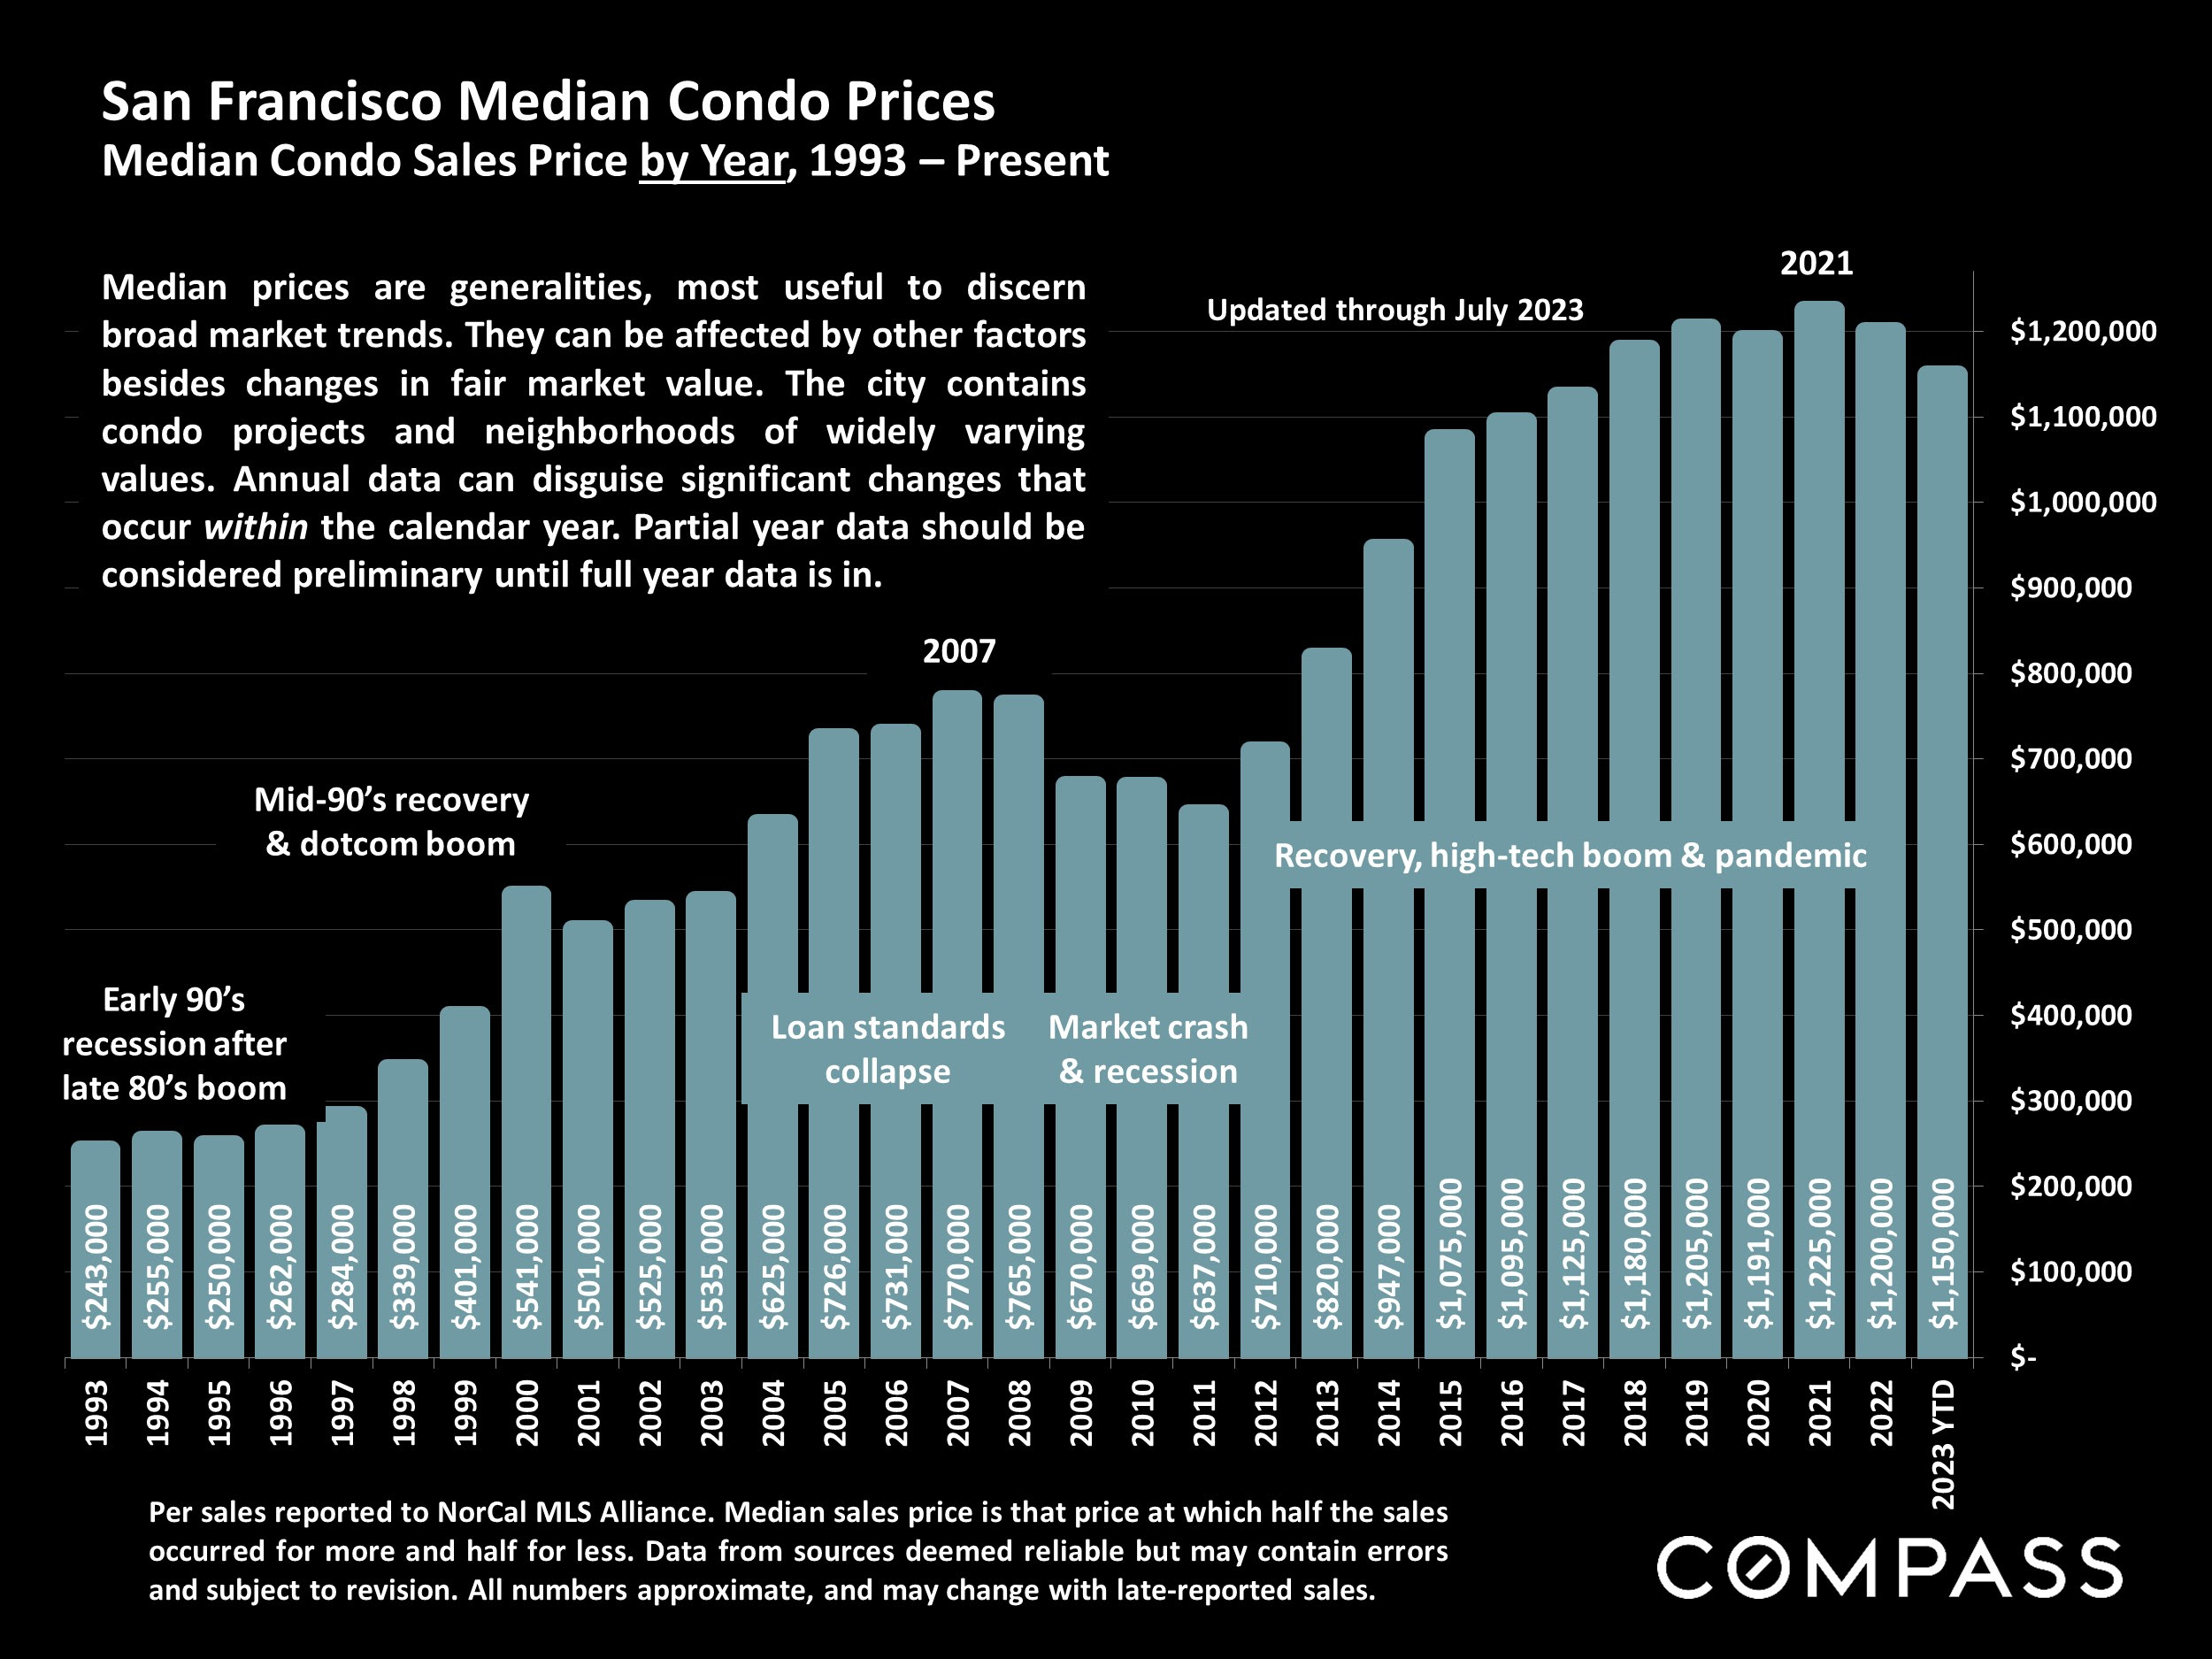
Chart of San Francisco median condo sale prices from 1993 through July 2023.

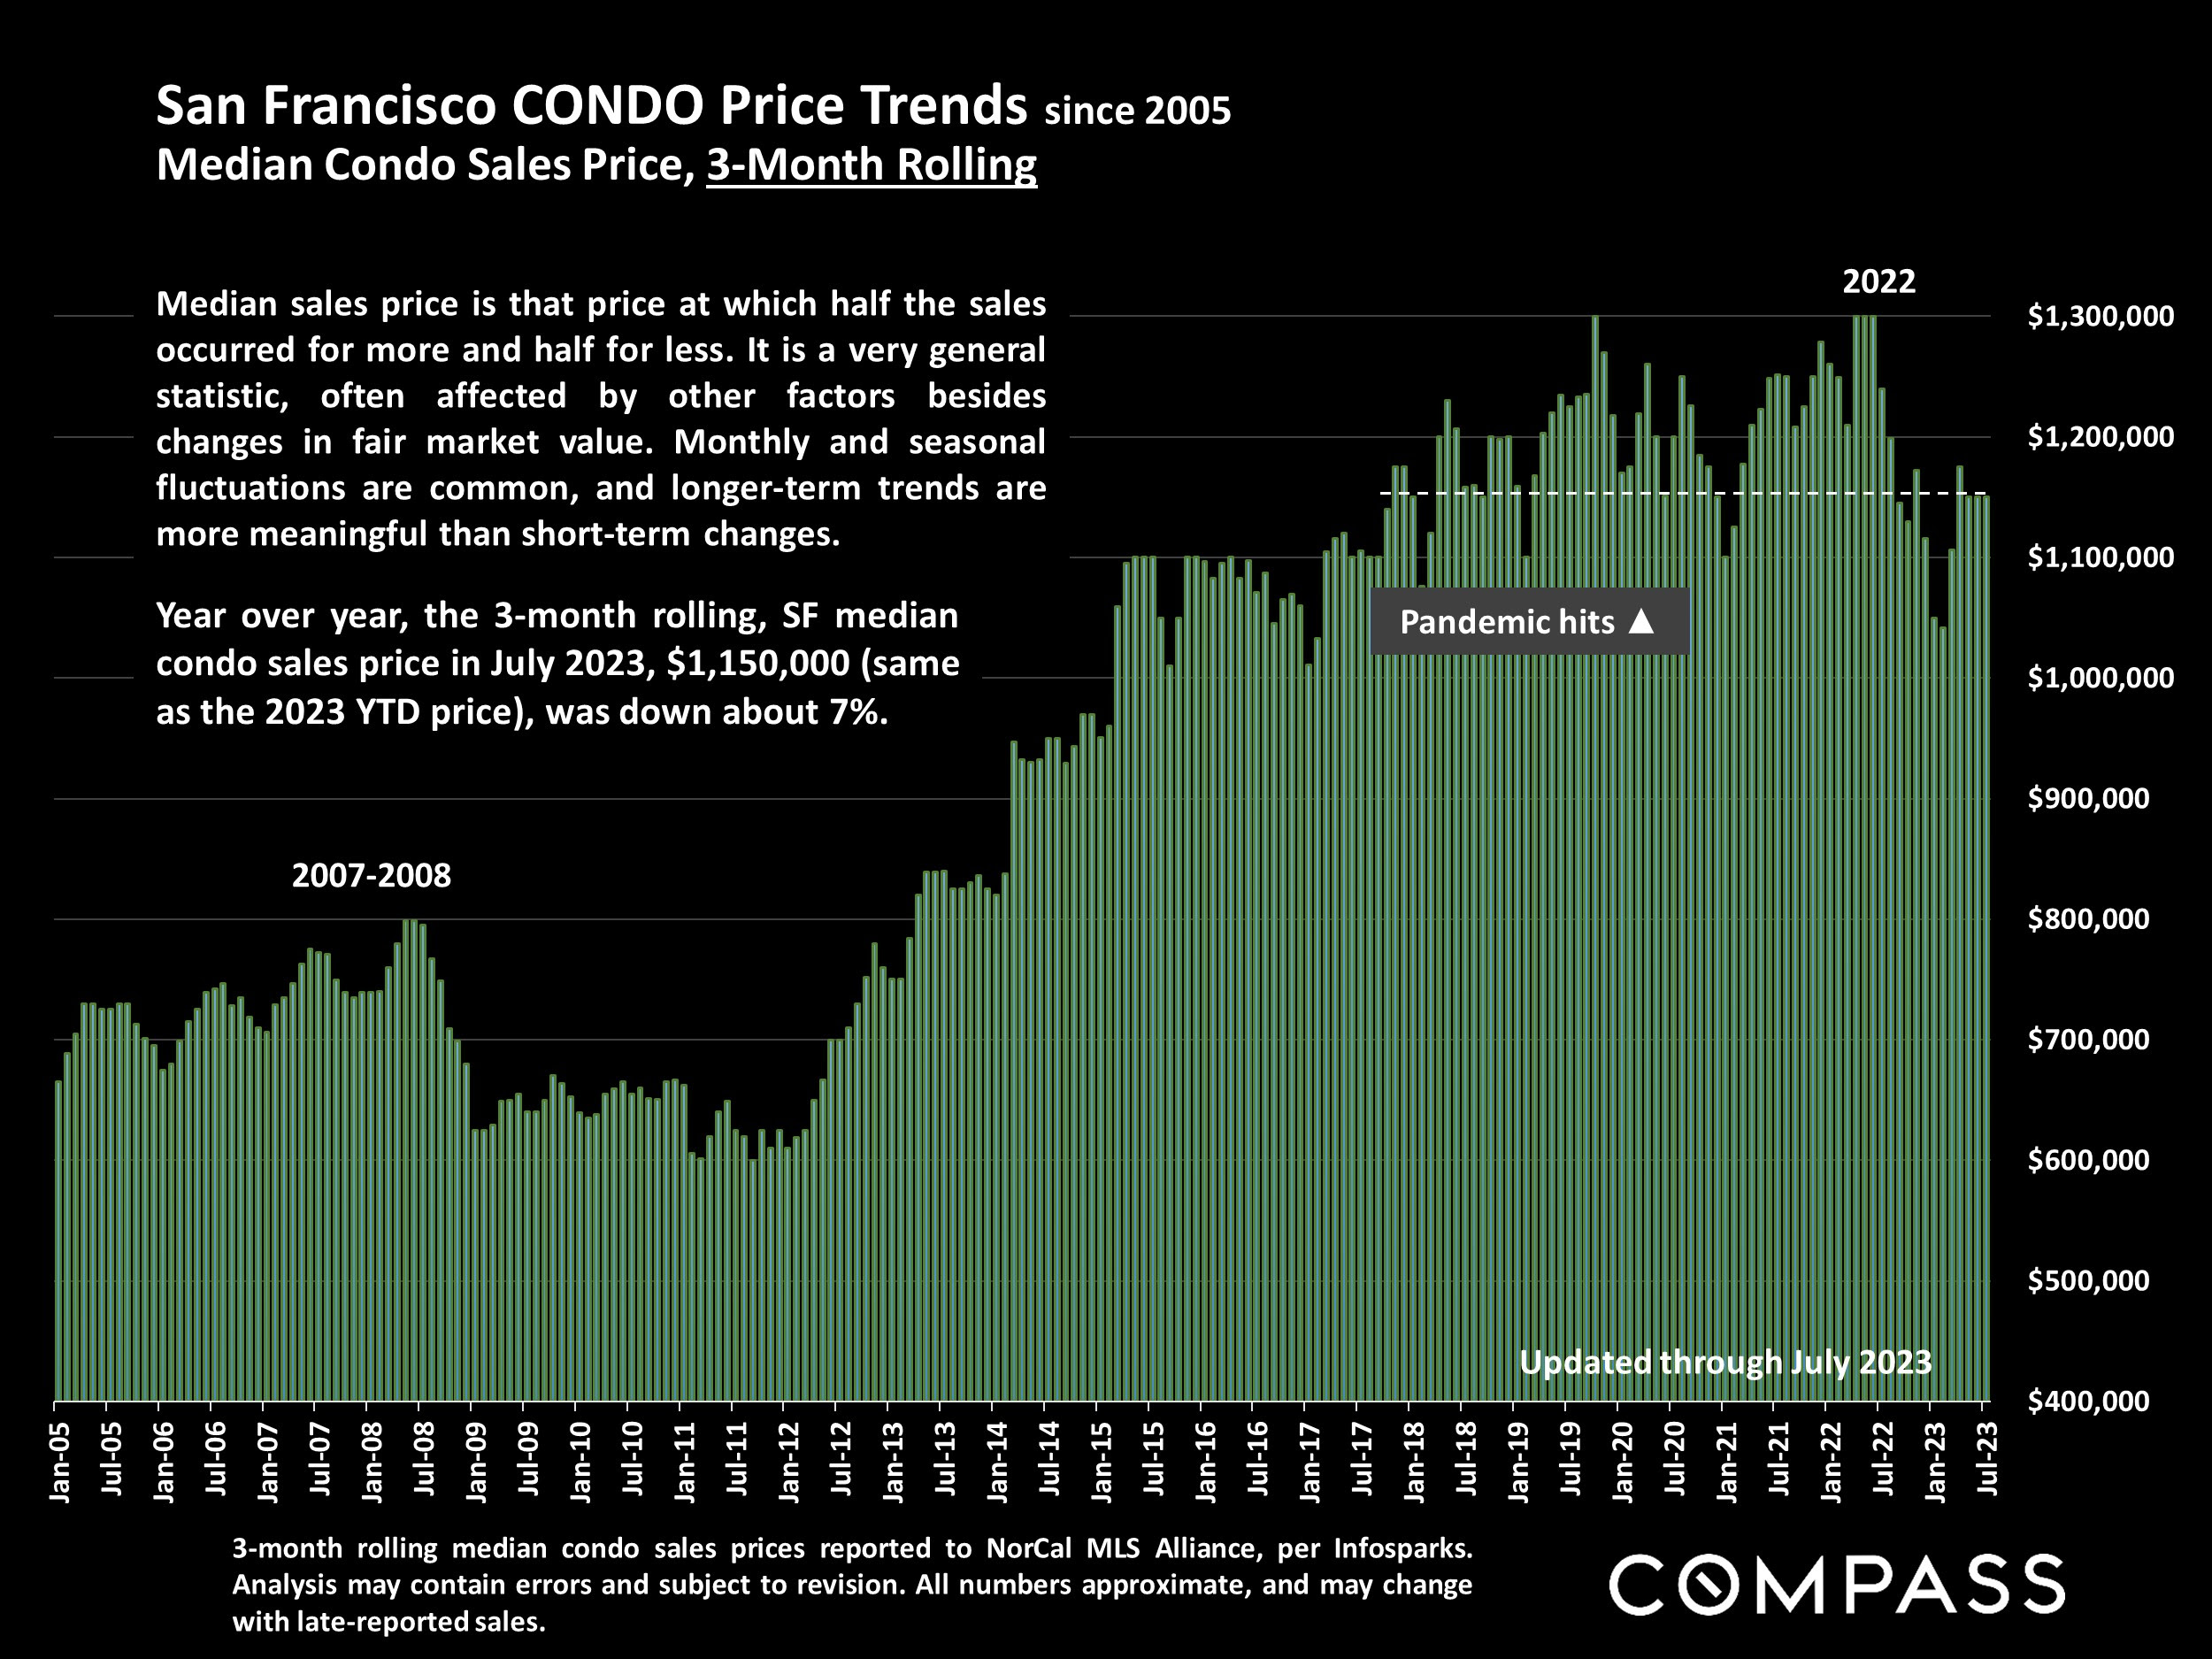
Chart of San Francisco median condo prices, with monthly bars from 2005 through July 2023 and a 2022 peak.

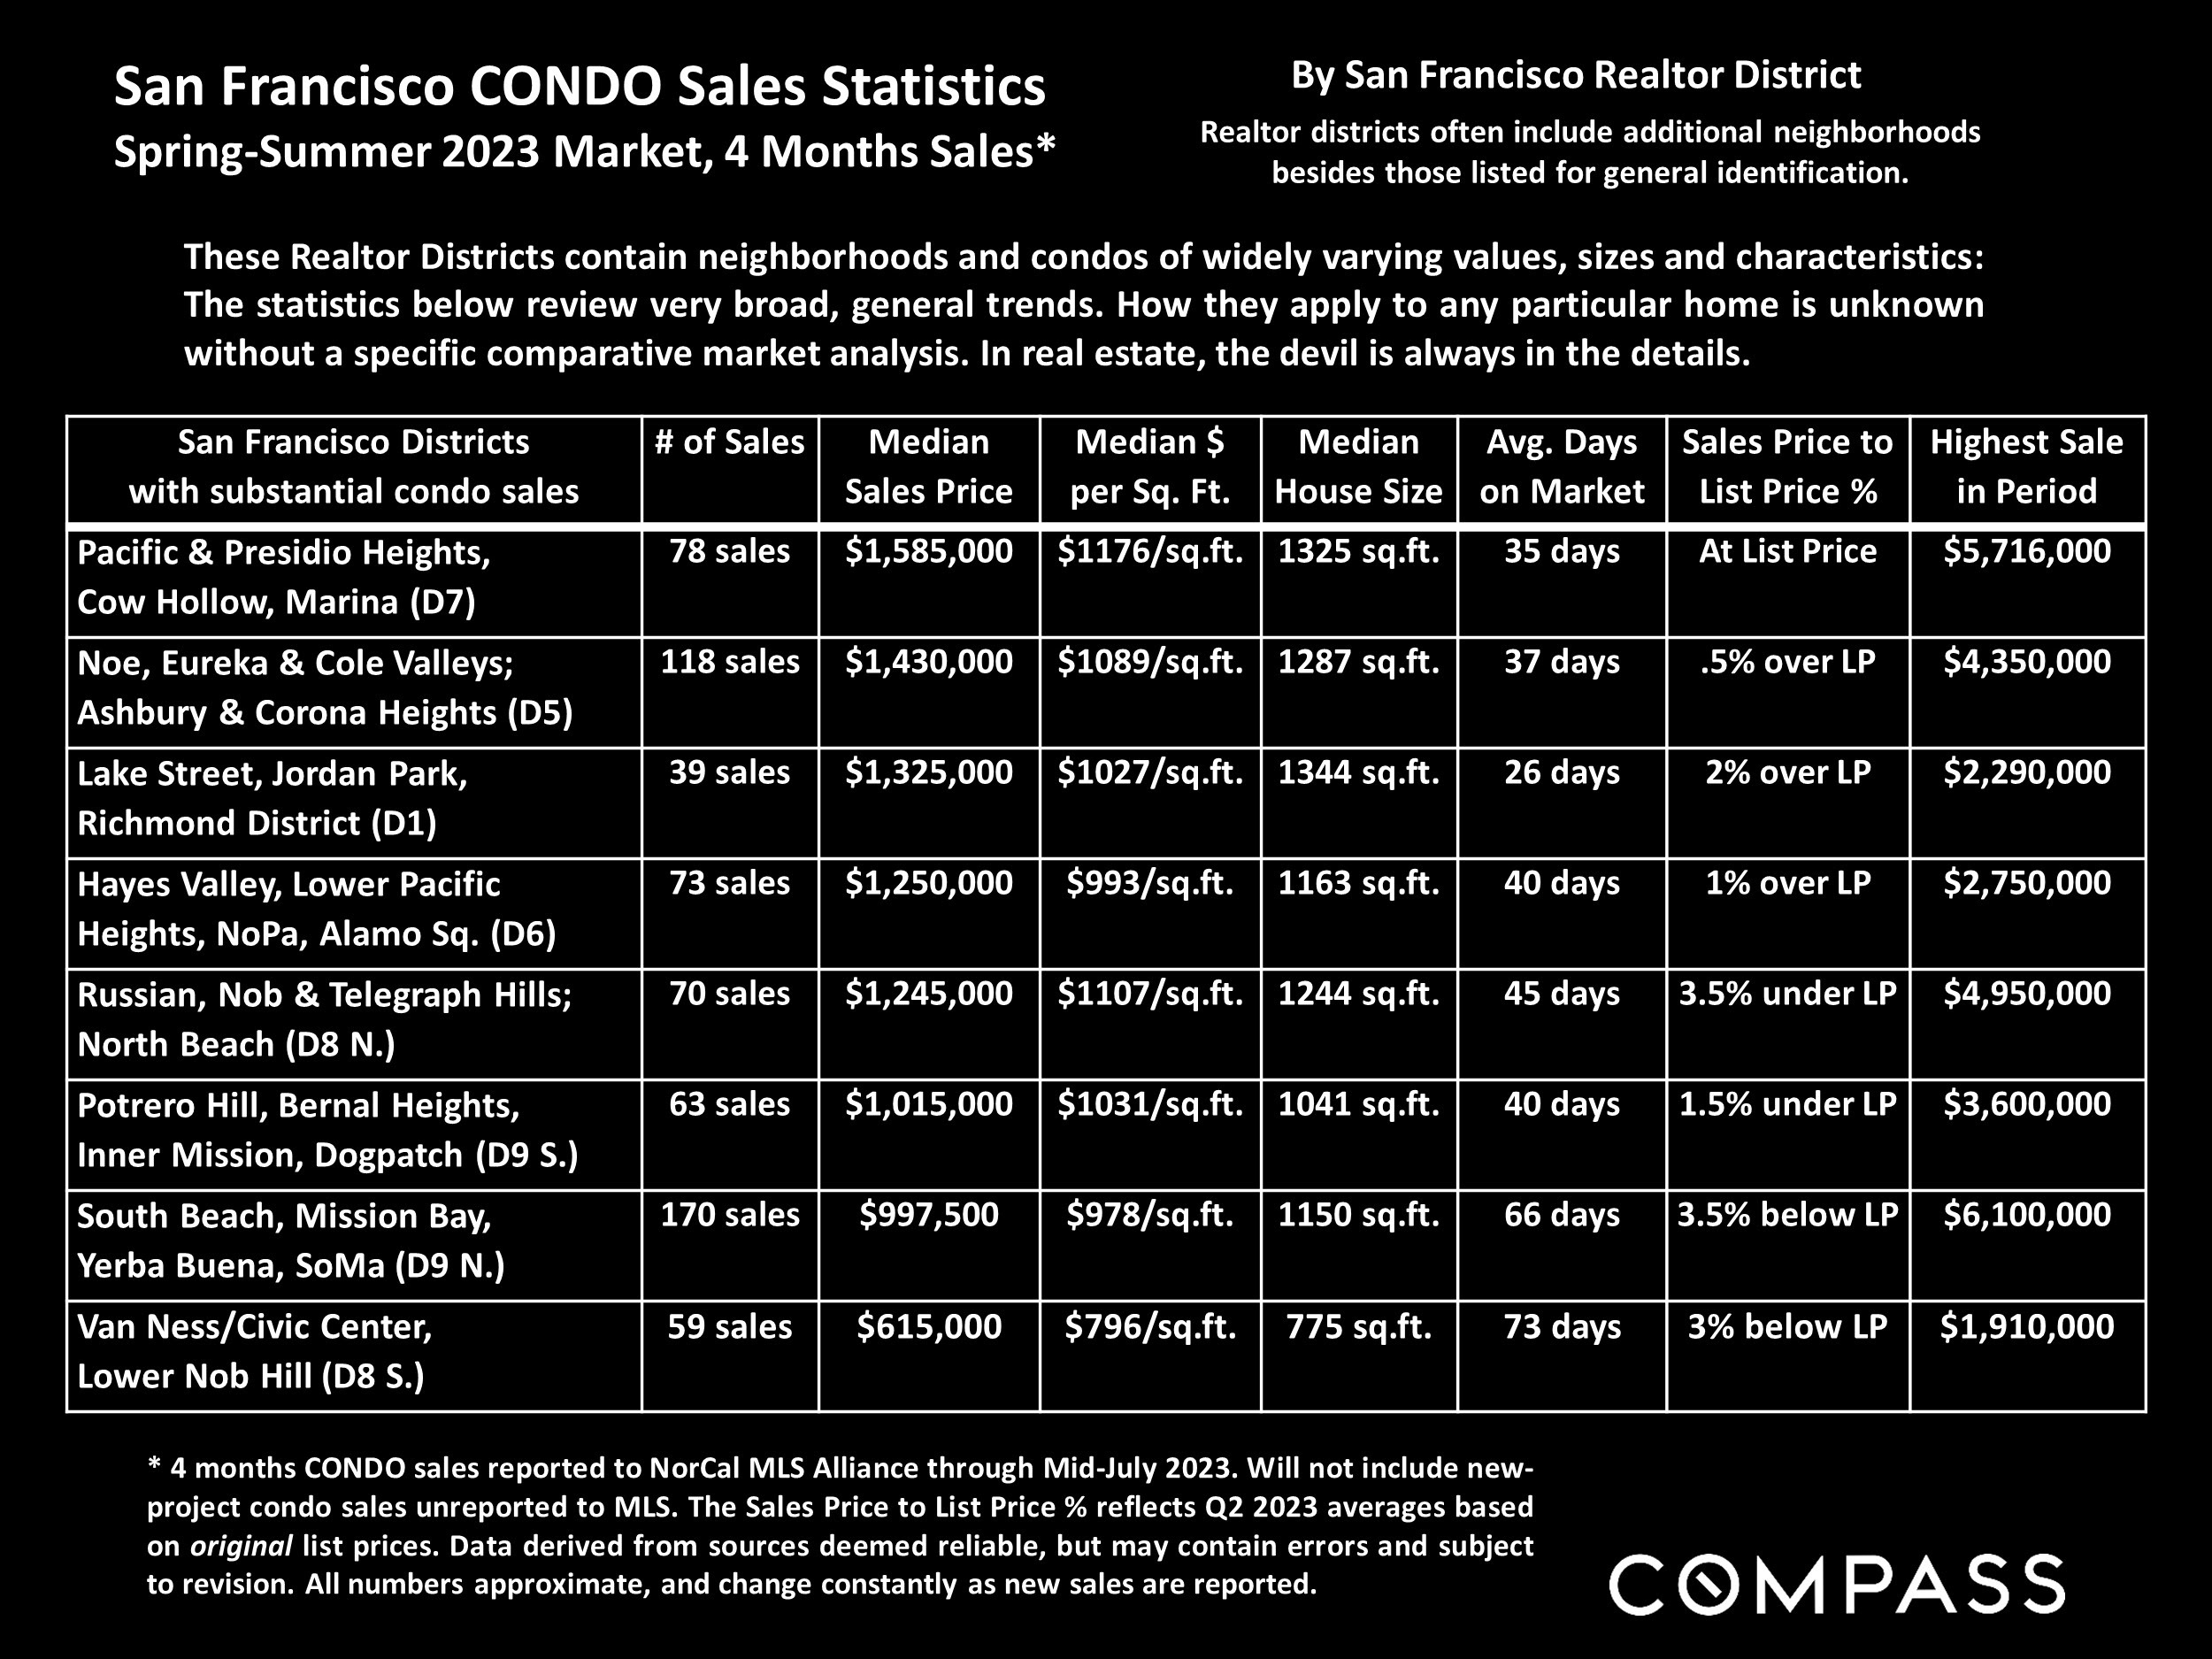
San Francisco condo sales statistics table by Realtor district for spring-summer 2023.

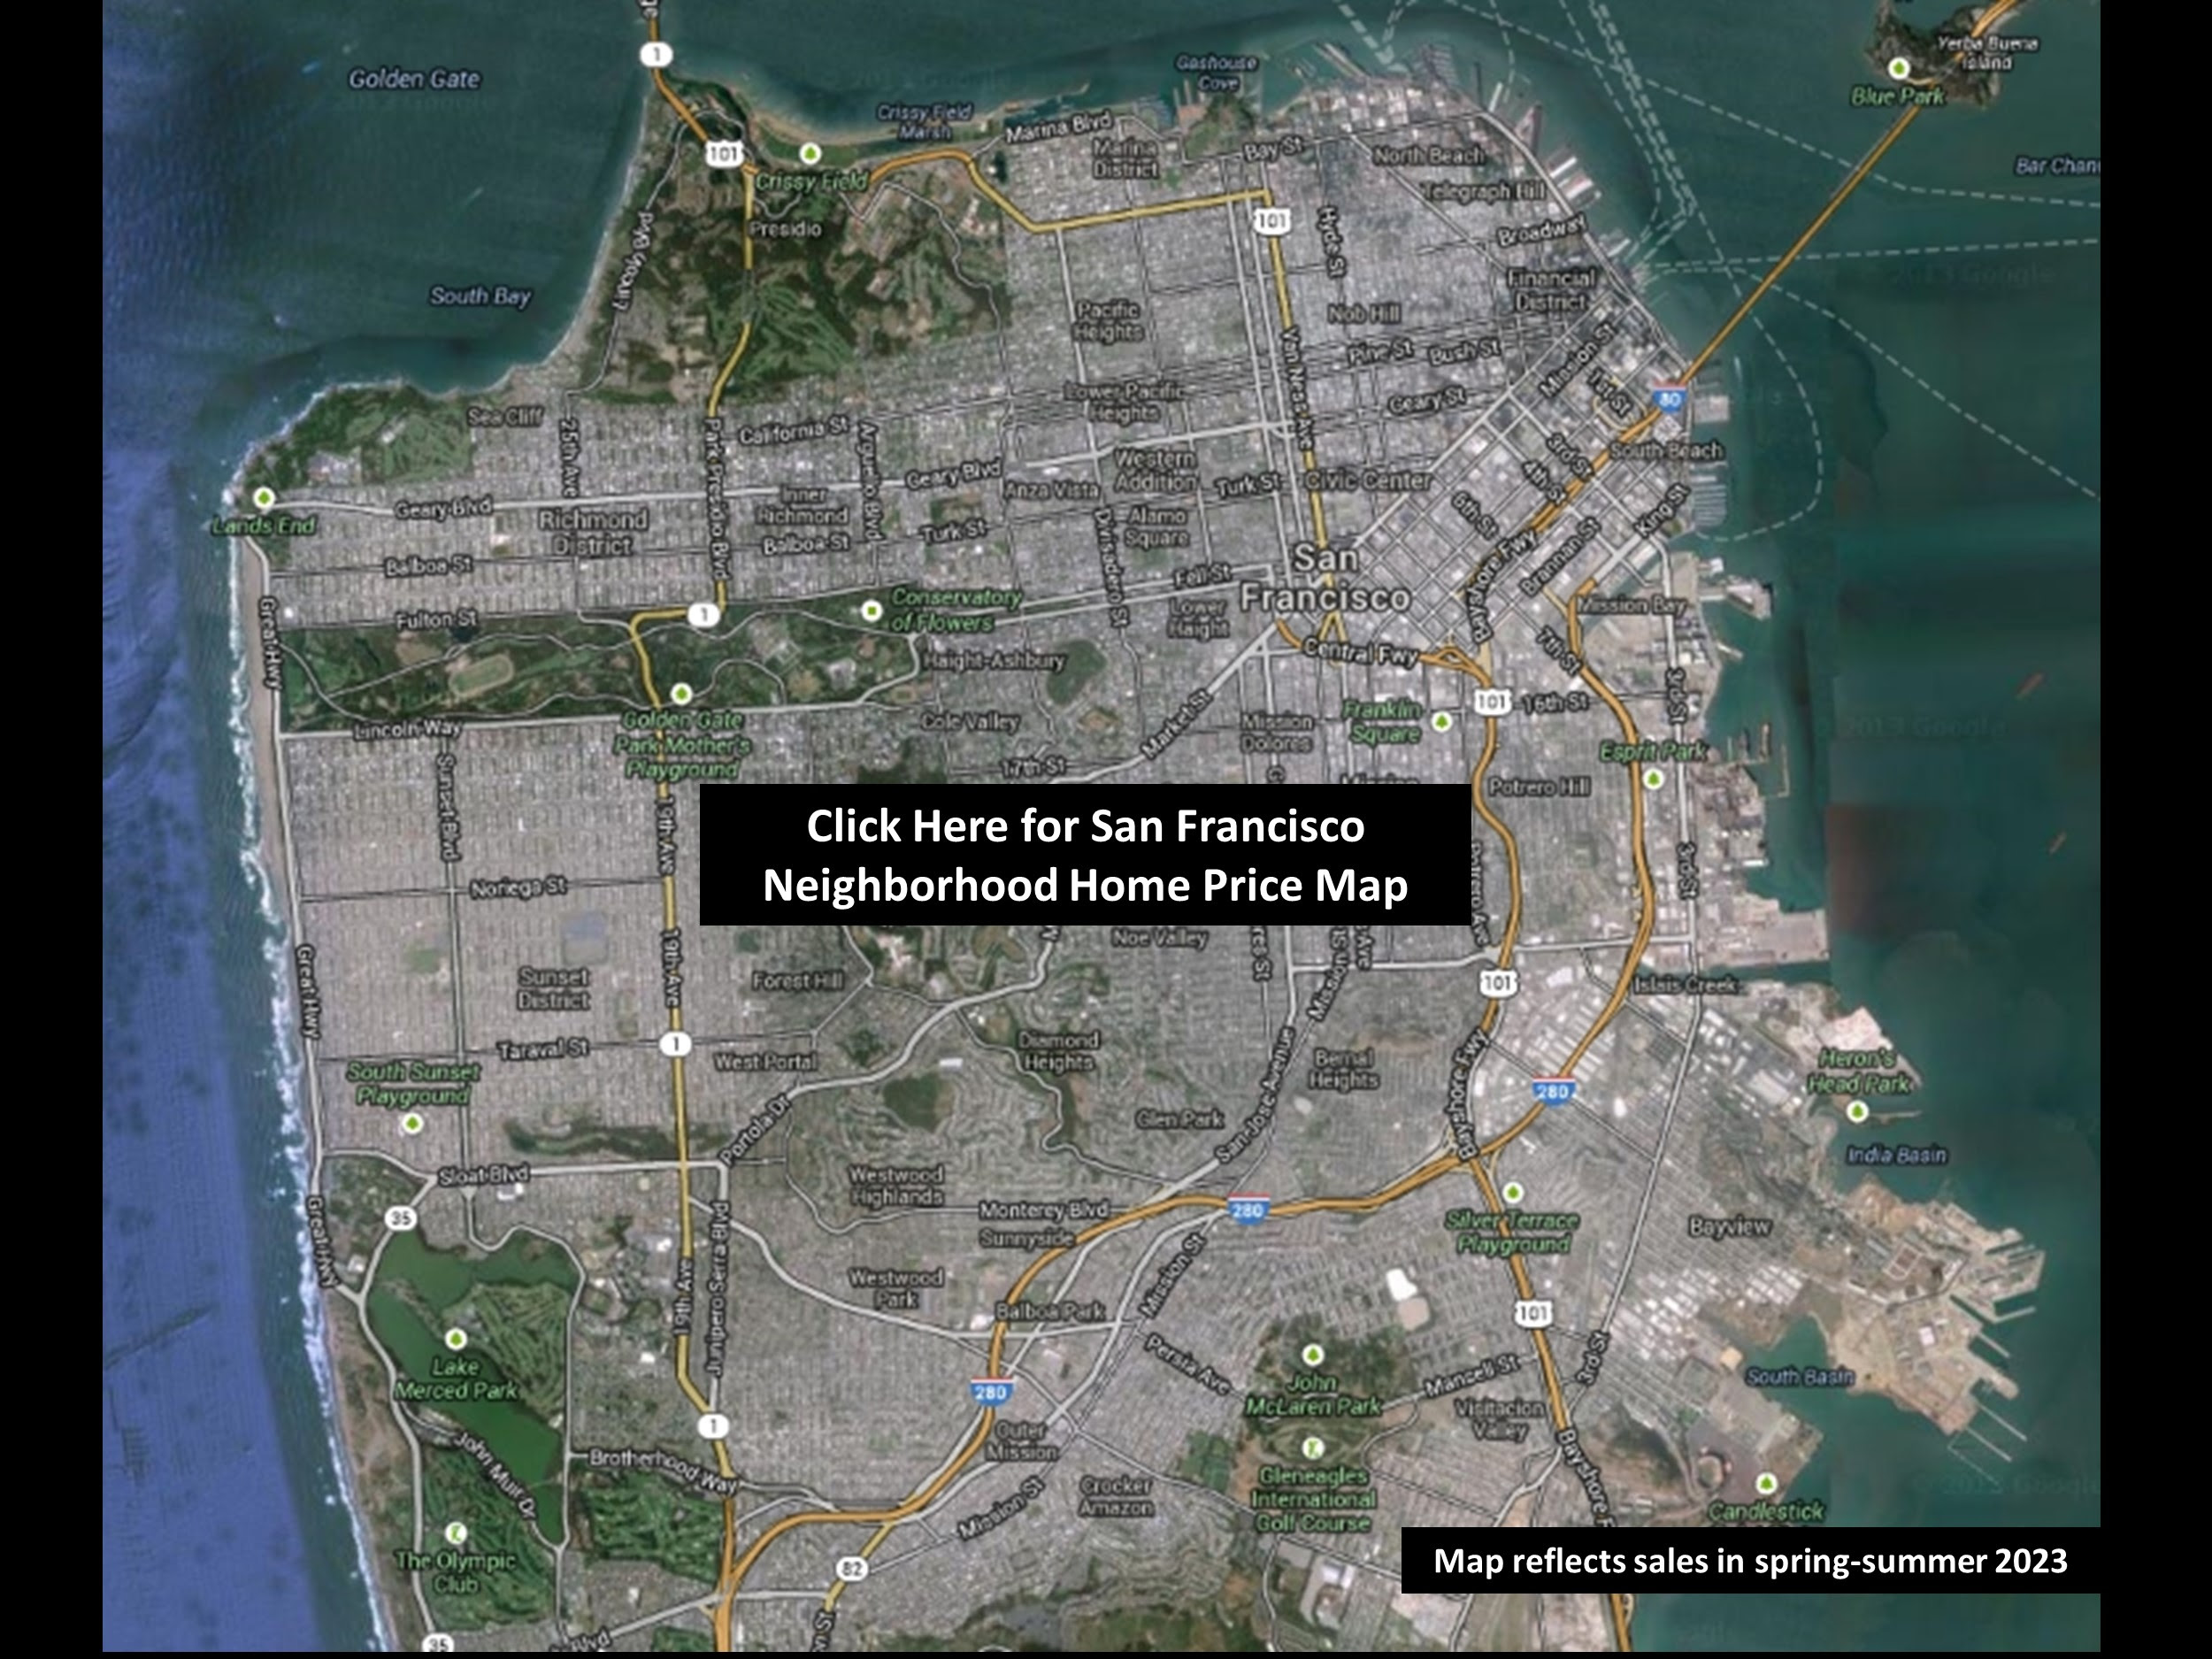
Aerial map of San Francisco neighborhoods, labeled with a link to home prices based on spring–summer 2023 sales.

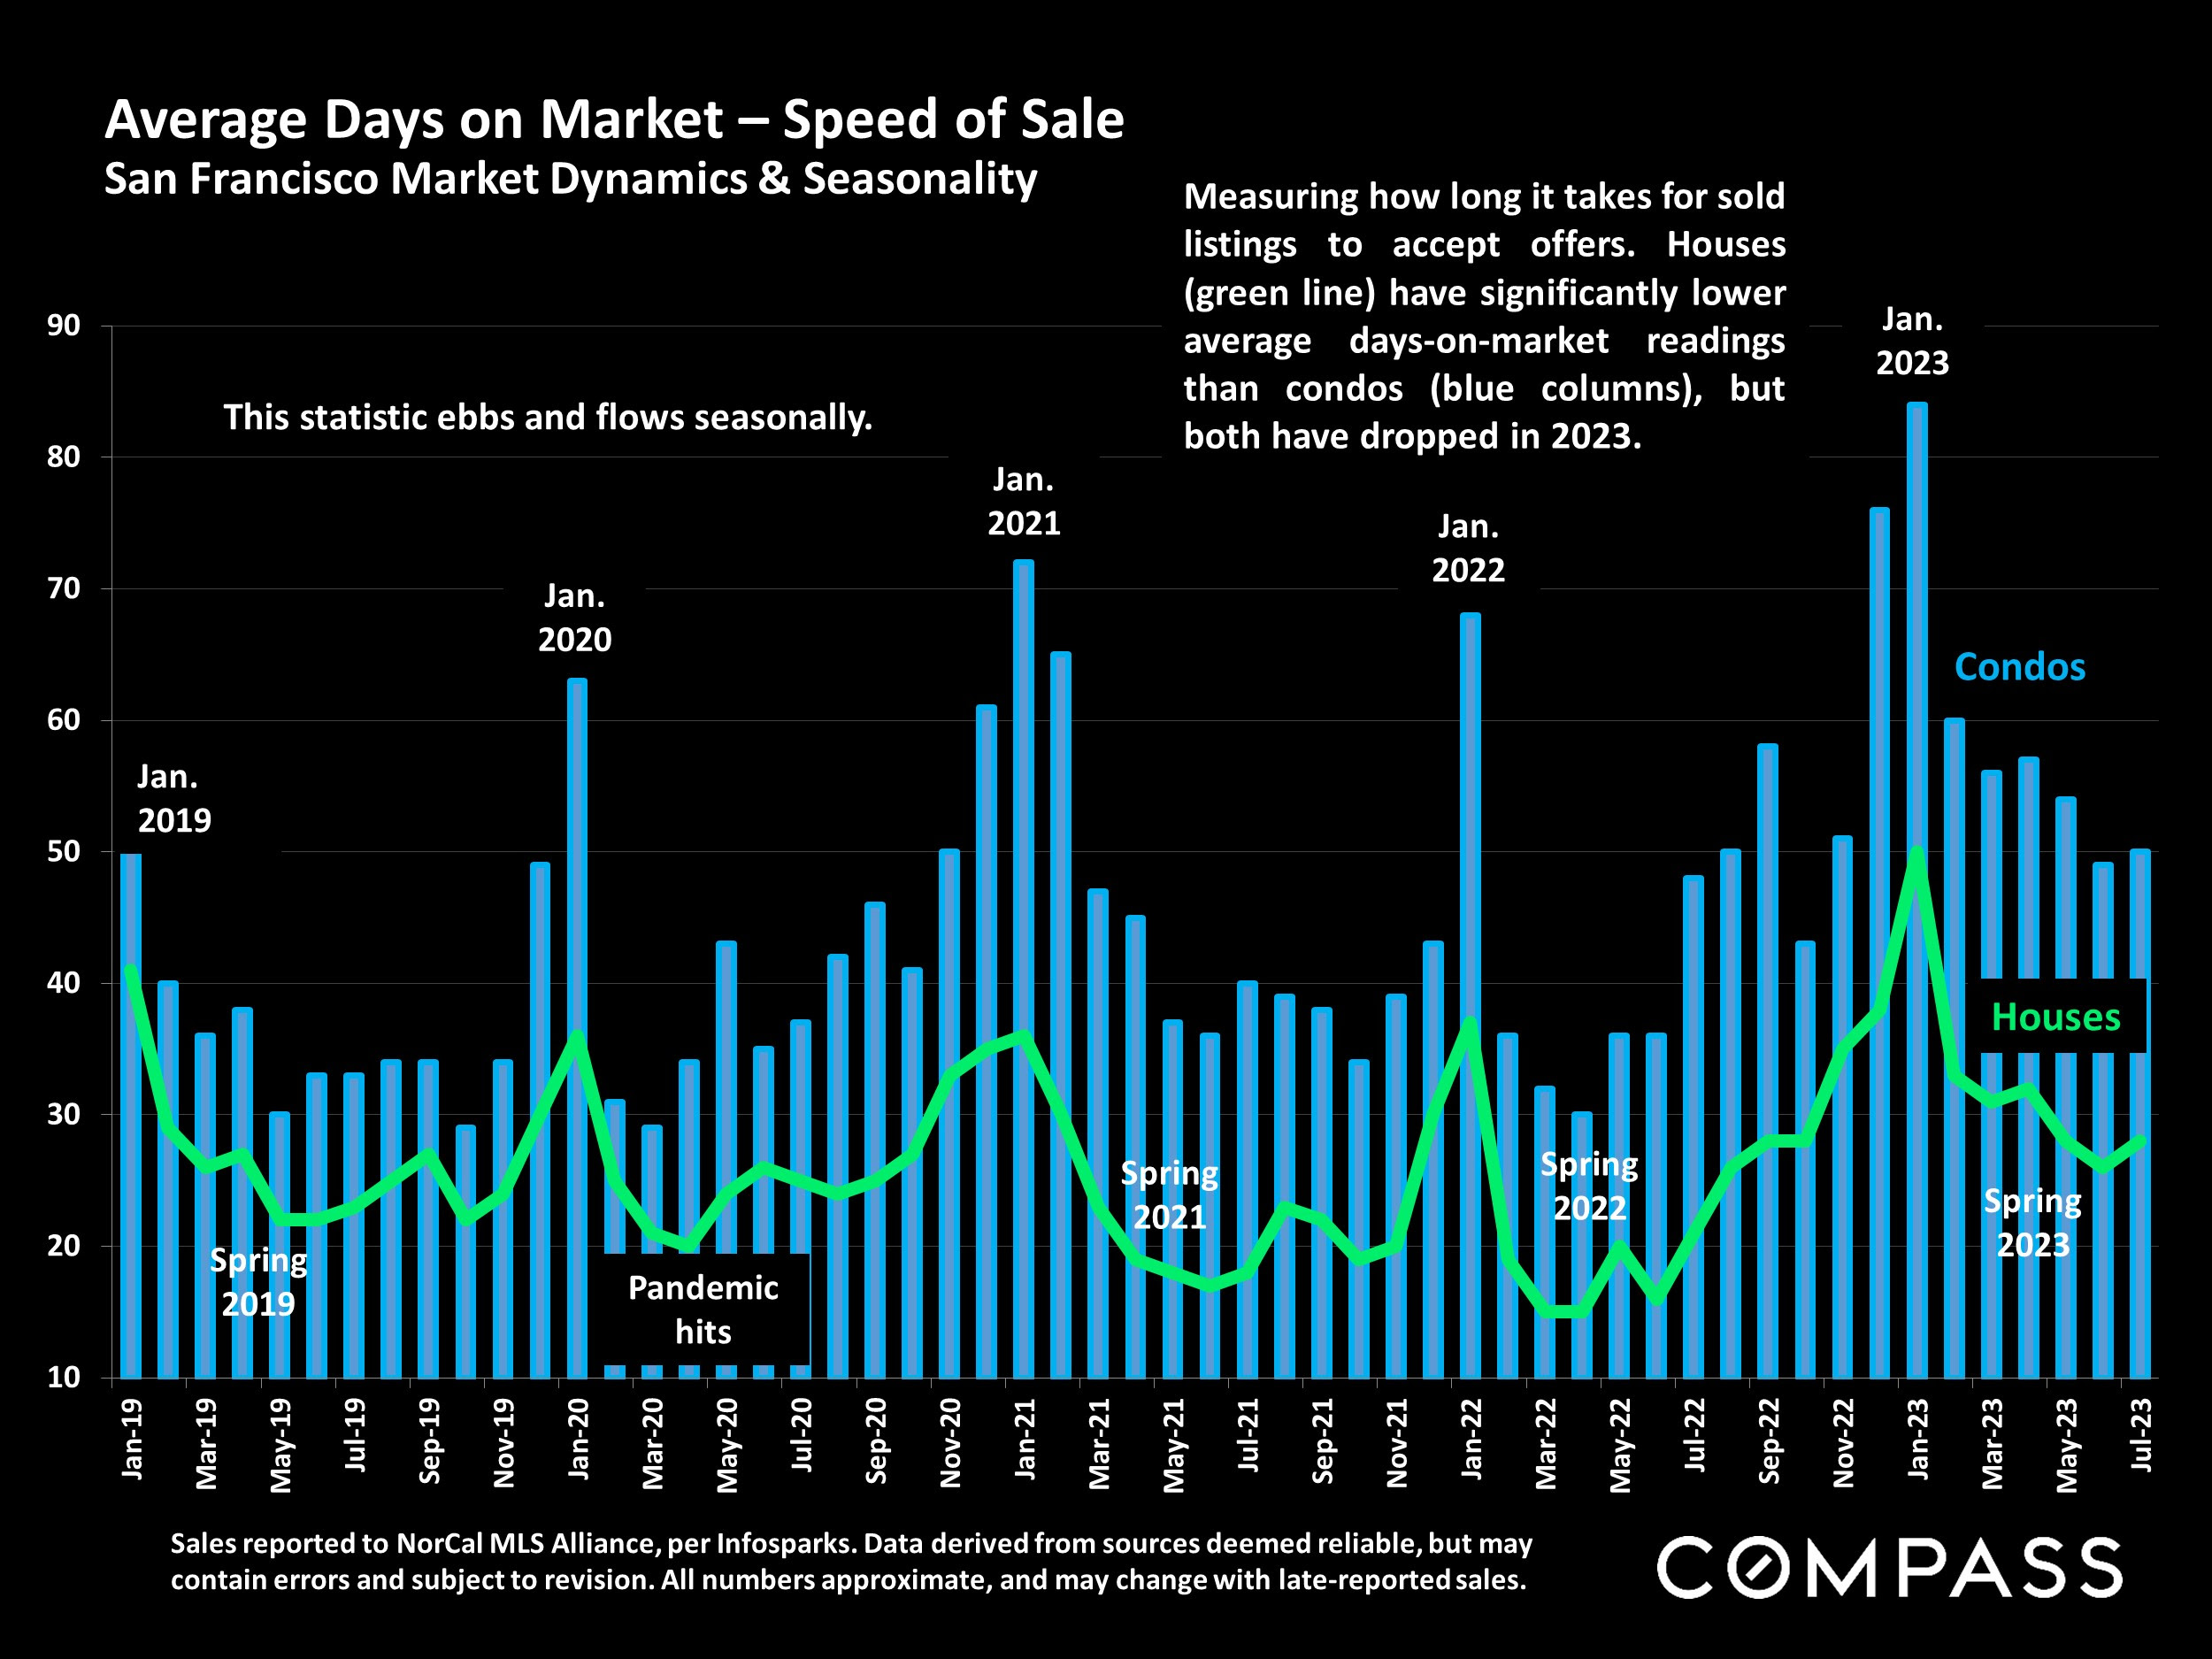
San Francisco chart of average days on market for houses and condos, 2019–2023.

Chart of San Francisco house and condo sale prices compared with original list prices, January 2019–July 2023.

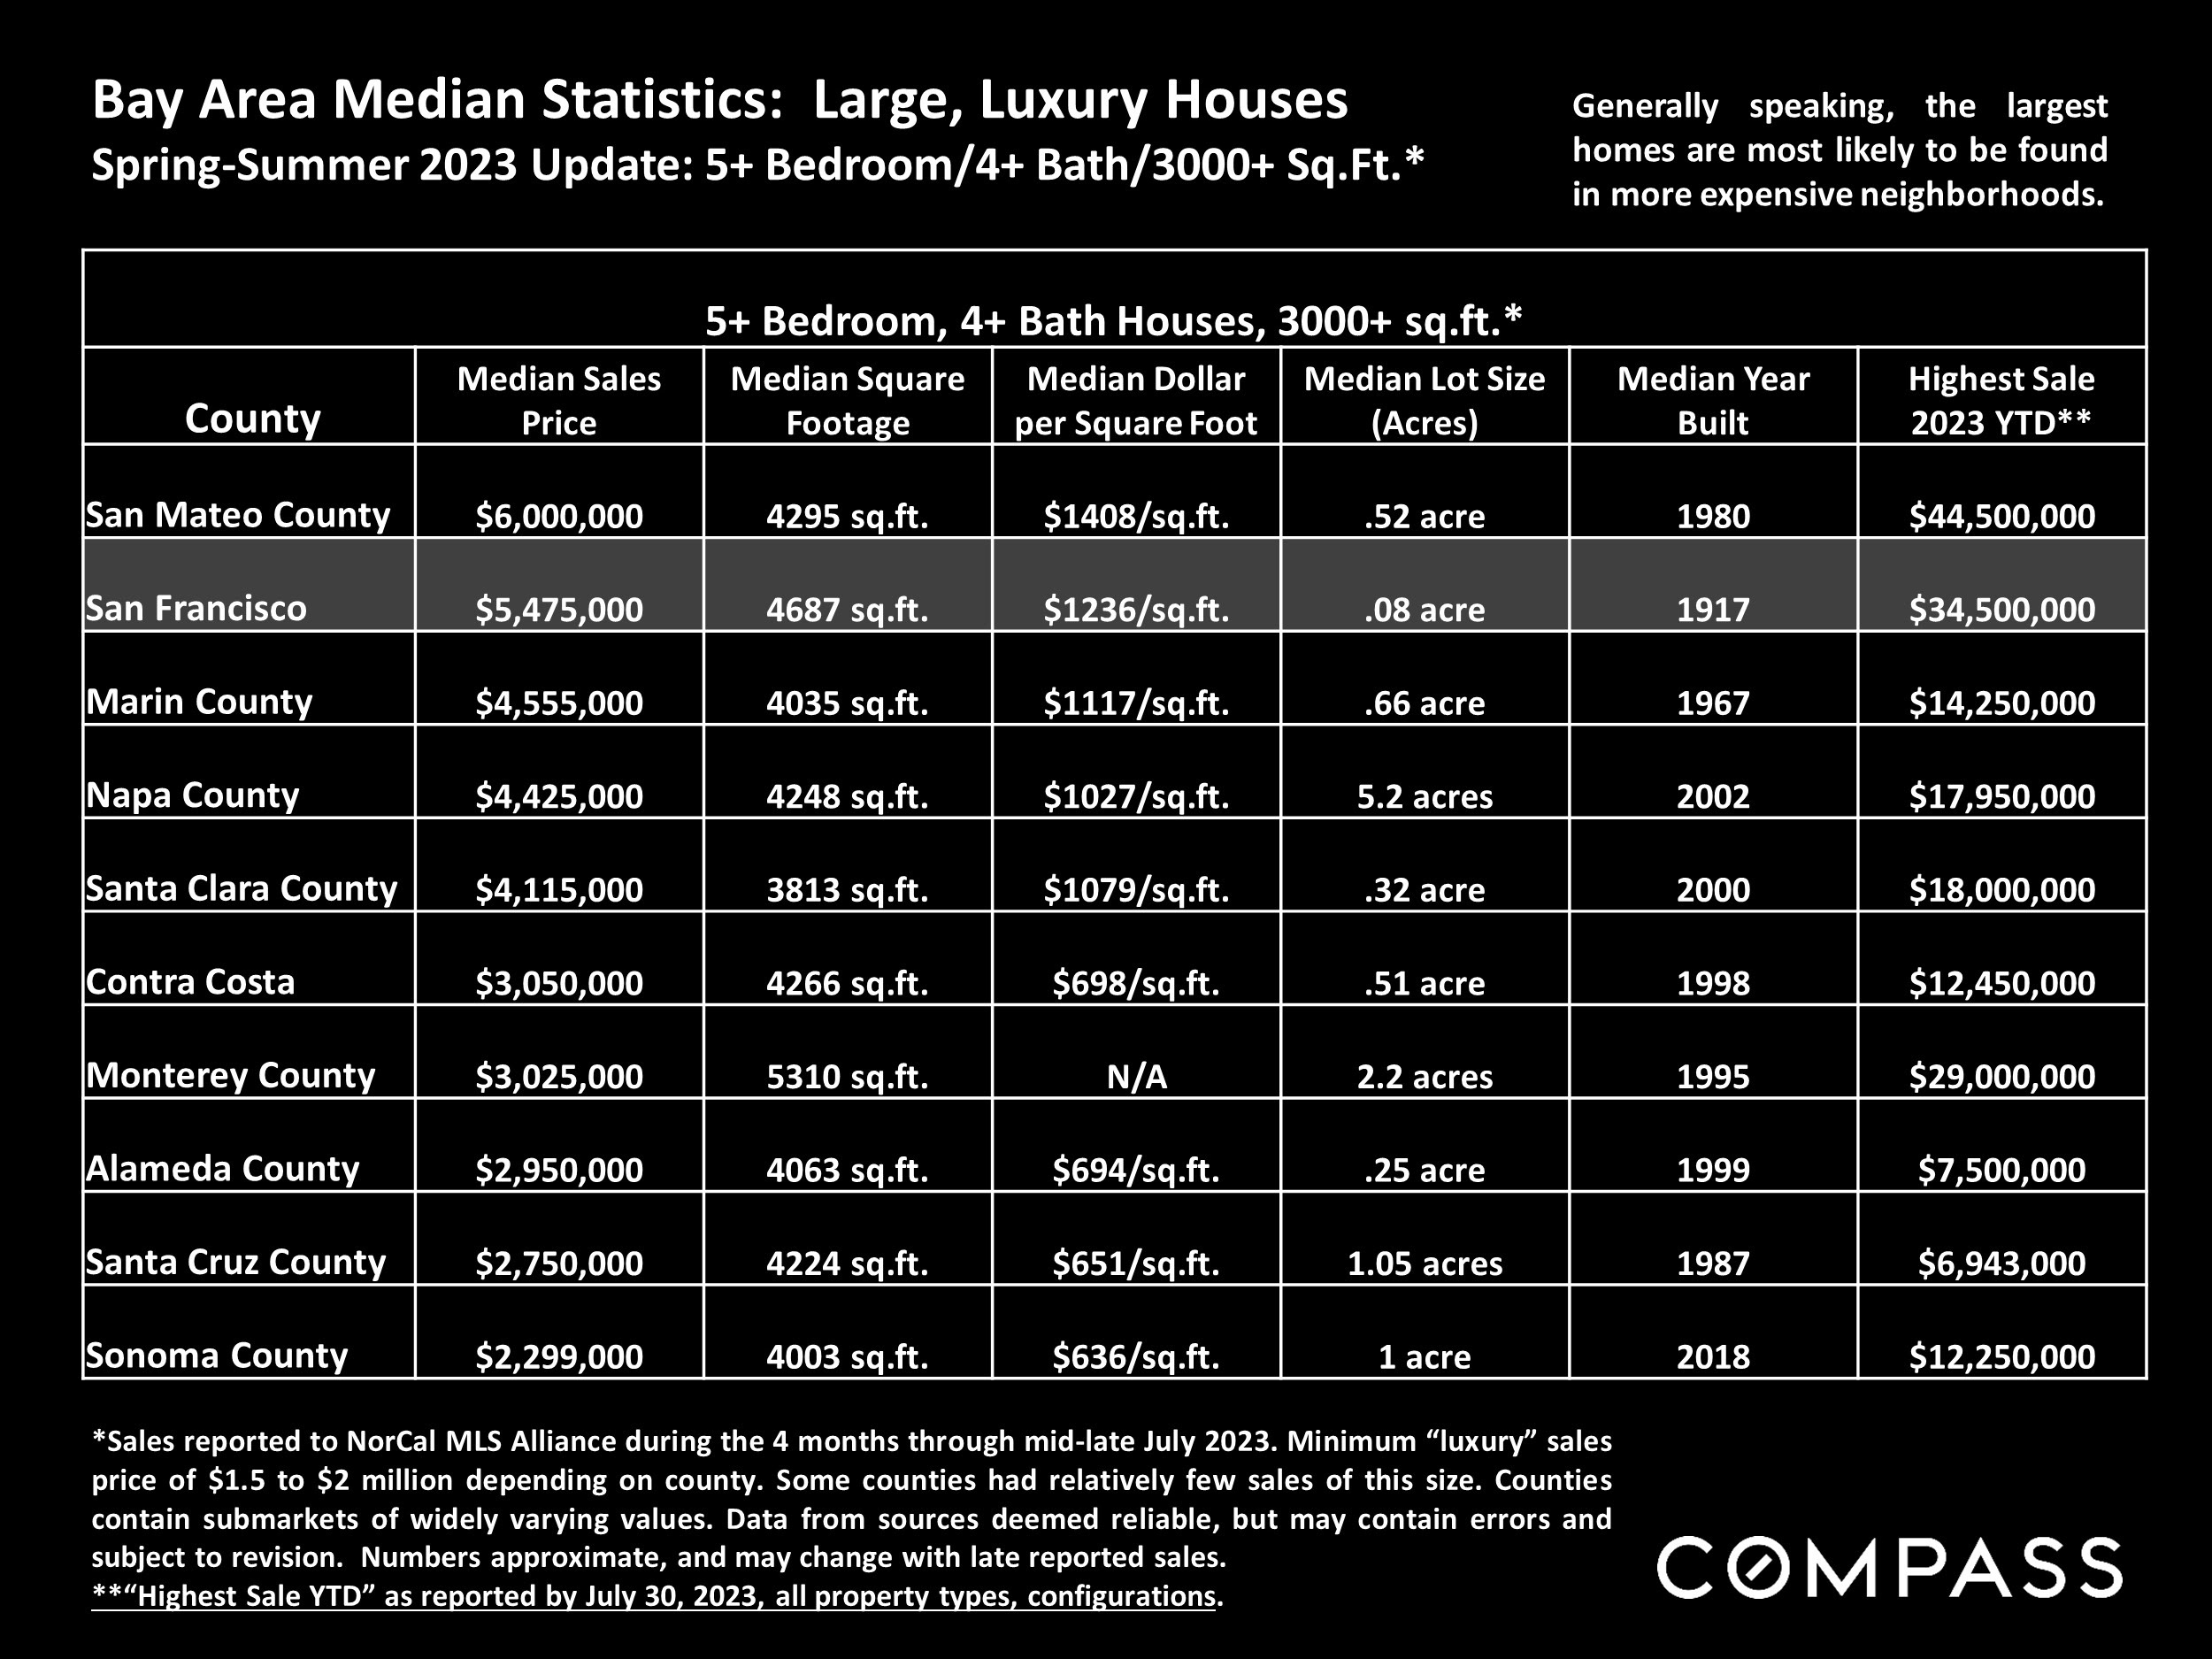
Bay Area luxury home statistics for large houses, comparing prices and property features across ten counties.

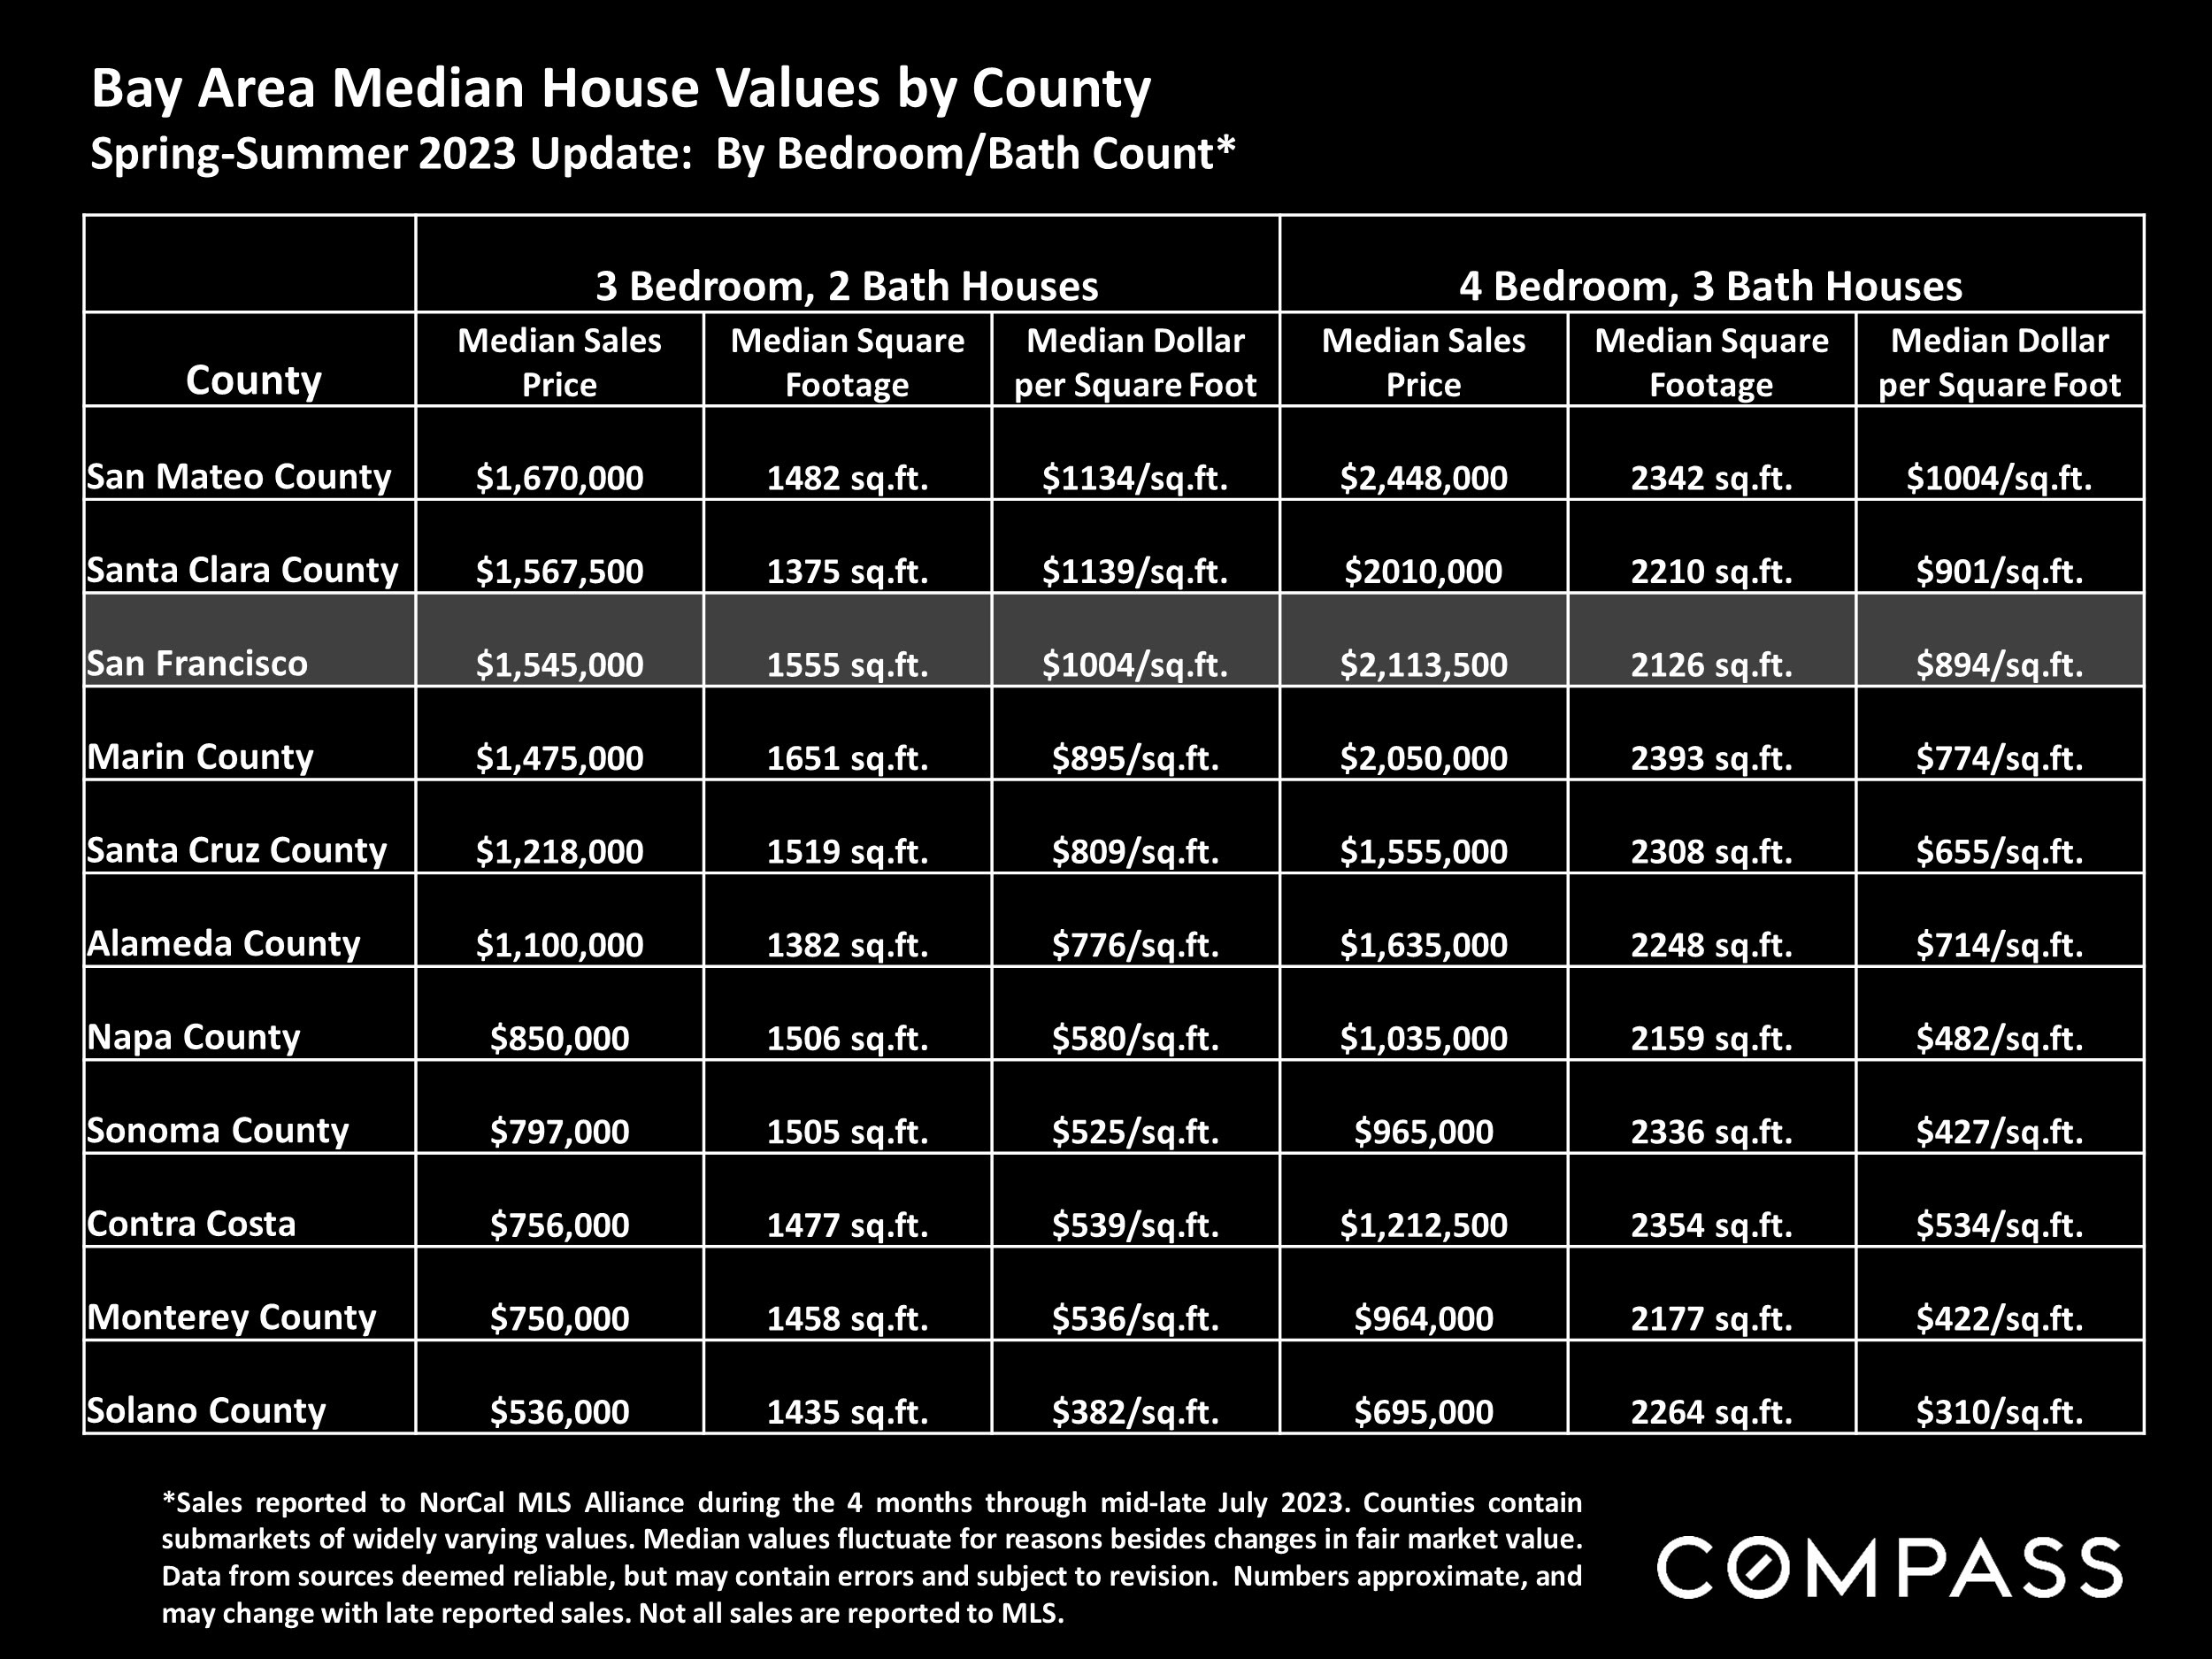
Bay Area county home-value table comparing three-bedroom and four-bedroom houses, with San Francisco highlighted.

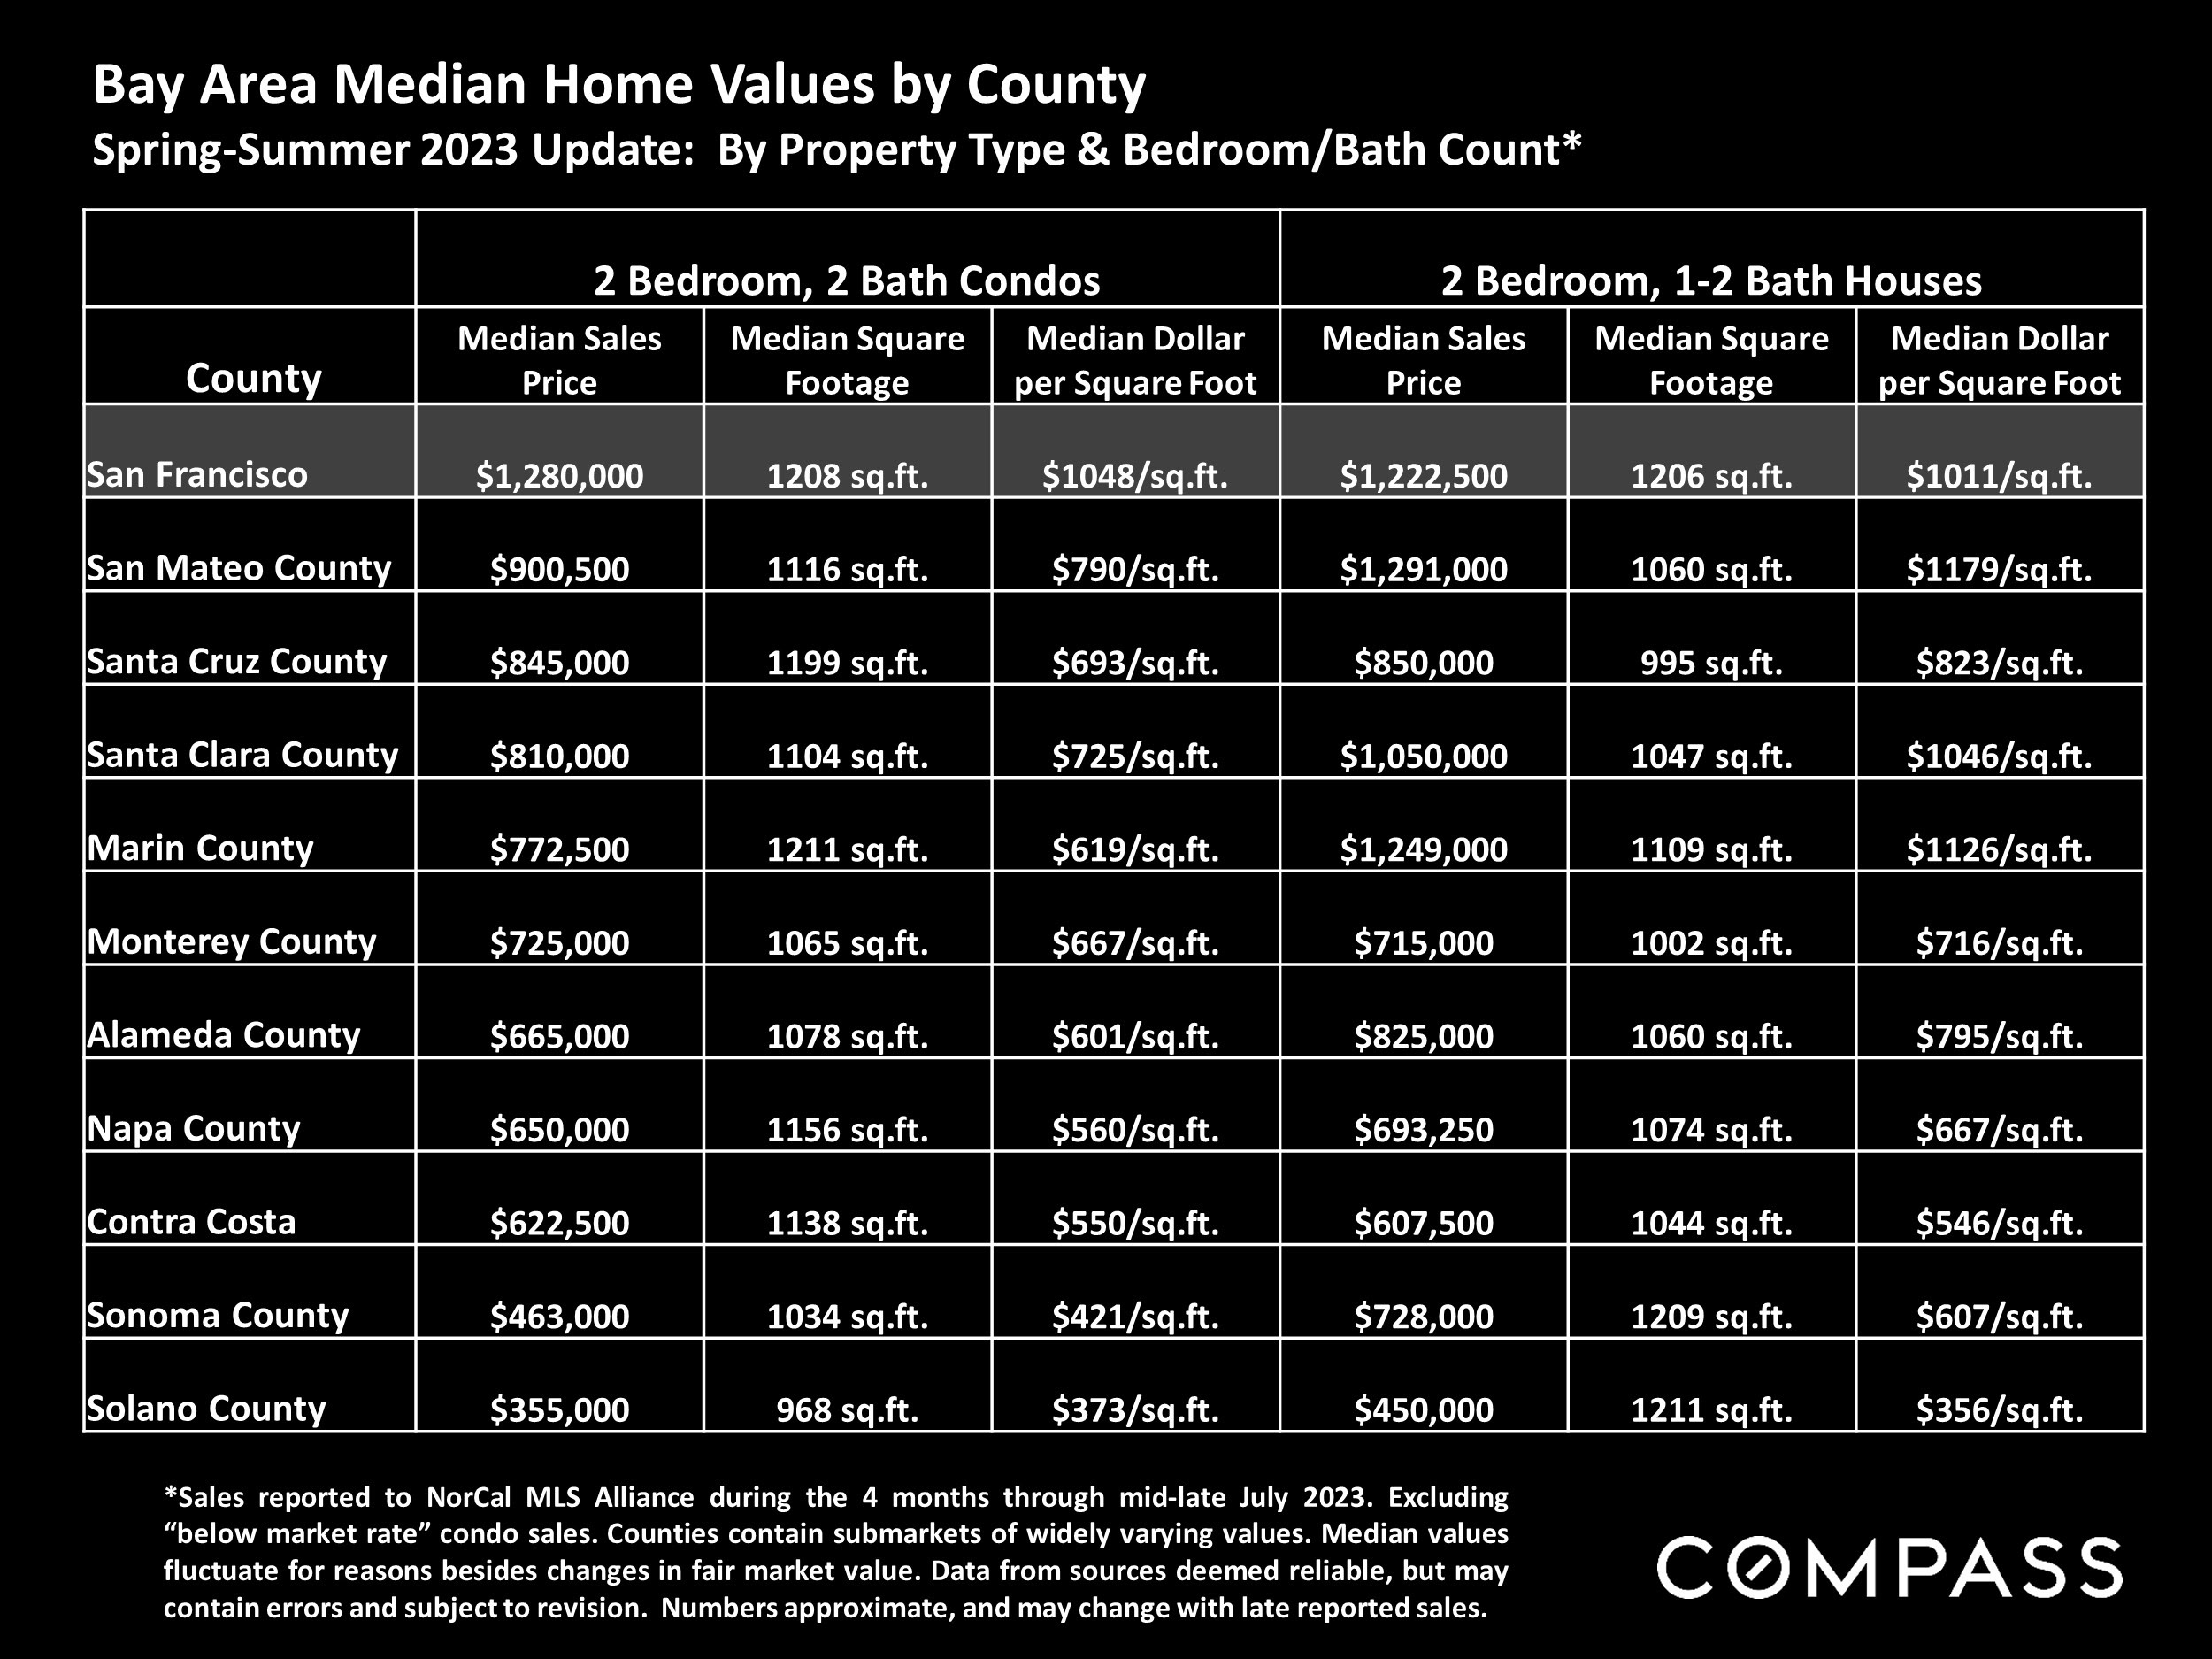
Table comparing 2023 median condo and house prices, square footage, and price per square foot across Bay Area counties.

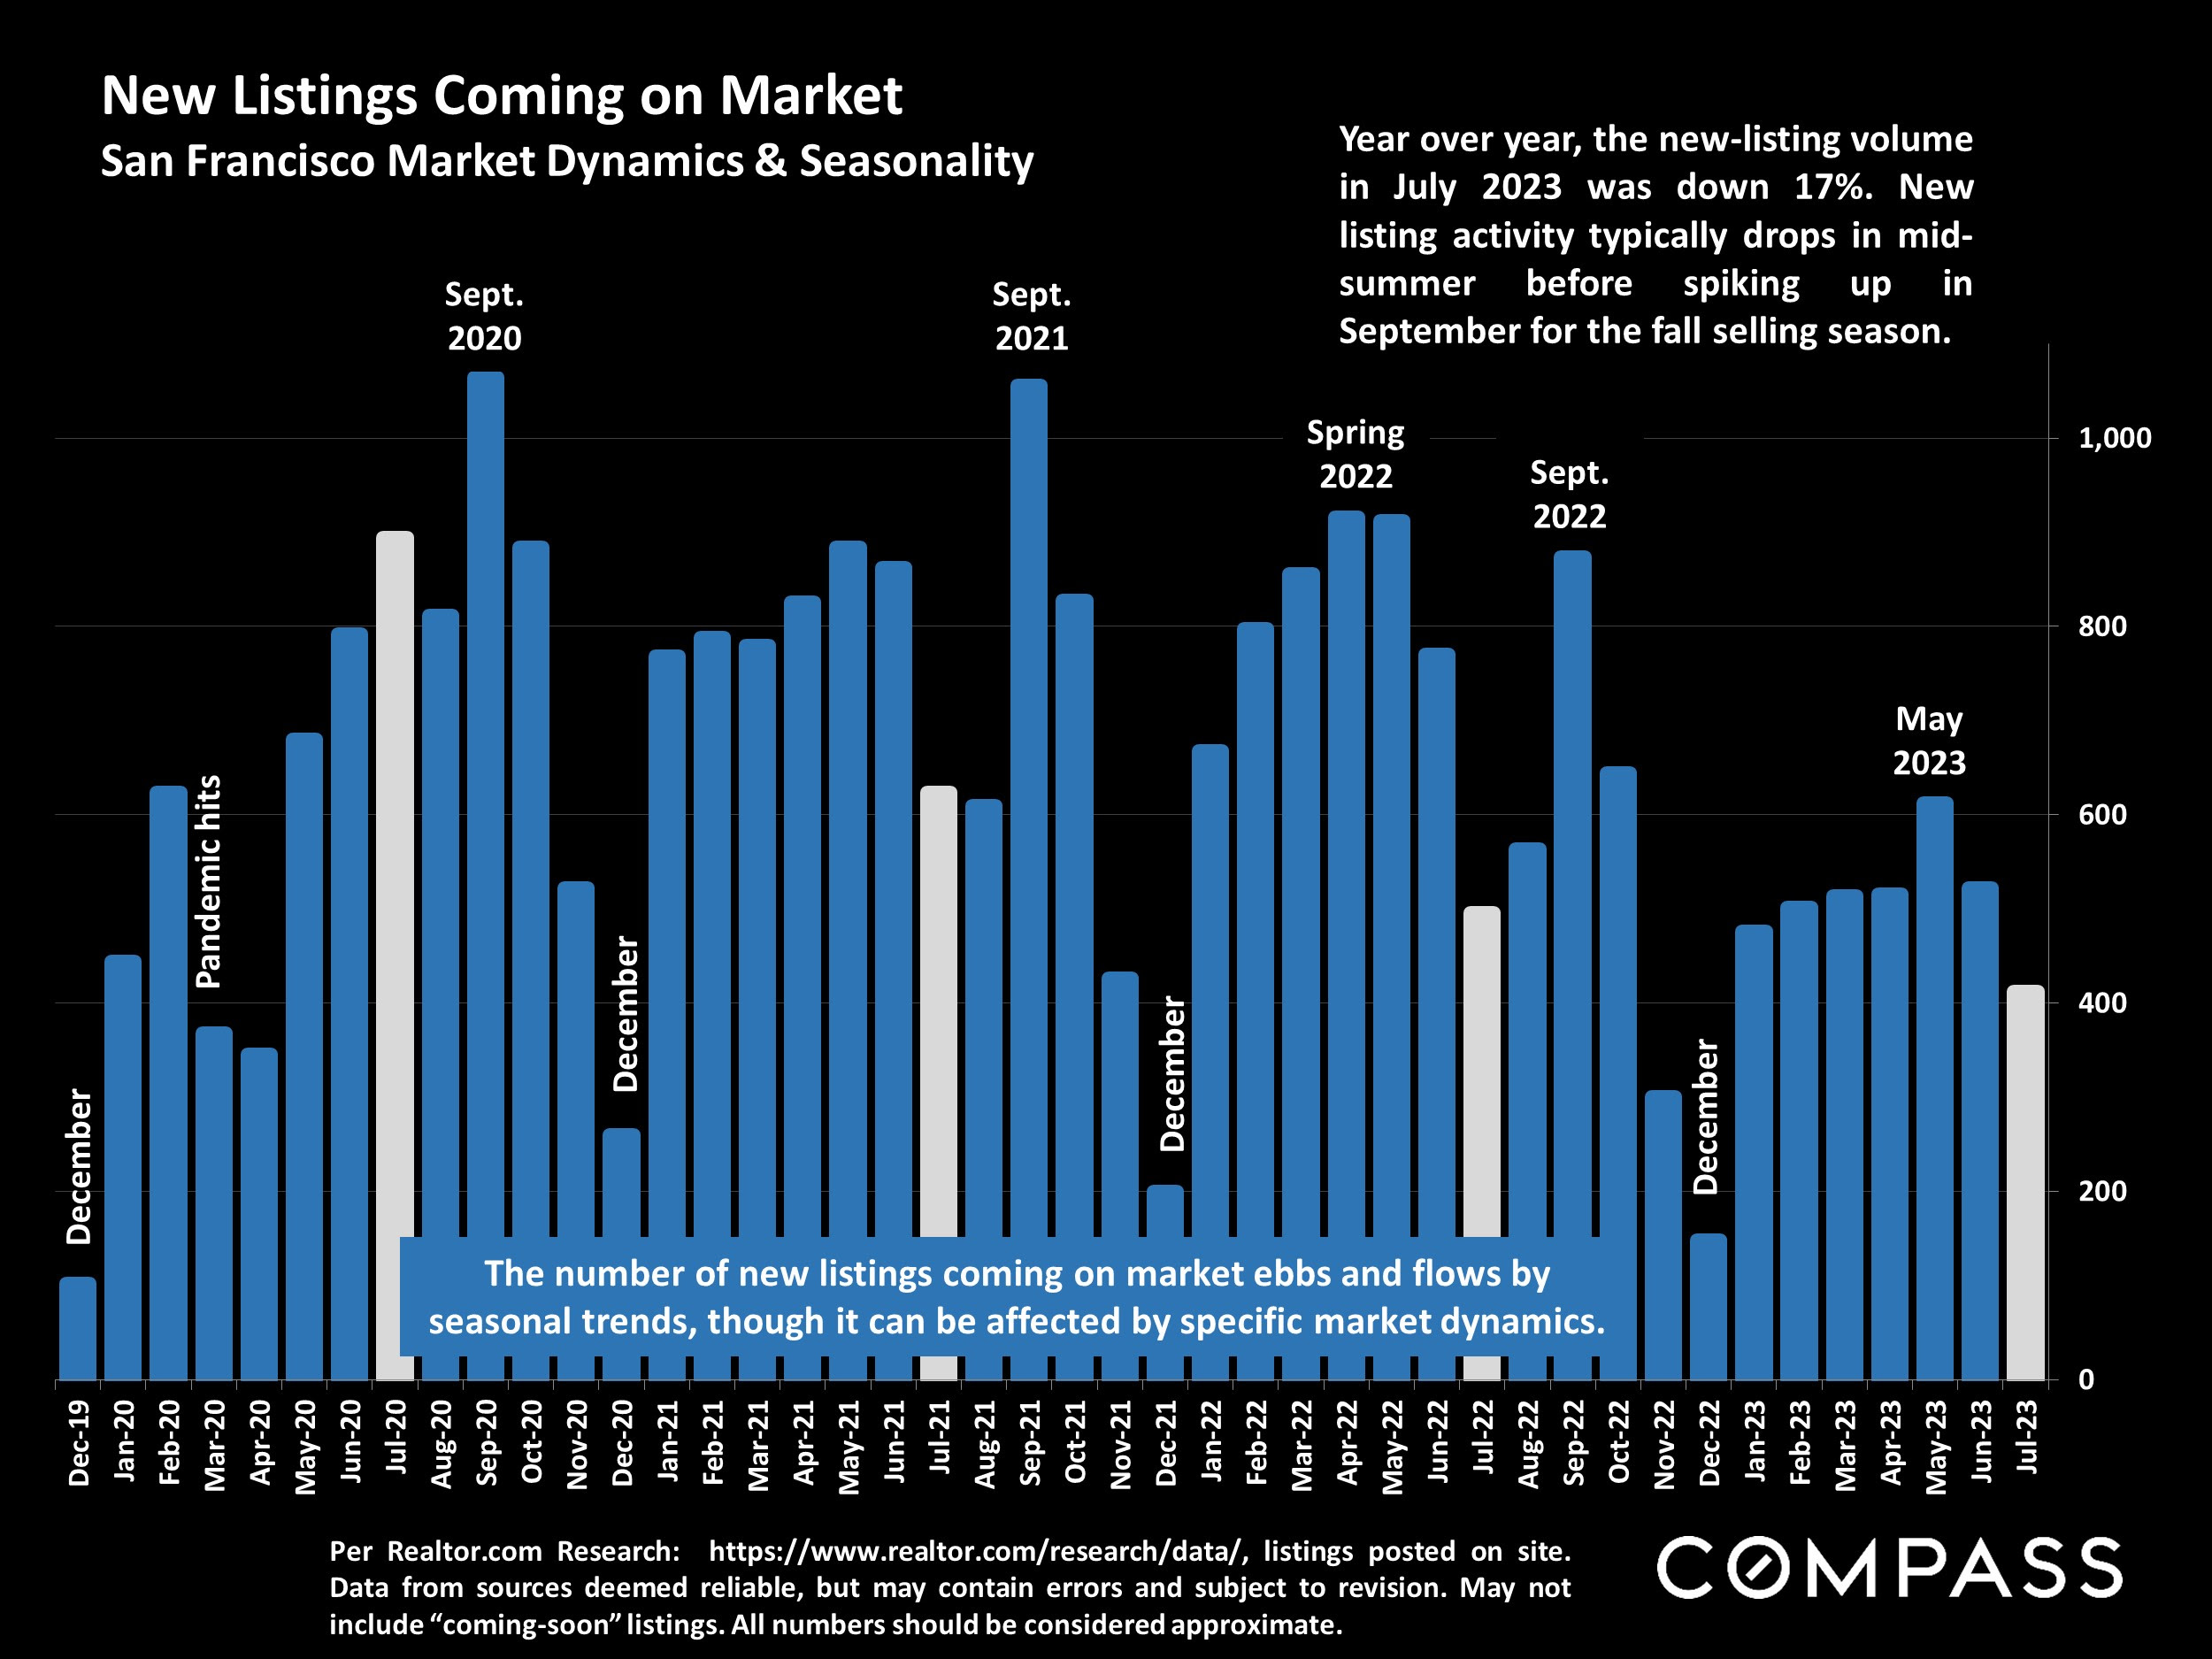
Chart of monthly San Francisco new listings from December 2019 to July 2023, with seasonal patterns and a July 2023 decline.

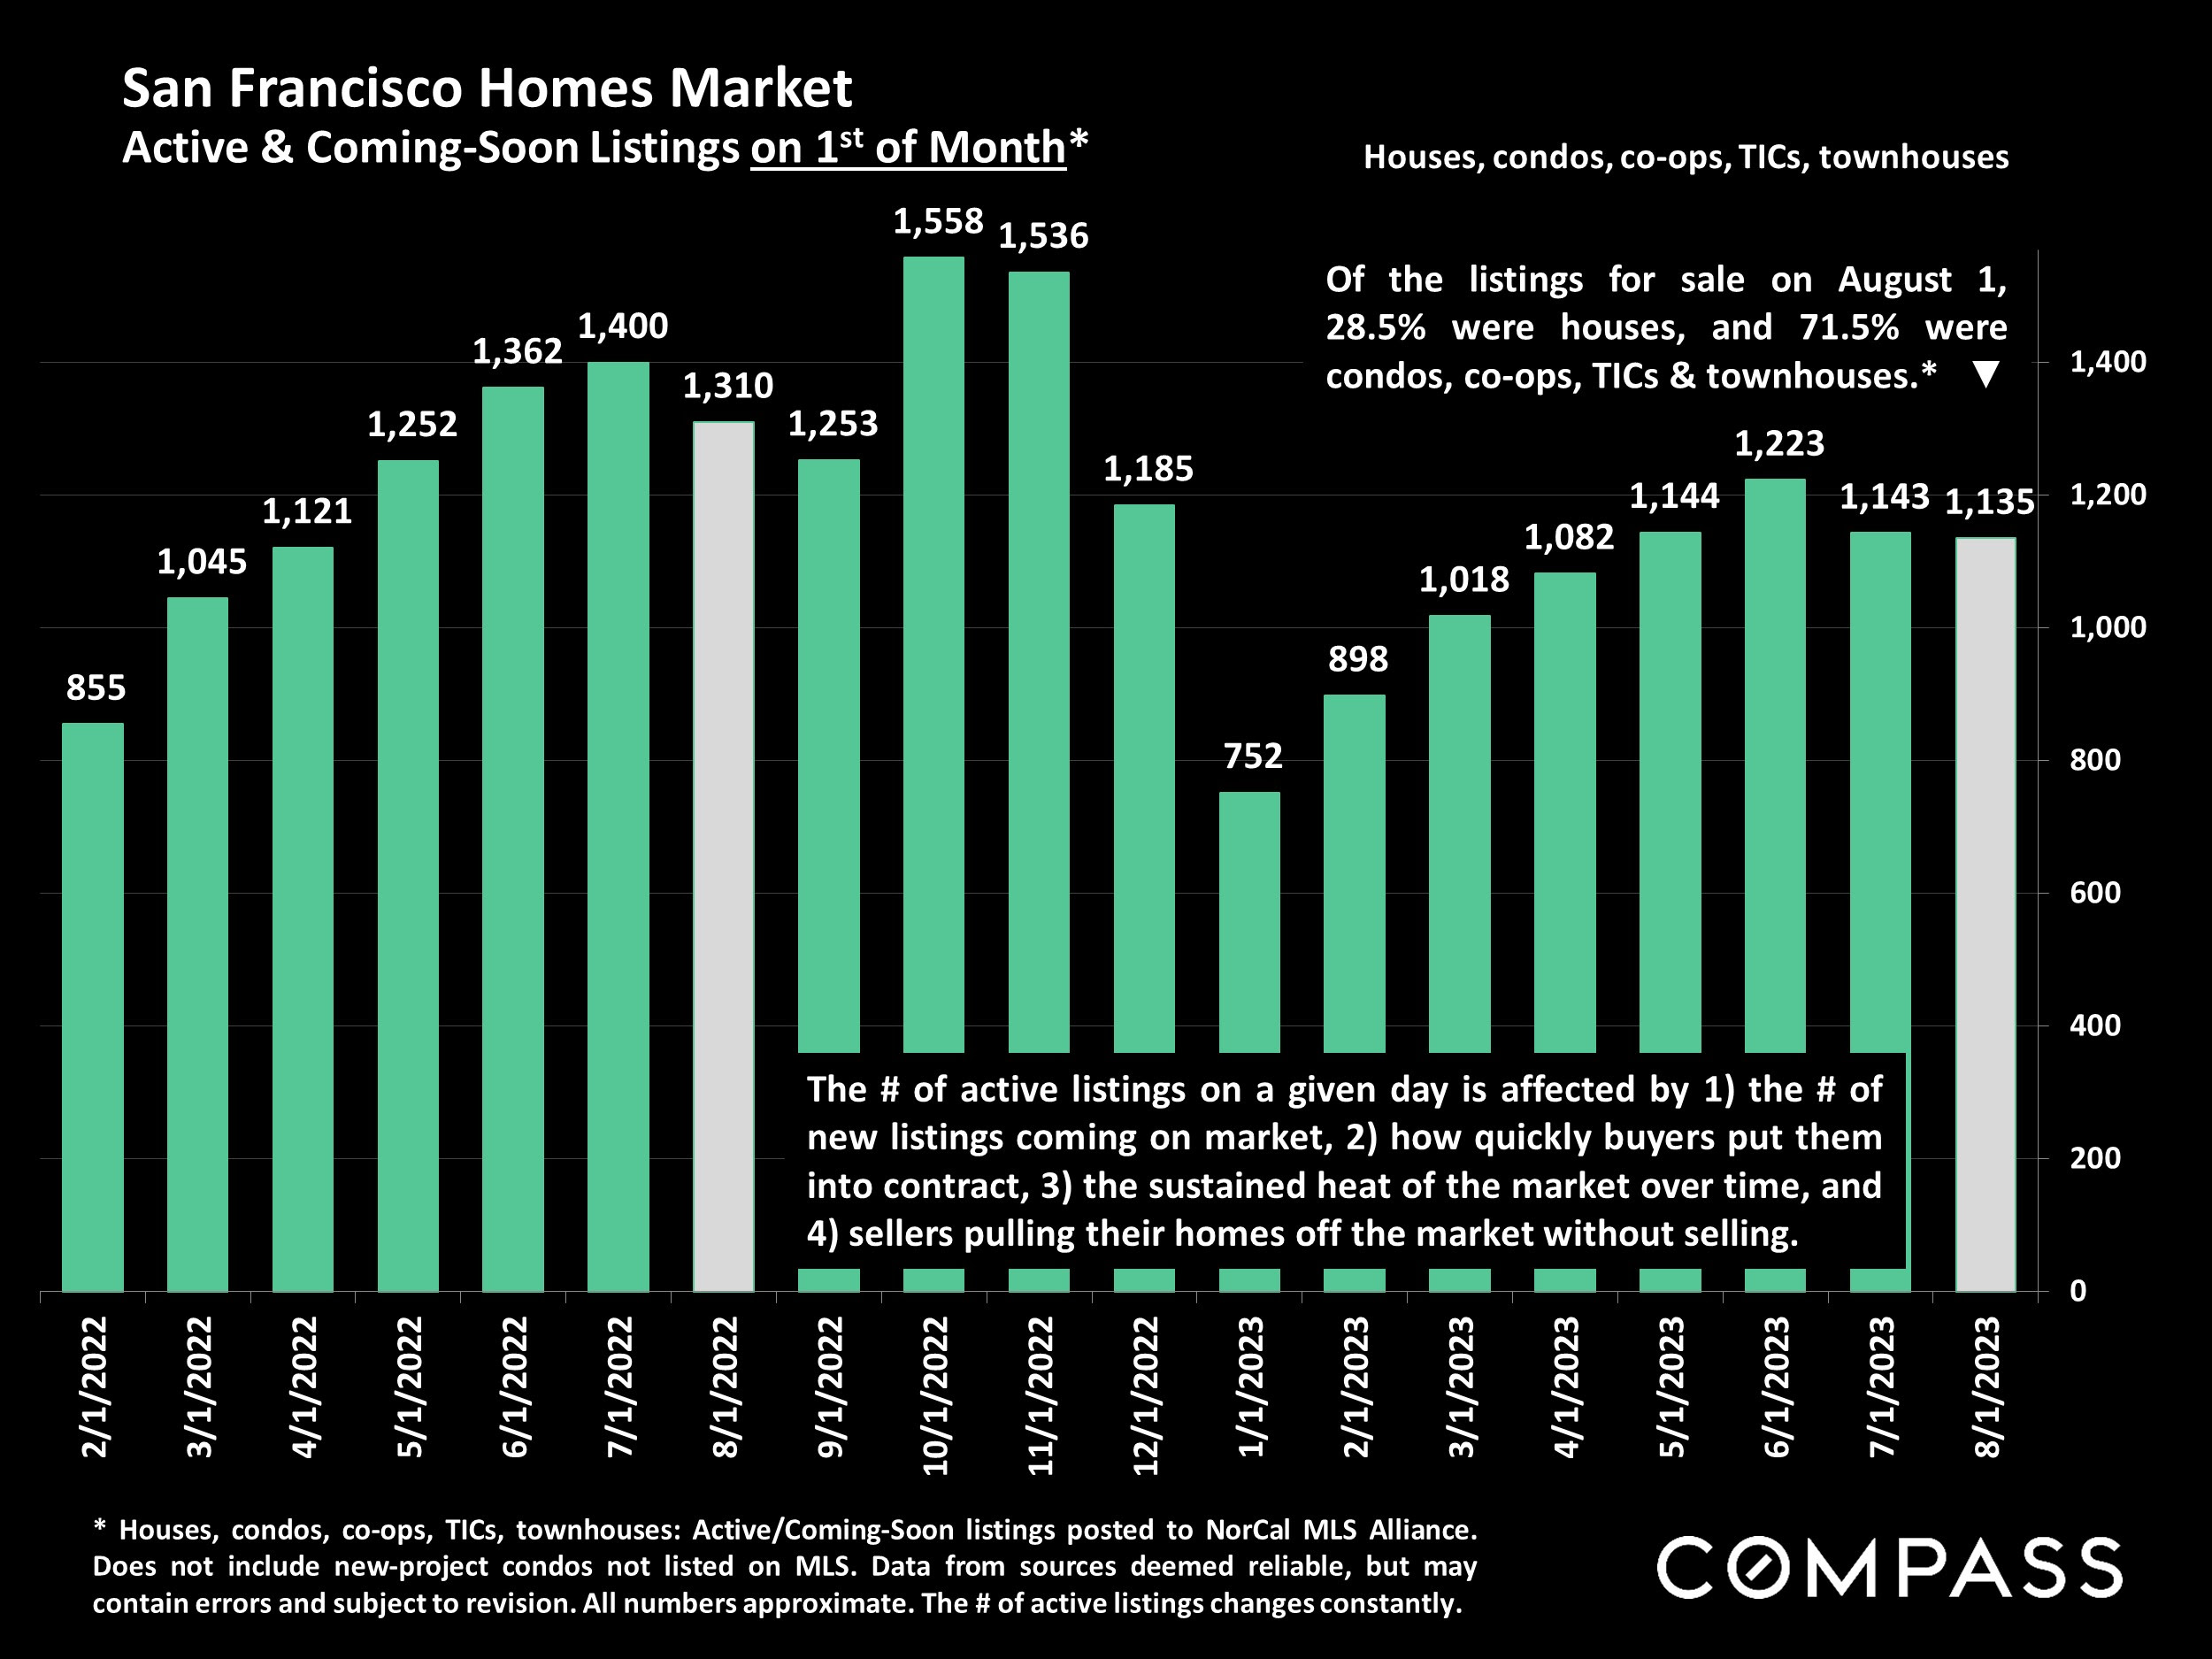
Chart of San Francisco active listings from February 2022 to August 2023, with August 2023 showing 1,135 listings.

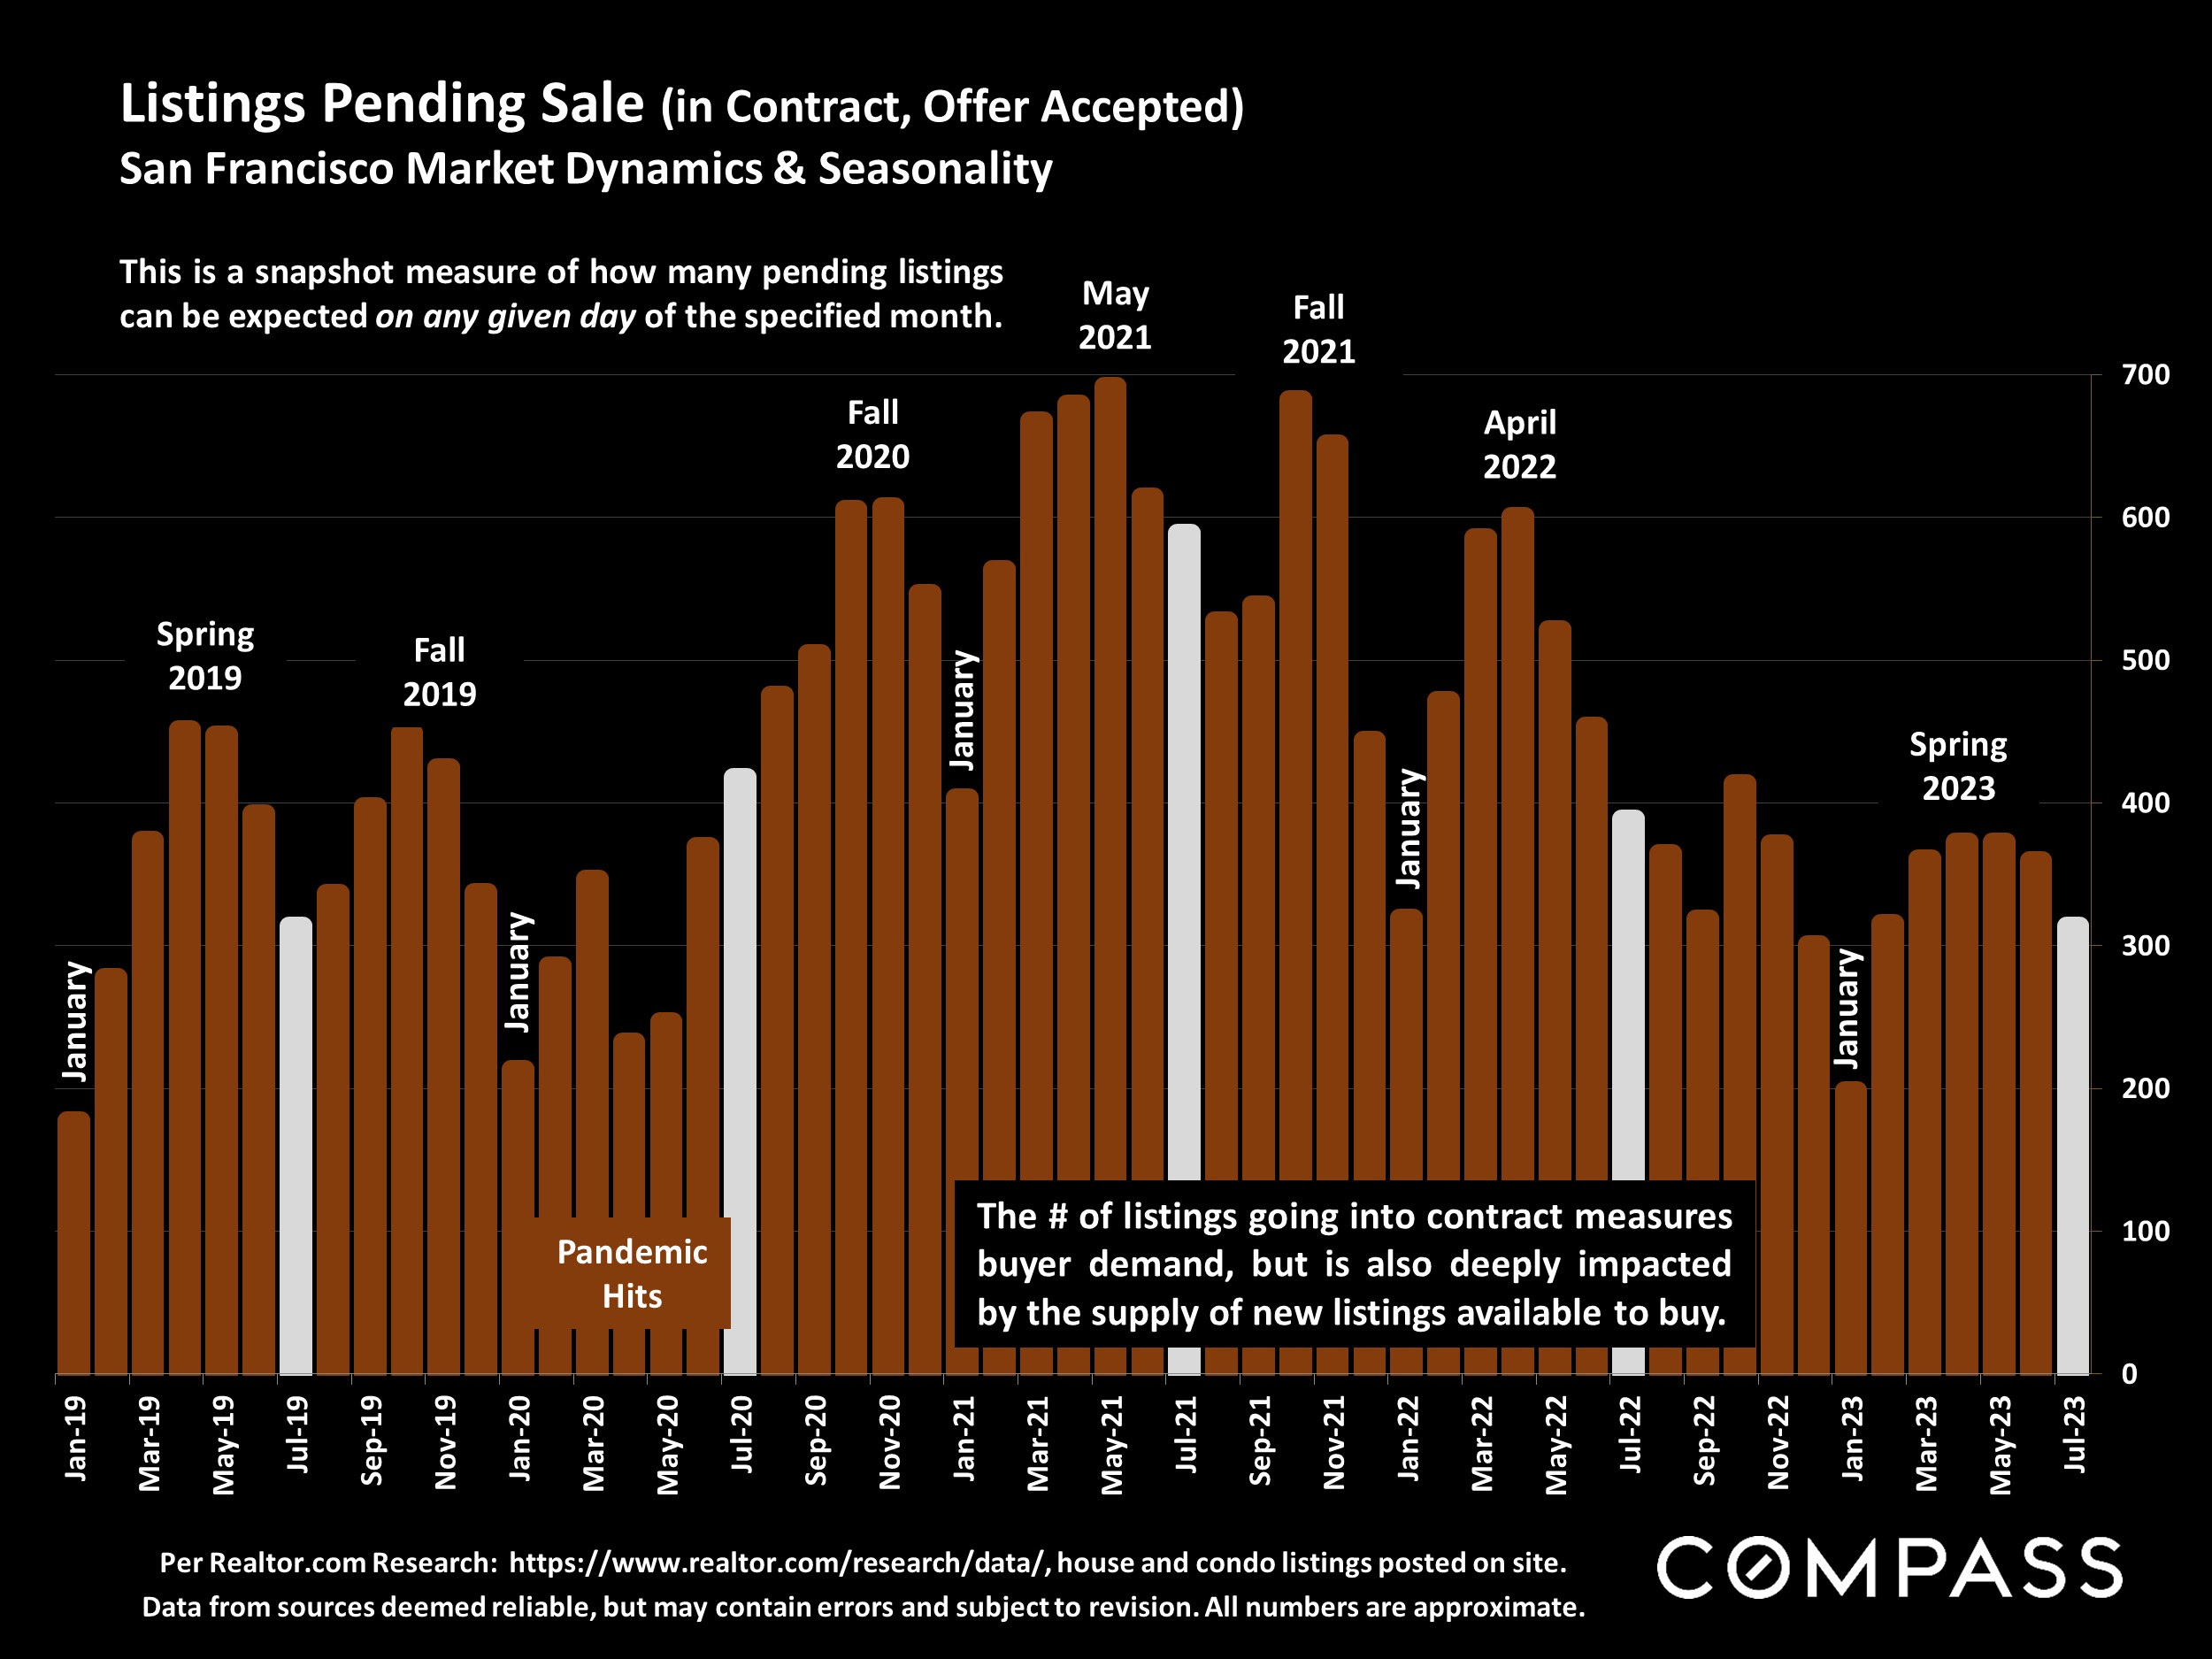
Bar chart of San Francisco pending listings, January 2019–July 2023, with seasonal trends and a pandemic marker.

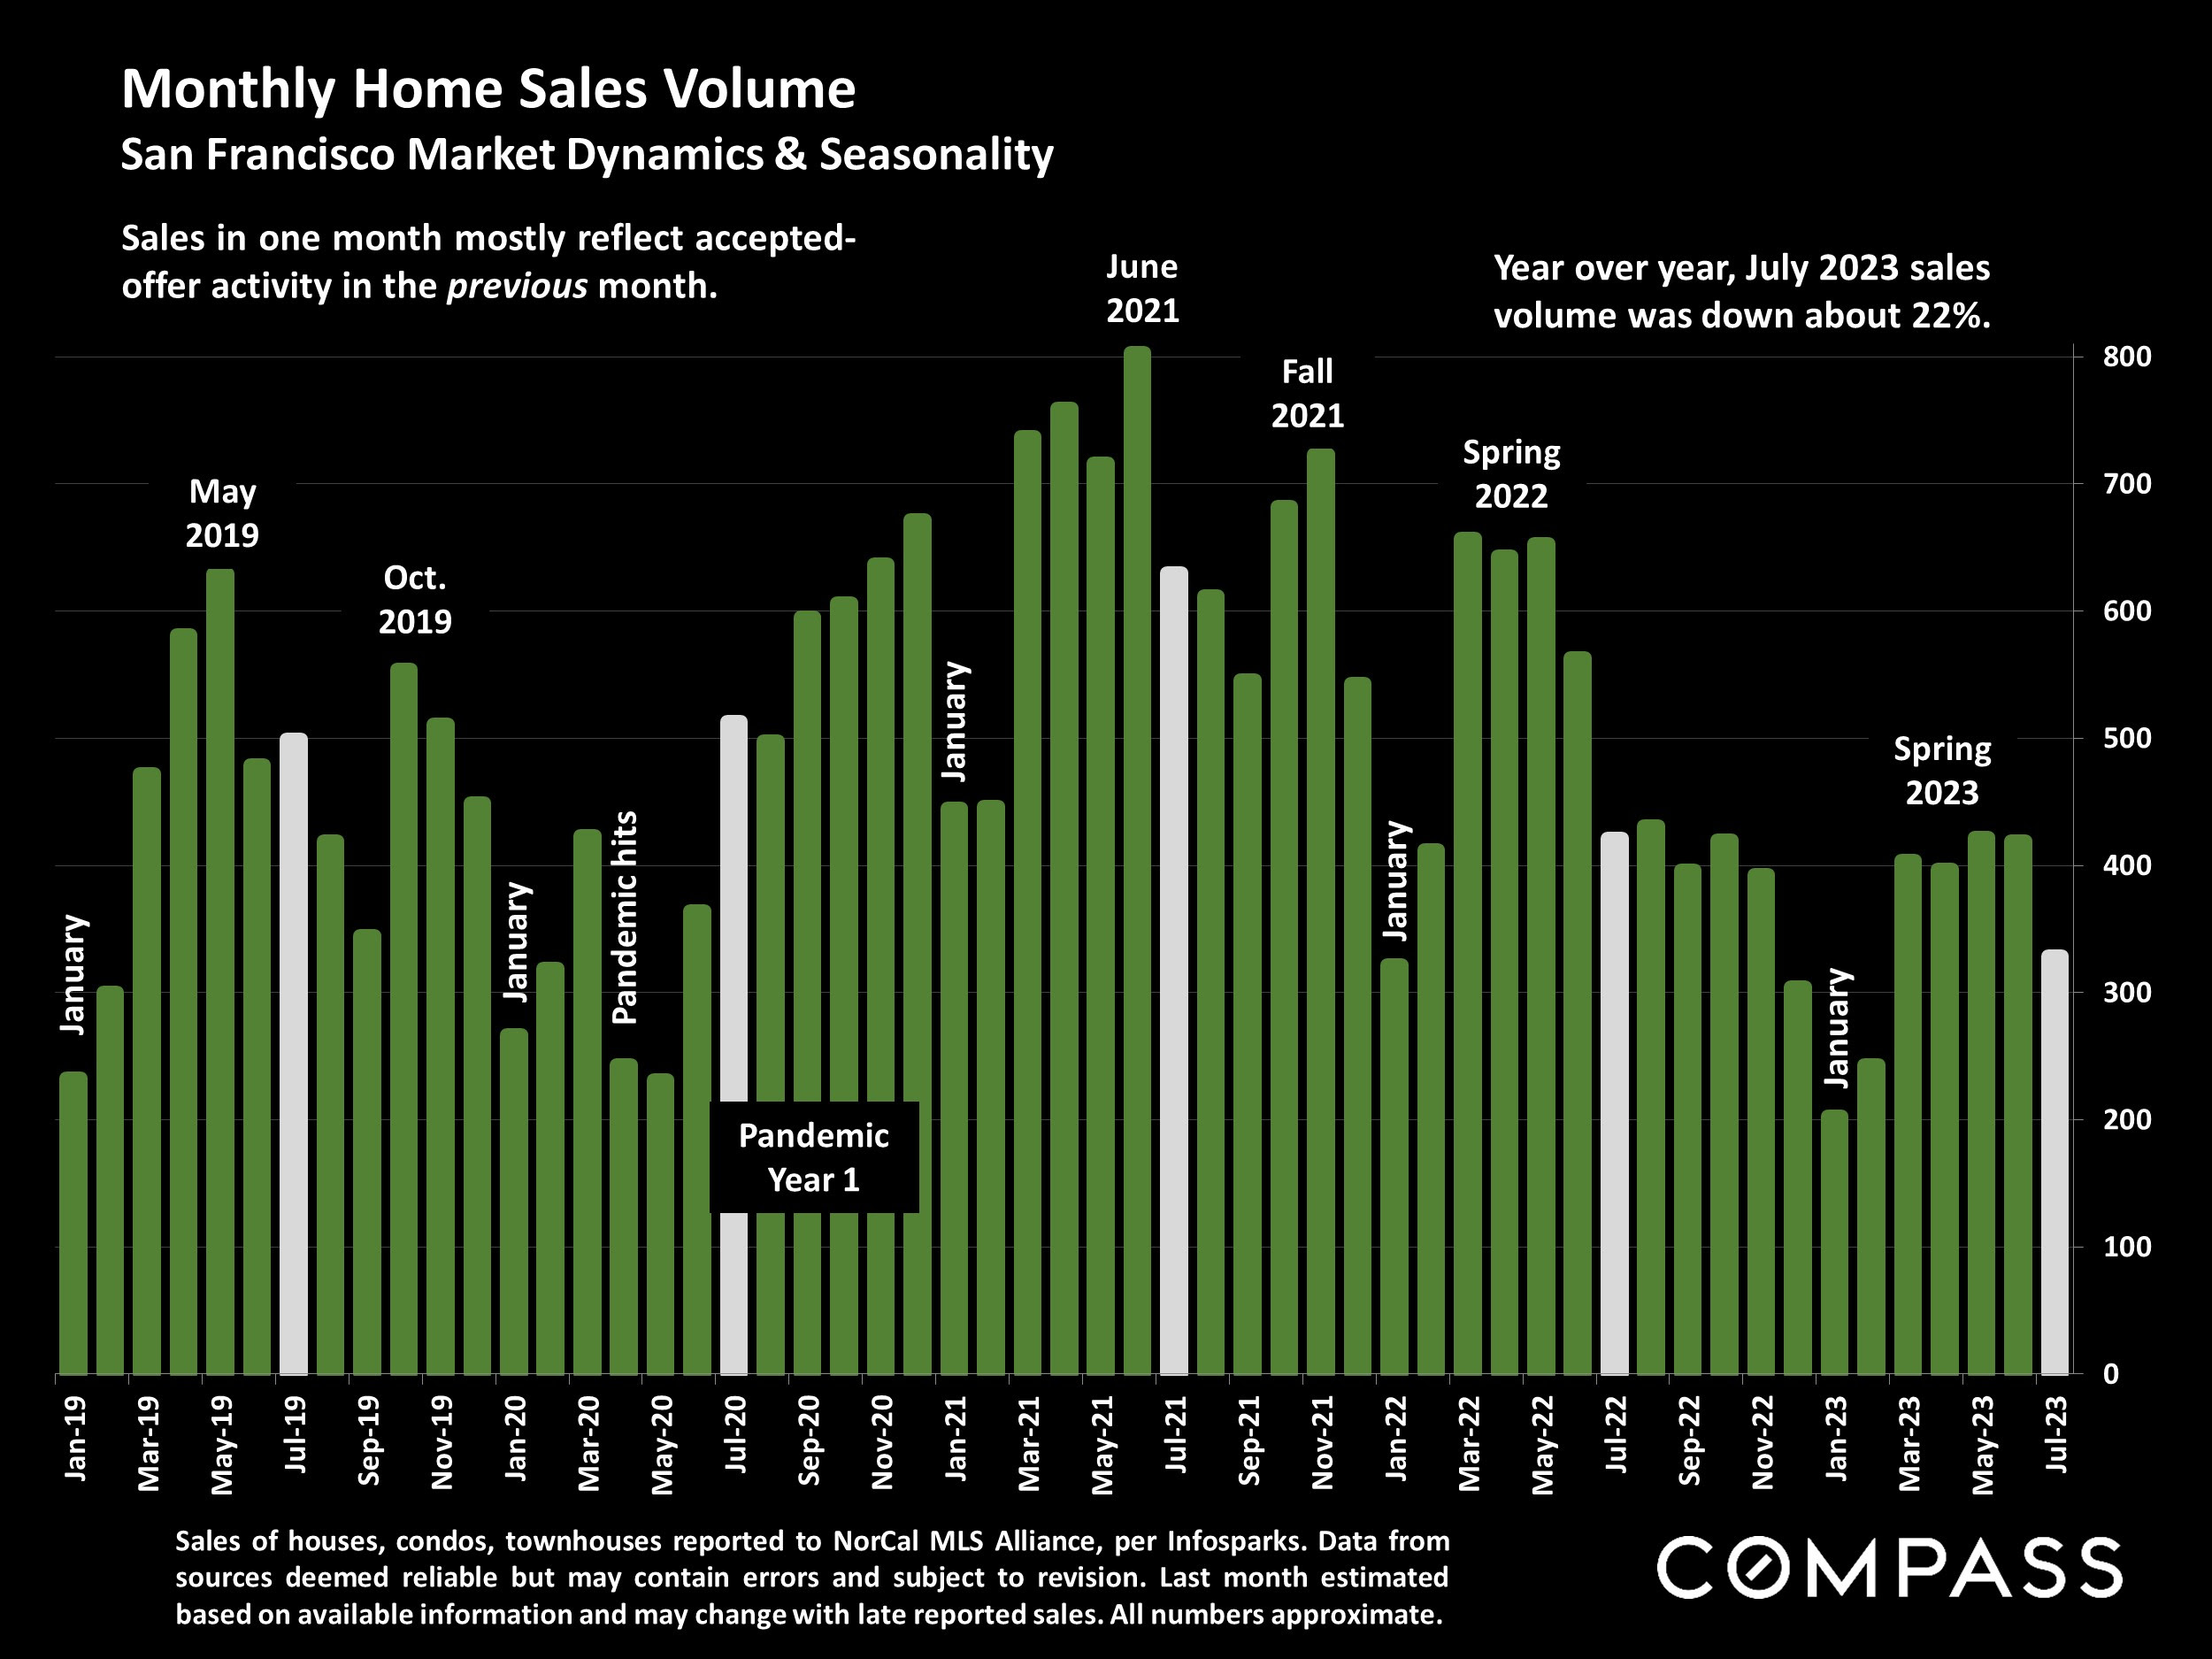
Bar chart of monthly San Francisco home sales, January 2019–July 2023, with seasonal and pandemic annotations.

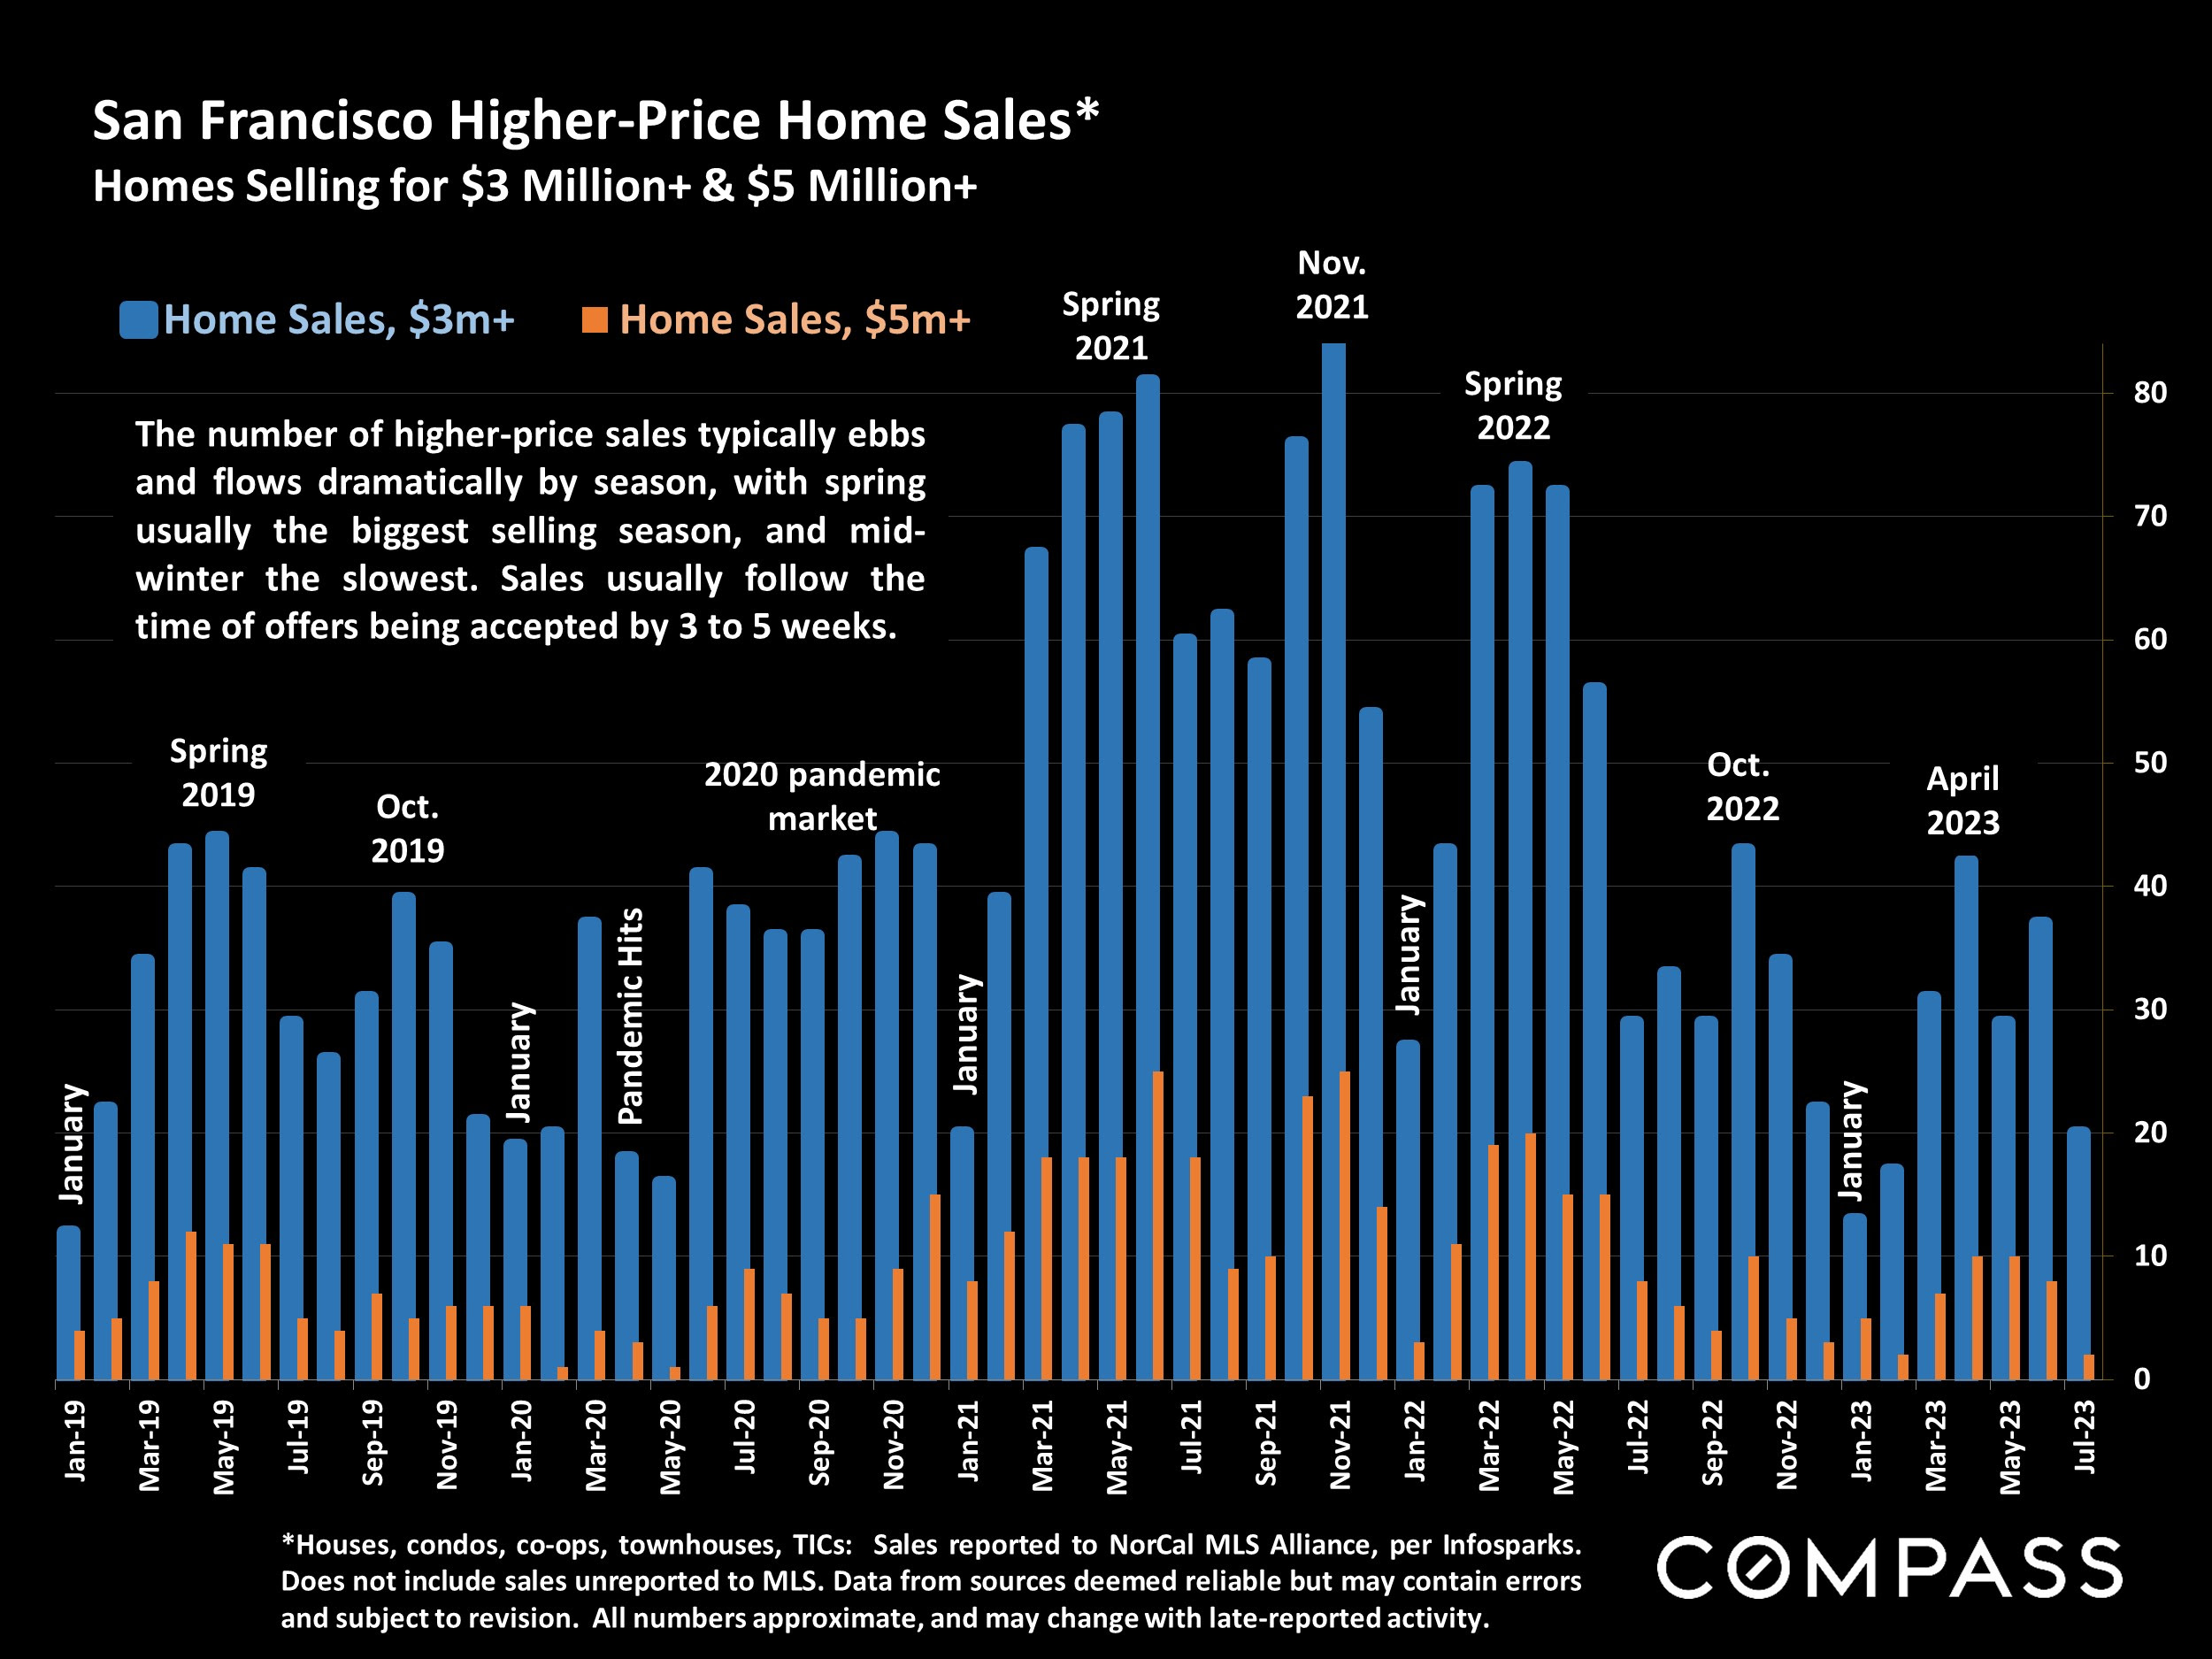
Bar chart comparing San Francisco sales of homes priced at $3 million or more and $5 million or more, 2019–2023.

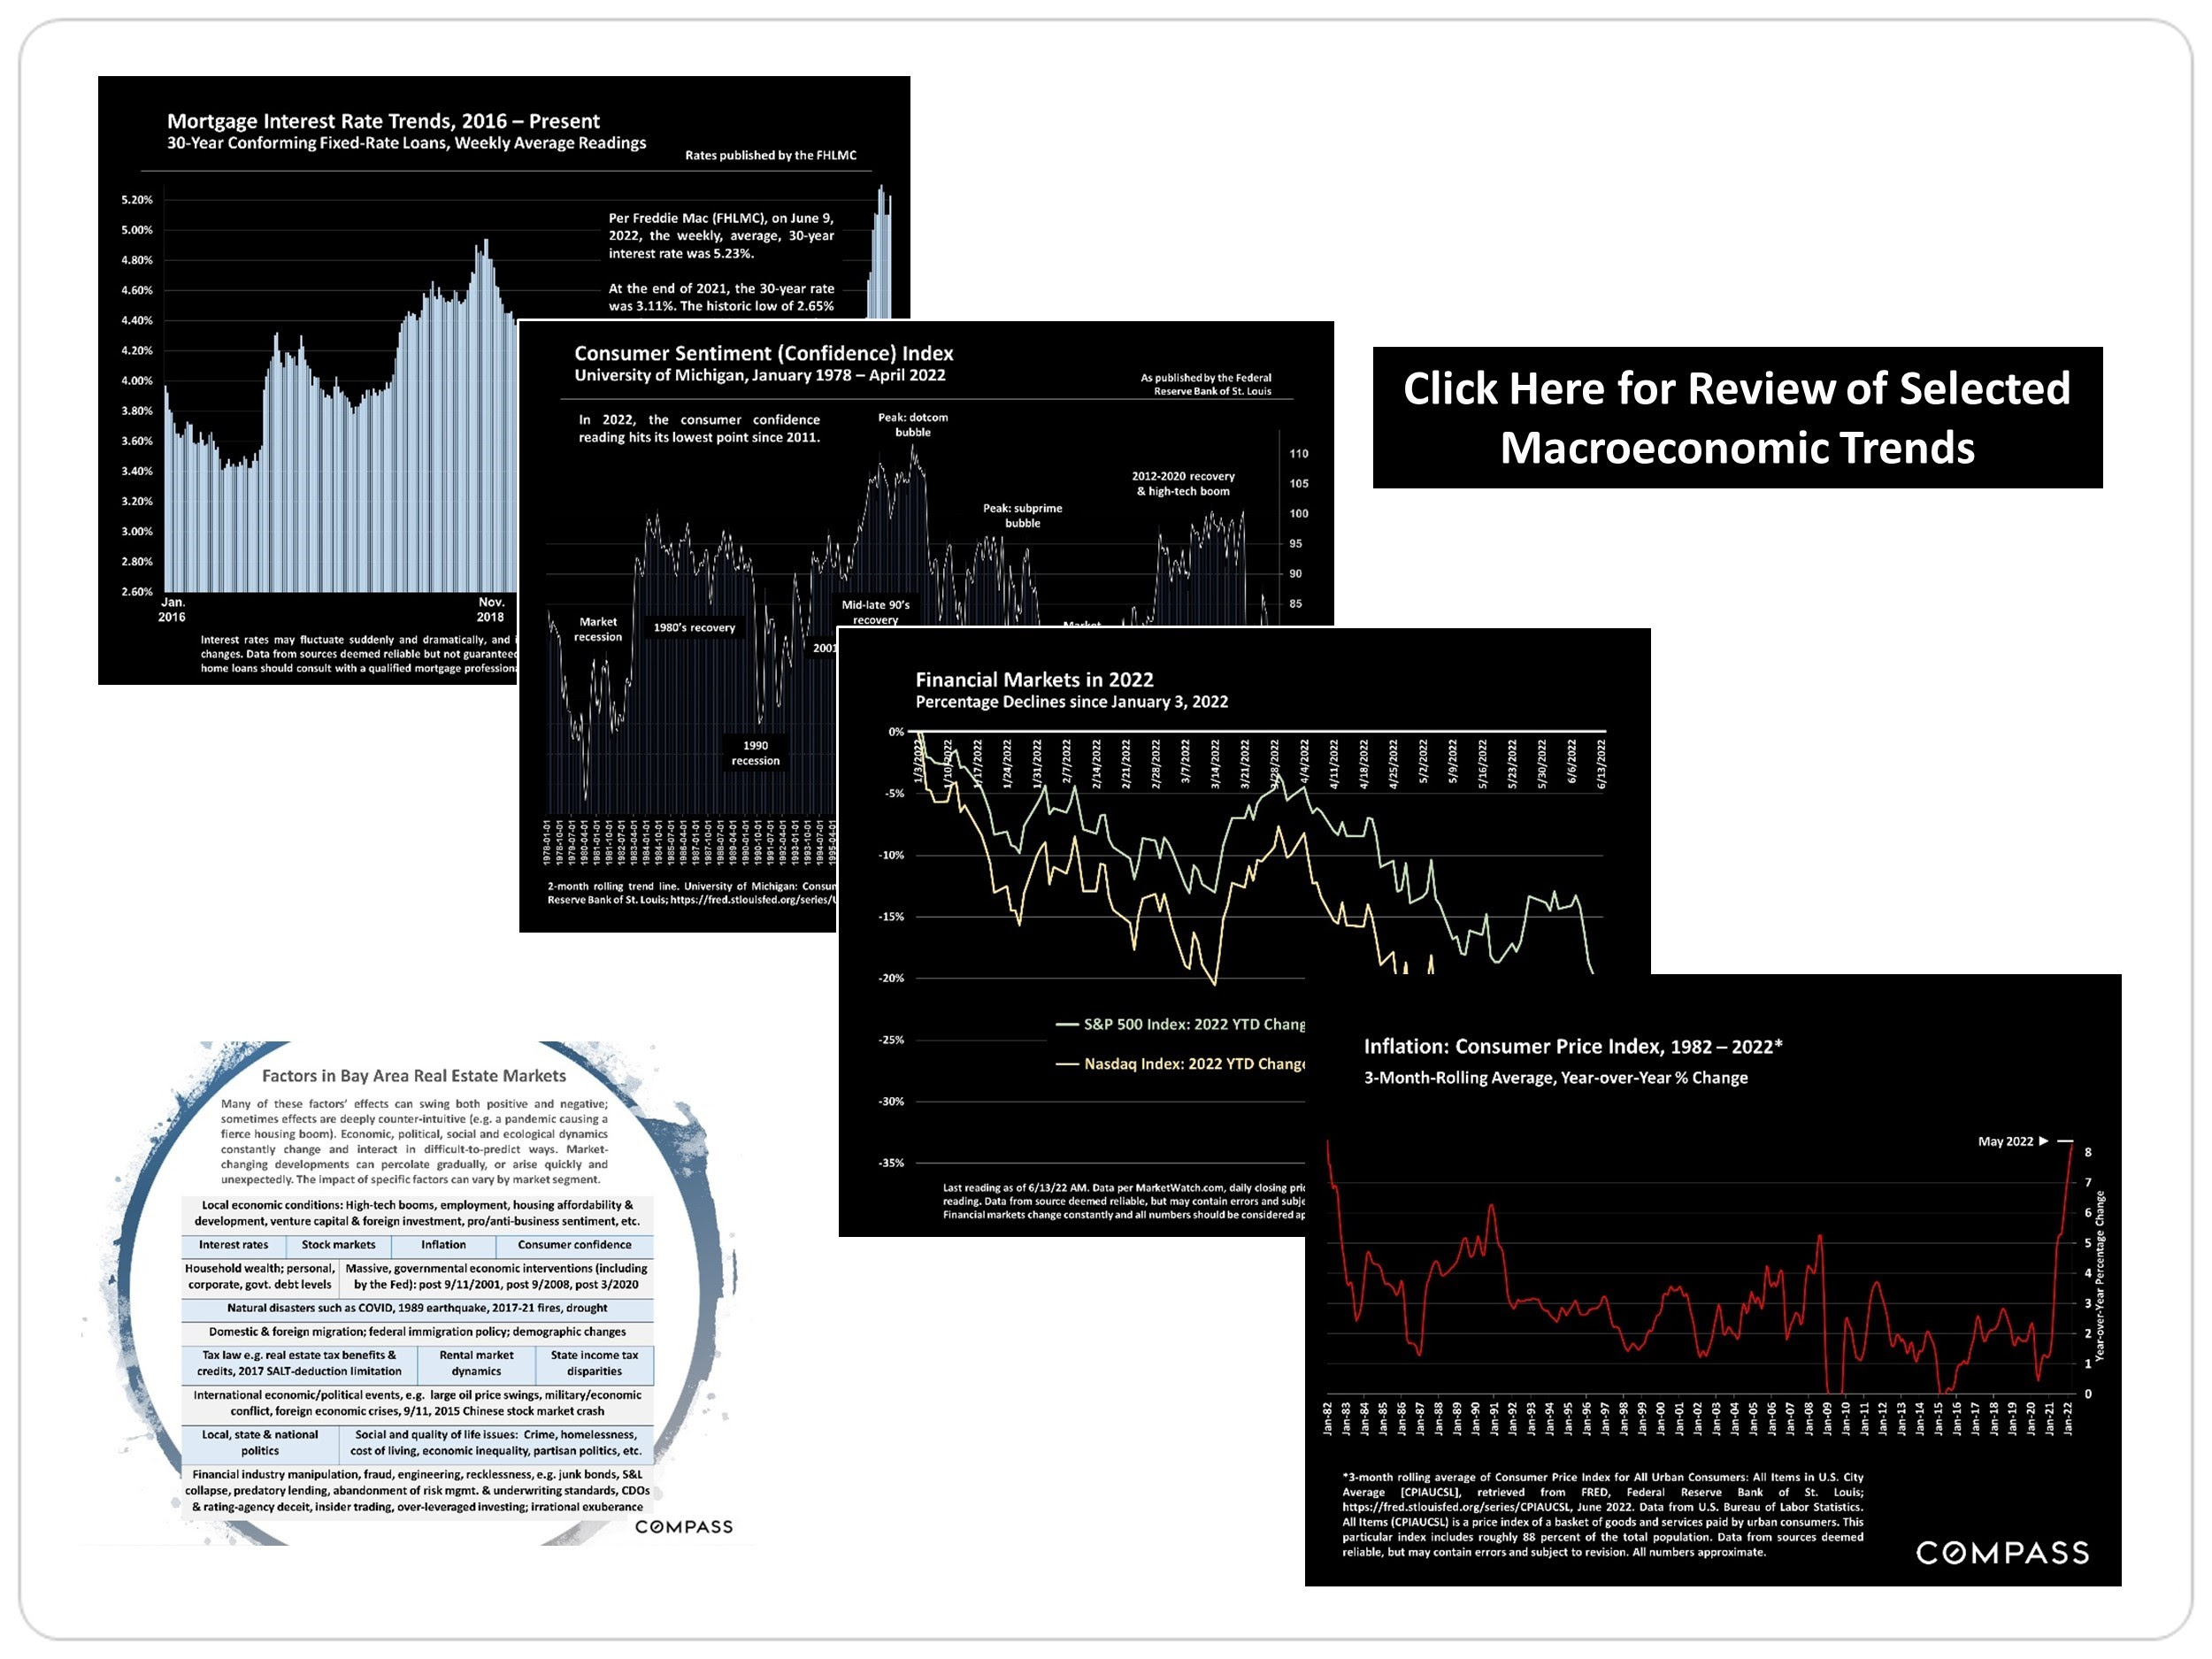
Macroeconomic charts on mortgage rates, consumer confidence, financial markets, inflation, and factors affecting Bay Area real estate.

Work With Jason

Drawing on his decade of experience in finance, investment management, and holistic financial planning, and as a Chartered Financial Analyst ( CFA ® ) charterholder, he leverages his financial acumen and analytical focus to help his clients navigate the sophisticated San Francisco market.
Contact
Follow Us