San Francisco Real Estate Market Update | April 2025

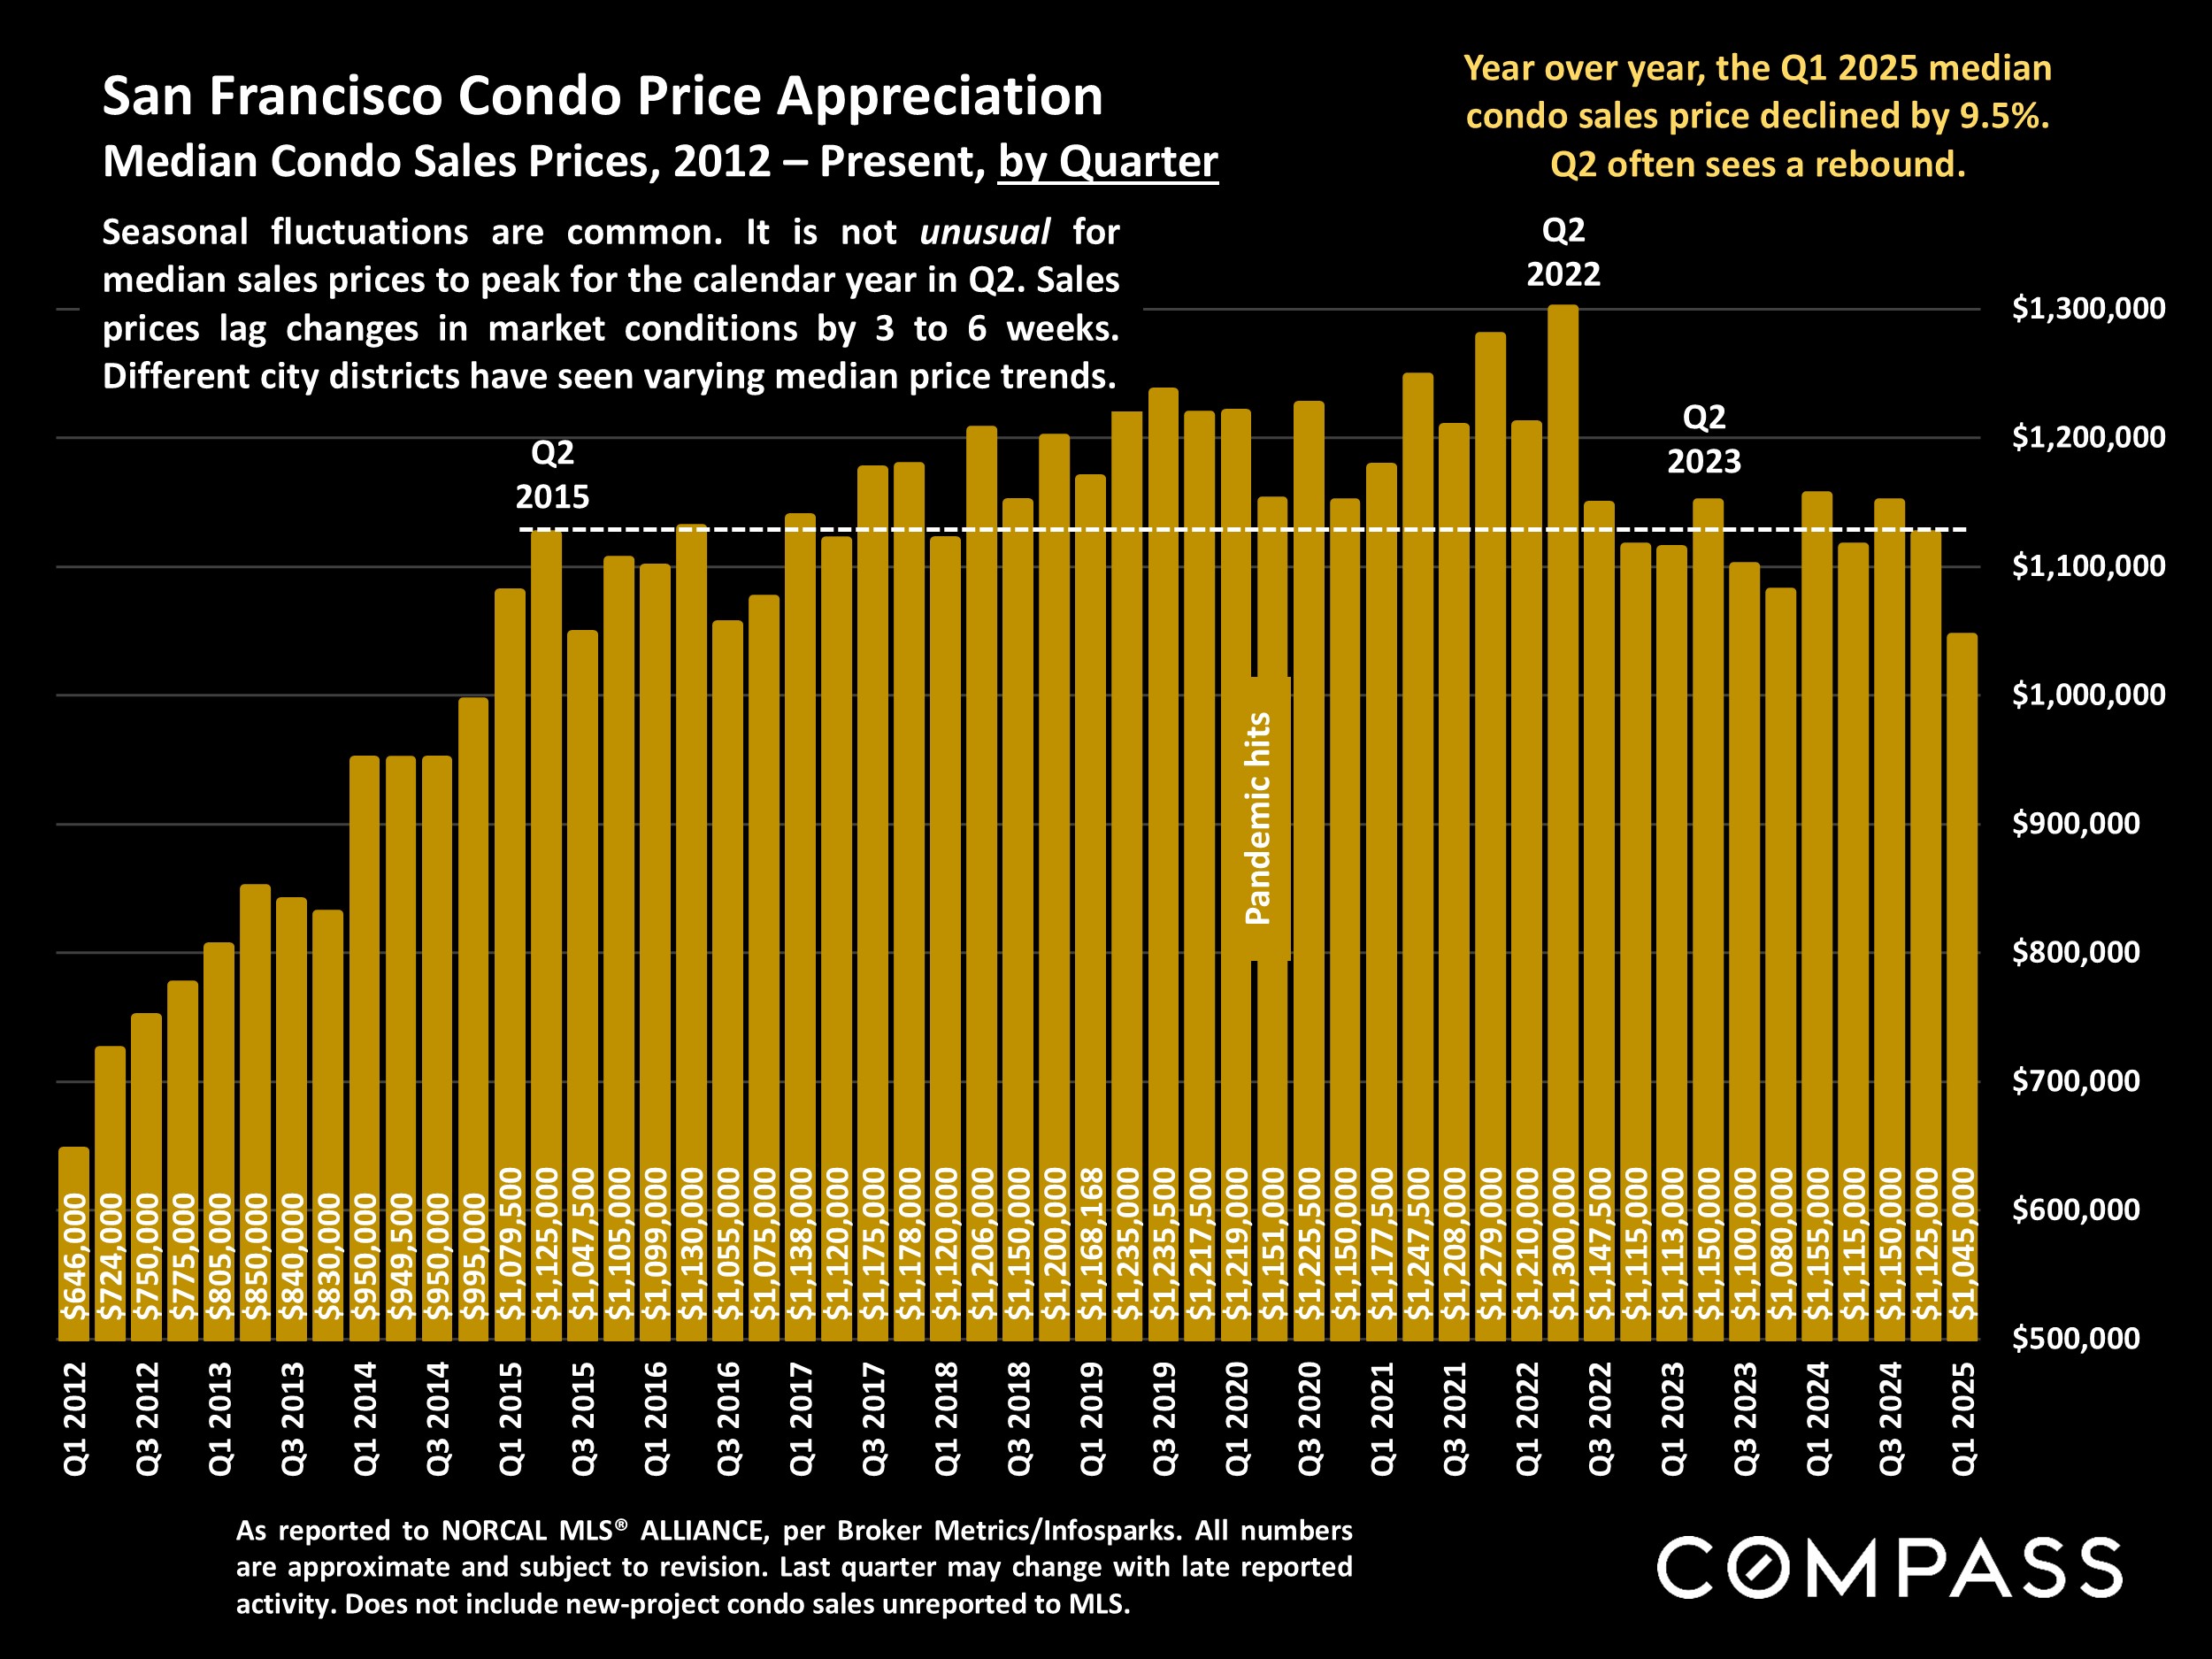
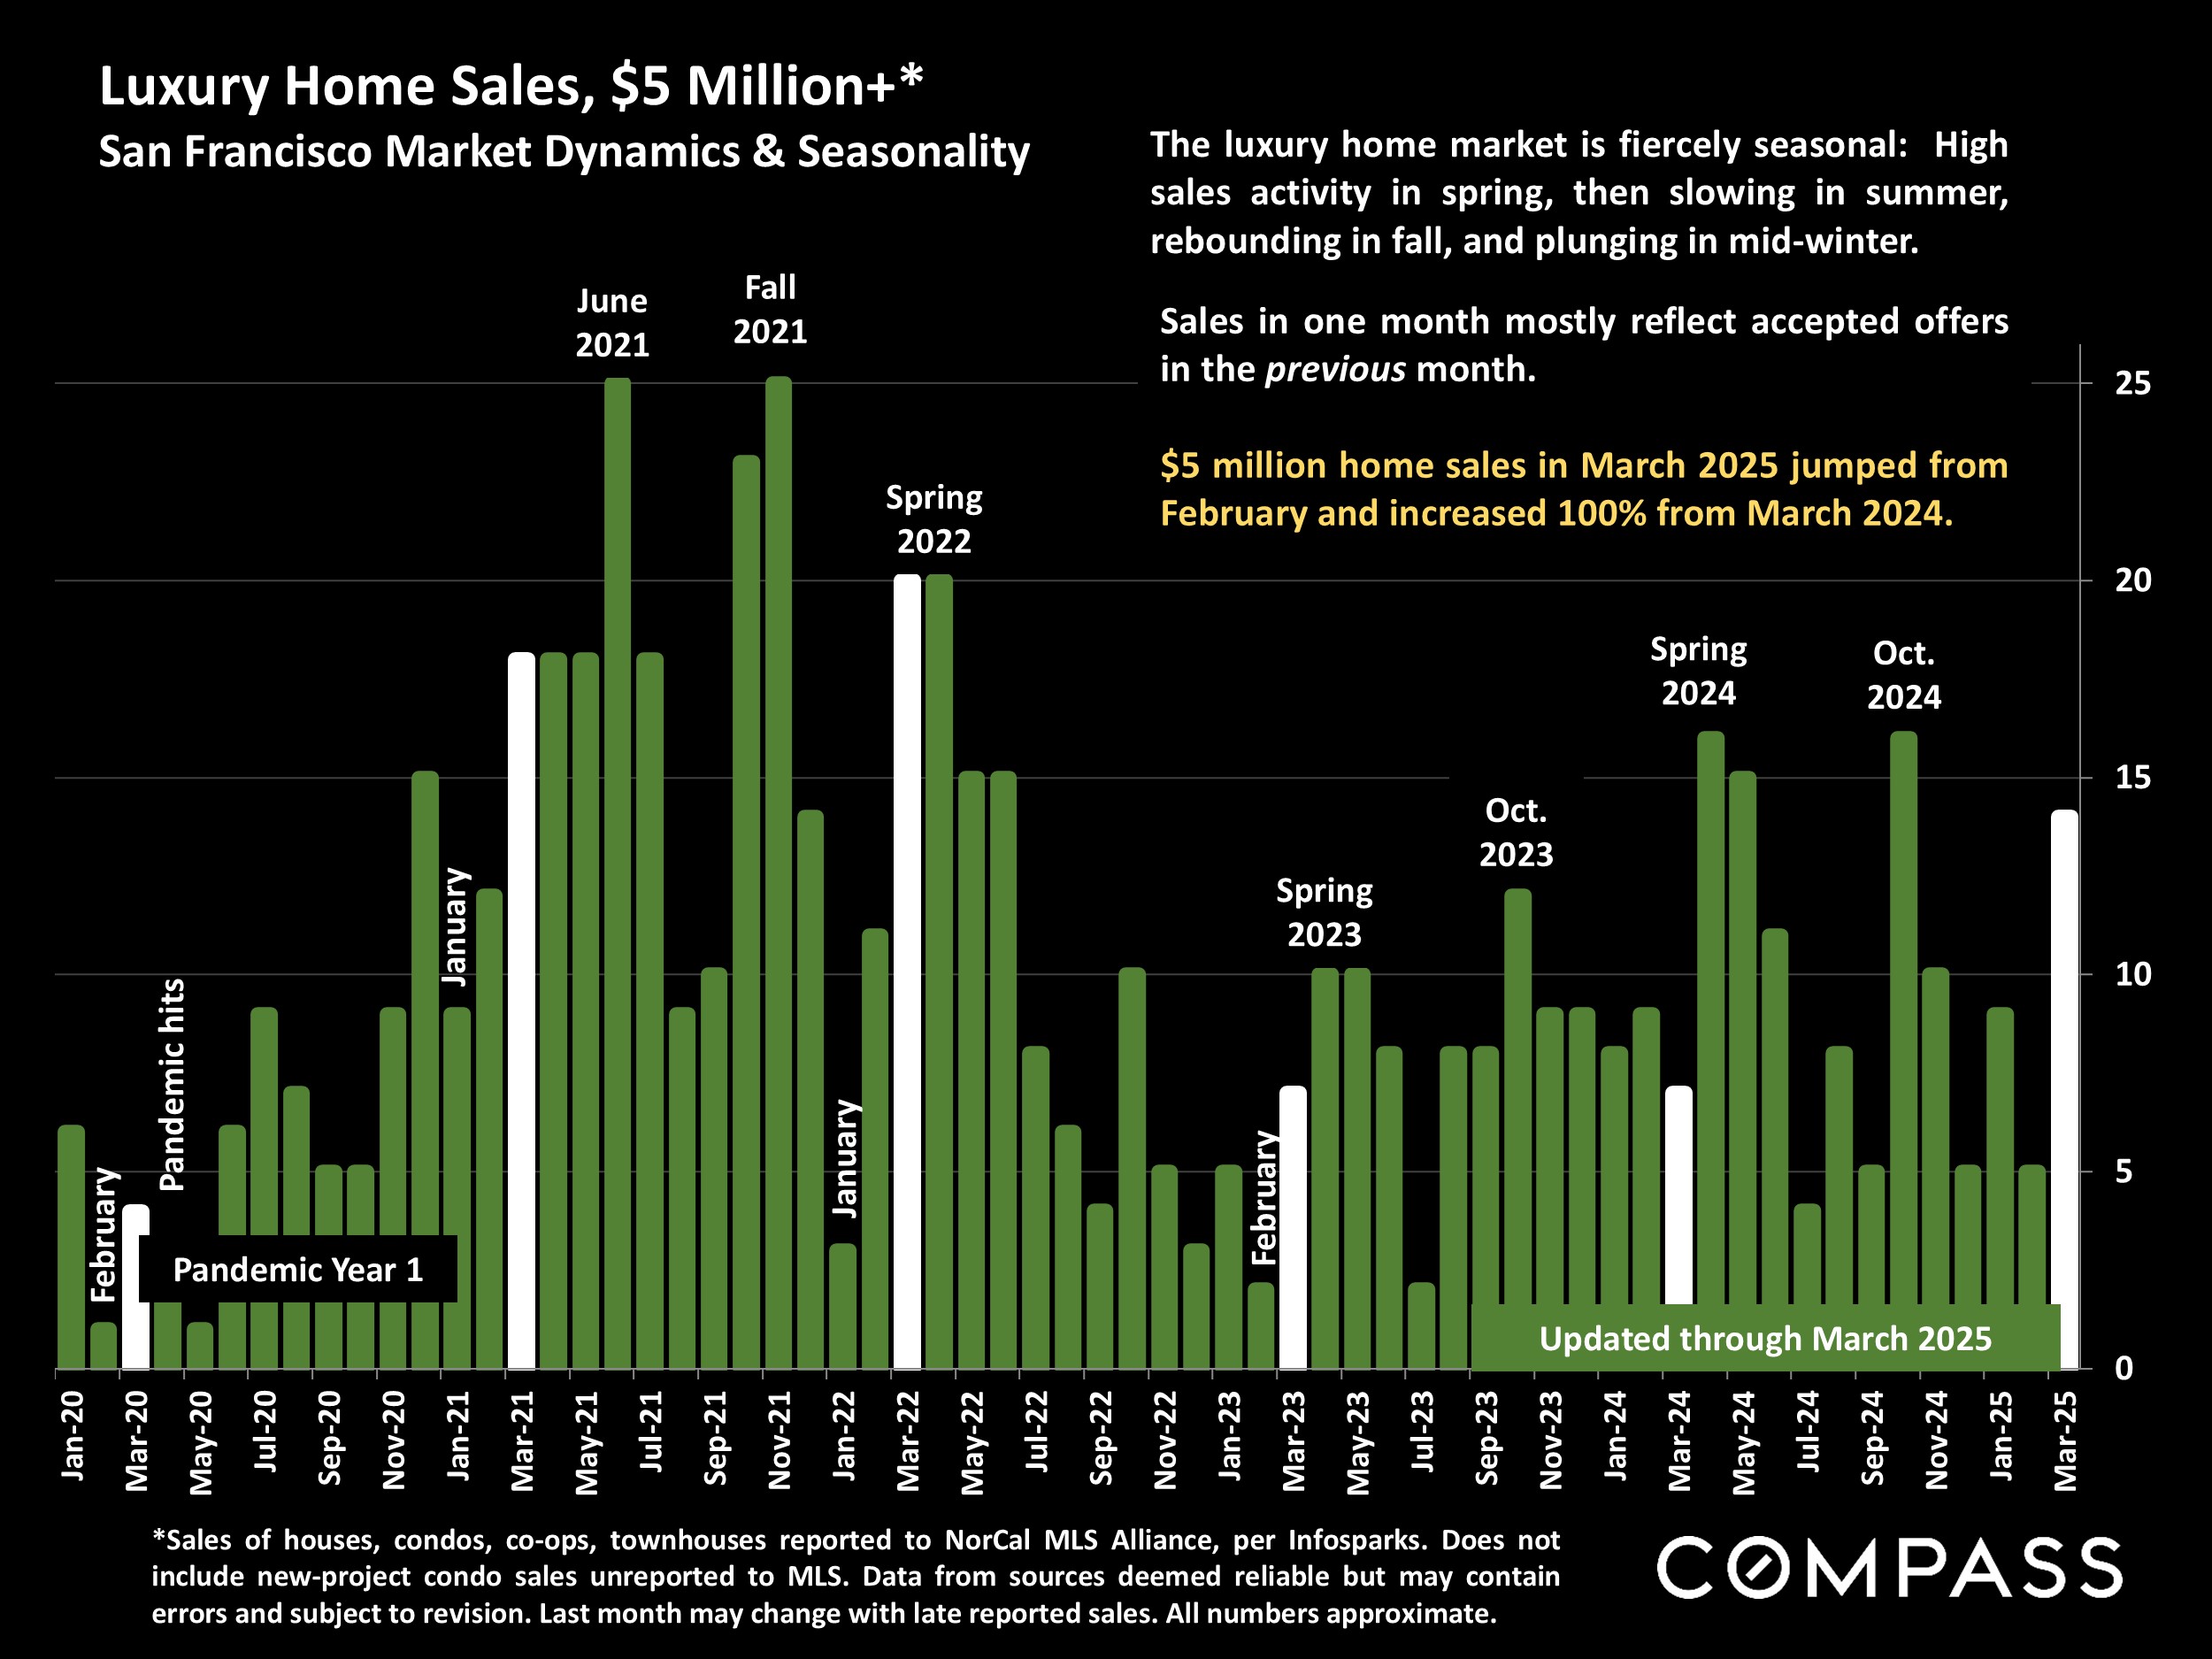
Text page from the April 2025 San Francisco real estate market update, with a Compass wordmark.Chart of San Francisco quarterly median house prices from 2012 to 2025, peaking at $2 million in Q2 2022.Chart of San Francisco quarterly median condo prices, 2012–2025, showing a Q1 2025 price of $1,045,000.Pie chart of San Francisco home sales by property type and bedroom count; two-bedroom condos lead with 1,081 sales.Table comparing median home sale prices, sizes, and price per square foot across 11 Bay Area counties.Chart comparing Bay Area county home values by bedroom and bath count, with San Francisco highlighted.Bay Area condo and townhouse median sales table by county, with San Francisco highlighted.Bar chart of San Francisco population estimates from 2010 to 2024, peaking in 2018 before declining.San Francisco population-change infographic comparing migration, births and deaths, and total change across two periods.Compass chart of San Francisco new listings from January 2021 through March 2025, with seasonal trends highlighted.Bar chart of San Francisco active and coming-soon listings from February 2022 to April 2025; listings rose 7% year over year.San Francisco listings-accepting-offers chart, August 2021–March 2025, with seasonal trends and Compass branding.Chart comparing San Francisco house and condo absorption rates by quarter from 2018 to 2025.Chart of San Francisco monthly home sales, highlighting a 20% increase in March 2025 from March 2024.Chart of San Francisco home sales over list price, fluctuating from 2020 to March 2025; latest rate is 60%.Chart of San Francisco luxury home sales from 2020 to March 2025, with seasonal peaks and a 100% year-over-year increase in March 2025.San Francisco County permit chart, 2009–2024; 931 units in 2024, up 48.5% year over year.

Statistics are generalities, essentially summaries of widely disparate data generated by dozens, hundreds or thousands of unique, individual sales occurring within different time periods. They are best seen not as precise measurements, but as broad, comparative indicators, with reasonable margins of error. Anomalous fluctuations in statistics are not uncommon, especially in smaller, expensive market segments. Last period data should be considered estimates that may change with late-reported data. Different analytics programs sometimes define statistics - such as "active listings," "days on market," and "months supply of inventory" - differently: what is most meaningful are not specific calculations but the trends they illustrate. Most listing and sales data derives from the local or regional multi-listing service (MLS) of the area specified in the analysis, but not all listings or sales are reported to MLS and these won't be reflected in the data. "Homes" signifies real-property, single-household housing units: houses, condos, co-ops, townhouses, duets and TICs (but not mobile homes), as applicable to each market. City/town names refer specifically to the named cities and towns, or their MLS areas, unless otherwise delineated. Multi­county metro areas will be specified as such. Data from sources deemed reliable, but may contain errors and subject to revision. All numbers to be considered approximate.

Many aspects of value cannot be adequately reflected in median and average statistics: curb appeal, age, condition, amenities, views, lot size, quality of outdoor space, "bonus" rooms, additional parking, quality of location within the neighborhood, and so on. How any of these statistics apply to any particular home is unknown without a specific comparative market analysis.

Source: compass.com

 

Work With Jason

Drawing on his decade of experience in finance, investment management, and holistic financial planning, and as a Chartered Financial Analyst ( CFA ® ) charterholder, he leverages his financial acumen and analytical focus to help his clients navigate the sophisticated San Francisco market.
Contact
Follow Us