San Francisco Real Estate Market Update | March 2024

San Francisco real estate report cover with an aerial city and bay view, dated March 2024.
San Francisco real estate report describing market recovery and the spring selling season.
Chart of monthly San Francisco home sales, January 2020–February 2024, with green bars and seasonal annotations.

Chart of San Francisco home sales above $3 million, showing monthly trends from 2020 through January 2024.San Francisco house price chart, 1990–2024, with peaks marked in 2007 and 2022 and February 2024 figures.
Chart of San Francisco condo prices since 2005, with February 2024 prices up about 5.5% year over year.
San Francisco March 2024 market report listing homes for sale by price segment and median asking prices.San Francisco home and condo listings and median prices by Realtor district, in a March 2024 table.
San Francisco monthly new listings chart, December 2019–February 2024, with seasonal peaks and December lows.
Bar chart of San Francisco active listings, February 2022–March 2024, with March totals highlighted.San Francisco pending-sale listings chart, January 2019–February 2024, with seasonal trends and a February rebound note.
San Francisco monthly absorption-rate chart for houses and condos, with a sharp increase in February 2024.
San Francisco days-on-market chart comparing houses and condos from 2020 to February 2024.
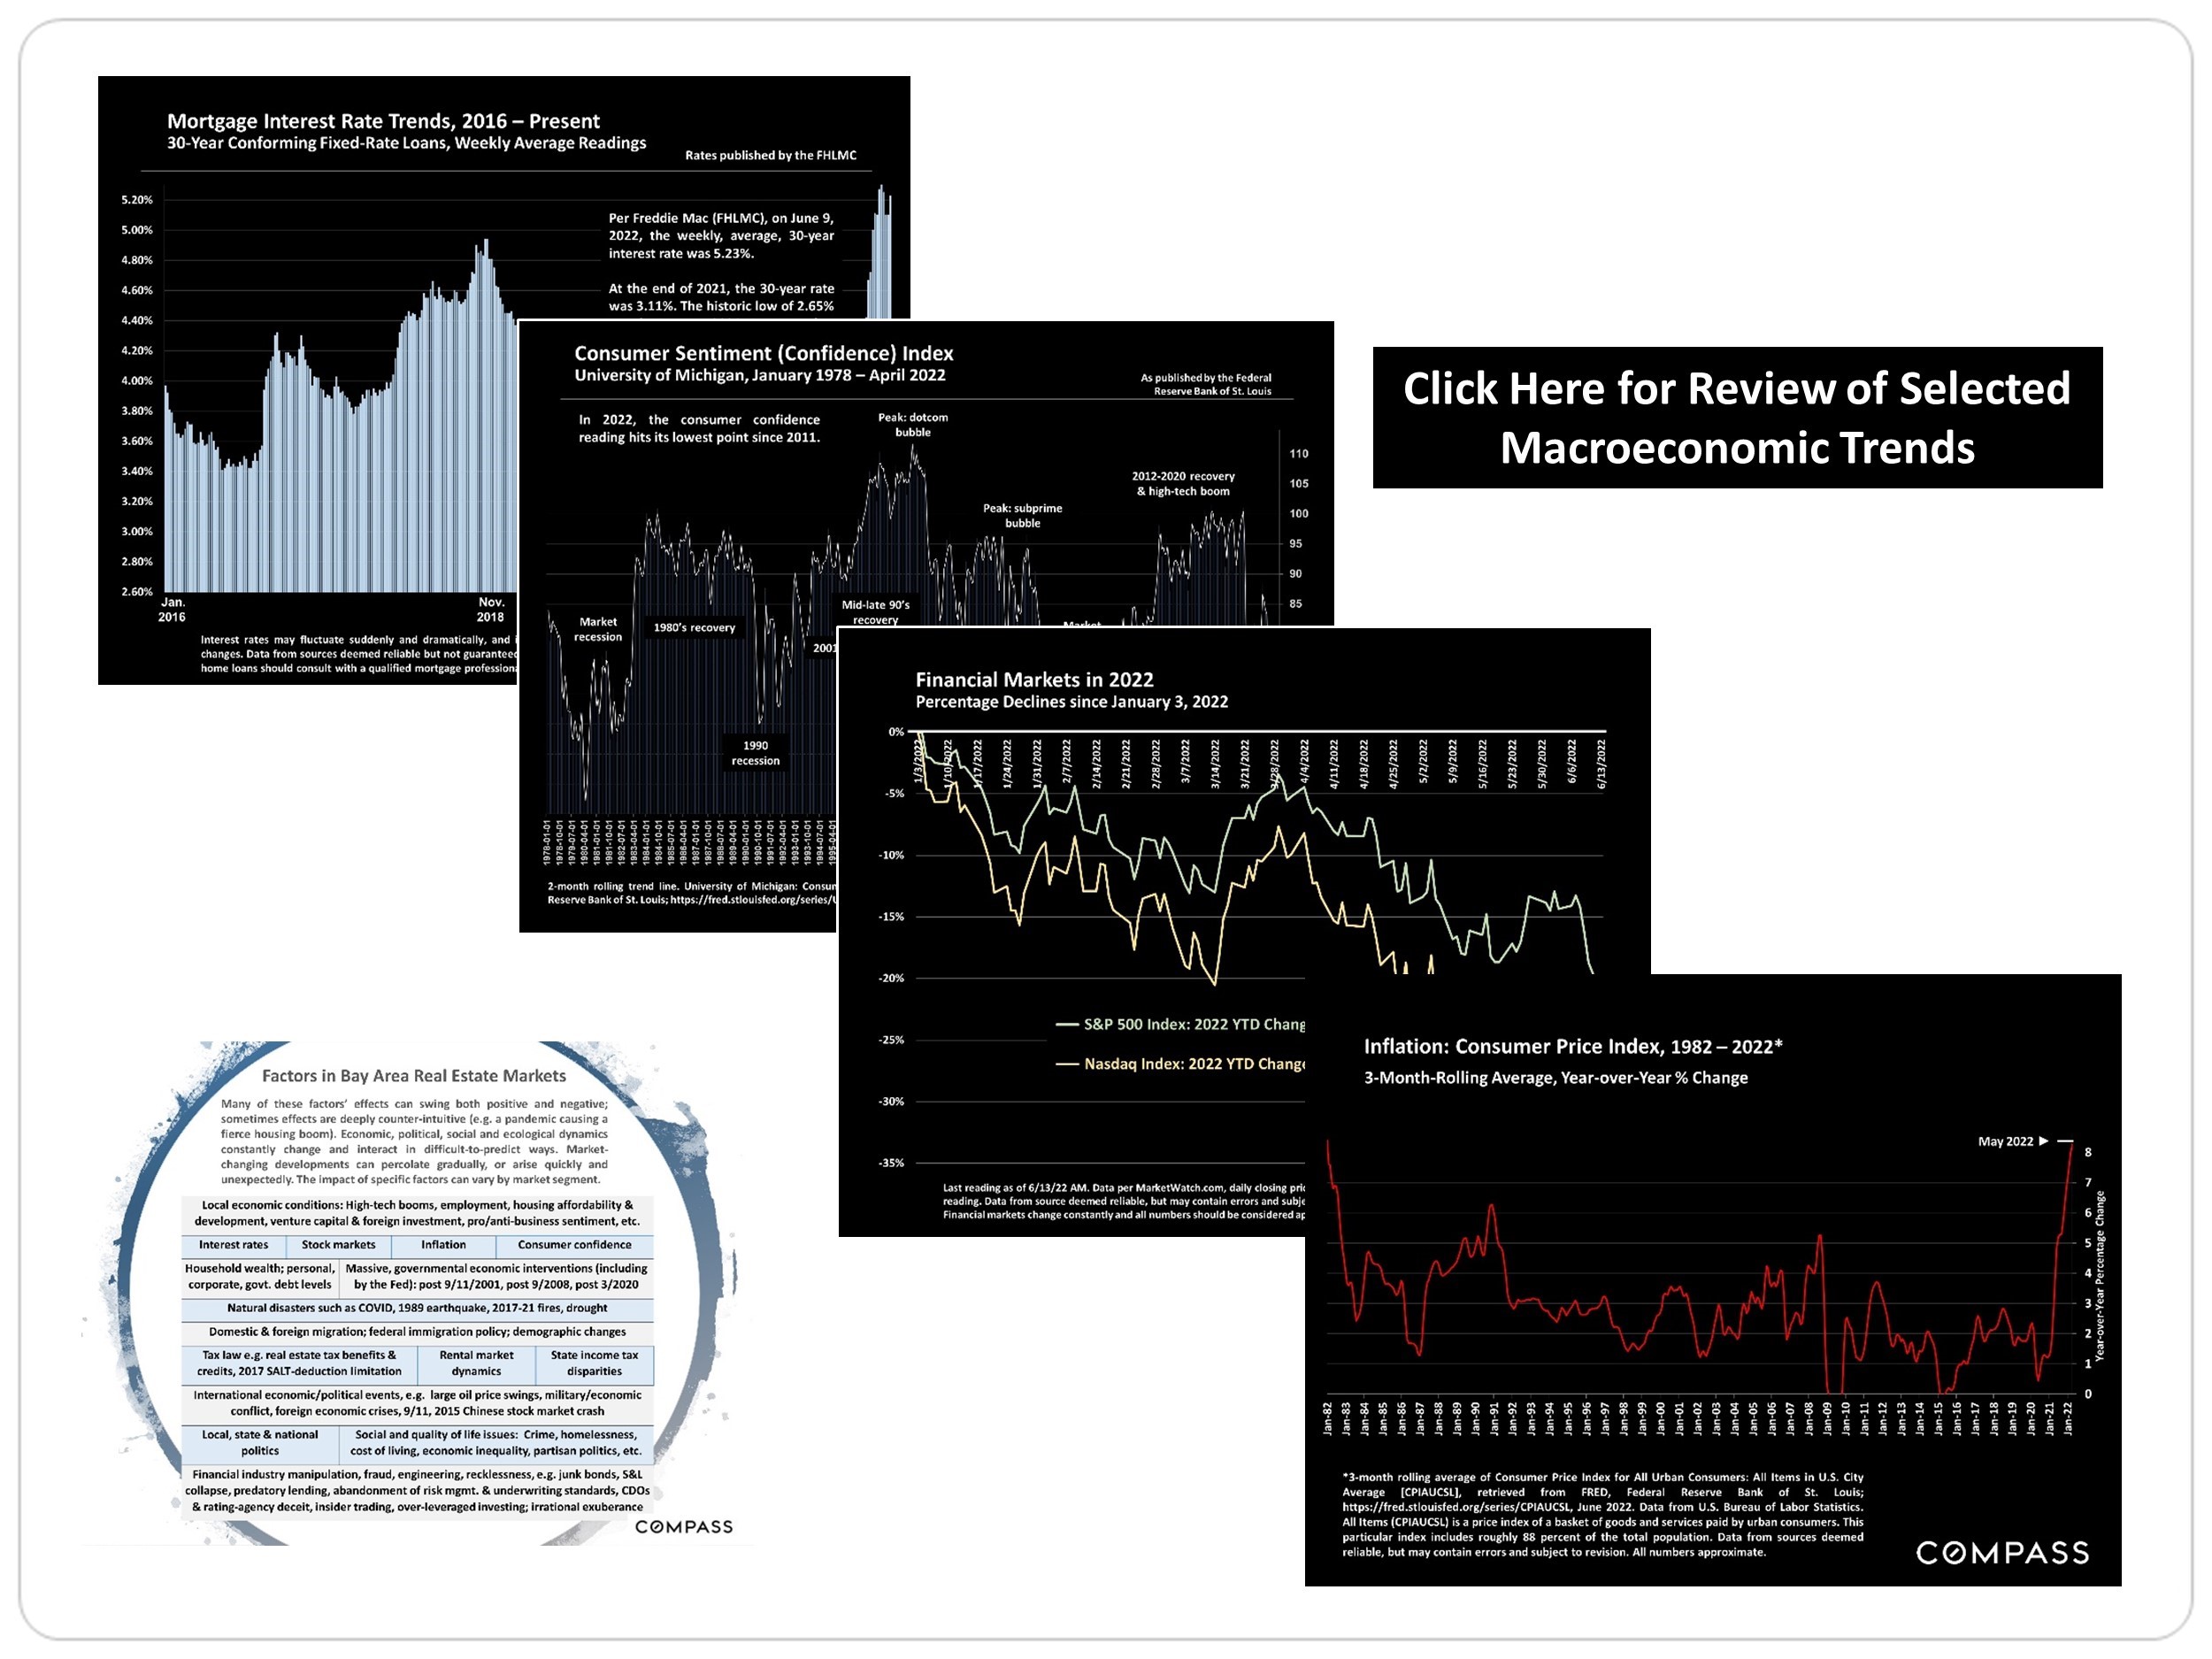
Economic charts on mortgage rates, consumer sentiment, markets, and inflation alongside a Bay Area real estate factors infographic.

Work With Jason

Drawing on his decade of experience in finance, investment management, and holistic financial planning, and as a Chartered Financial Analyst ( CFA ® ) charterholder, he leverages his financial acumen and analytical focus to help his clients navigate the sophisticated San Francisco market.
Contact
Follow Us